Cluster analysis
Katharina Hembach
4/7/2021
Last updated: 2021-09-06
Checks: 7 0
Knit directory: neural_scRNAseq/
This reproducible R Markdown analysis was created with workflowr (version 1.6.2). The Checks tab describes the reproducibility checks that were applied when the results were created. The Past versions tab lists the development history.
Great! Since the R Markdown file has been committed to the Git repository, you know the exact version of the code that produced these results.
Great job! The global environment was empty. Objects defined in the global environment can affect the analysis in your R Markdown file in unknown ways. For reproduciblity it's best to always run the code in an empty environment.
The command set.seed(20200522) was run prior to running the code in the R Markdown file. Setting a seed ensures that any results that rely on randomness, e.g. subsampling or permutations, are reproducible.
Great job! Recording the operating system, R version, and package versions is critical for reproducibility.
Nice! There were no cached chunks for this analysis, so you can be confident that you successfully produced the results during this run.
Great job! Using relative paths to the files within your workflowr project makes it easier to run your code on other machines.
Great! You are using Git for version control. Tracking code development and connecting the code version to the results is critical for reproducibility.
The results in this page were generated with repository version 8f1b6c0. See the Past versions tab to see a history of the changes made to the R Markdown and HTML files.
Note that you need to be careful to ensure that all relevant files for the analysis have been committed to Git prior to generating the results (you can use wflow_publish or wflow_git_commit). workflowr only checks the R Markdown file, but you know if there are other scripts or data files that it depends on. Below is the status of the Git repository when the results were generated:
Ignored files:
    Ignored:    .DS_Store
    Ignored:    .Rhistory
    Ignored:    .Rproj.user/
    Ignored:    ._.DS_Store
    Ignored:    ._Filtered.pdf
    Ignored:    ._Unfiltered.pdf
    Ignored:    .__workflowr.yml
    Ignored:    ._cms_PCA10_k1000_k_min200.pdf
    Ignored:    ._cms_PCA10_k500.pdf
    Ignored:    ._cms_PCA10_k700_batch_min100.pdf
    Ignored:    ._cms_PCA10_k700_batch_min50.pdf
    Ignored:    ._cms_PCA10_k_min100.pdf
    Ignored:    ._cms_PCA10_k_min200.pdf
    Ignored:    ._cms_PCA_10_k700.pdf
    Ignored:    ._cms_umap_PCA.pdf
    Ignored:    ._coverage.pdf
    Ignored:    ._coverage_sashimi.pdf
    Ignored:    ._coverage_sashimi.png
    Ignored:    ._iCLIP_nrXLs_markers.pdf
    Ignored:    ._neural_scRNAseq.Rproj
    Ignored:    ._pbDS_cell_level.pdf
    Ignored:    ._pbDS_top_expr_umap.pdf
    Ignored:    ._pbDS_upset.pdf
    Ignored:    ._sashimi.pdf
    Ignored:    ._stmn2.pdf
    Ignored:    ._tdp.pdf
    Ignored:    ._timeline_k1000.pdf
    Ignored:    ._timeline_k10000.pdf
    Ignored:    ._timeline_k500.pdf
    Ignored:    ._timeline_k5000.pdf
    Ignored:    analysis/.DS_Store
    Ignored:    analysis/.Rhistory
    Ignored:    analysis/._.DS_Store
    Ignored:    analysis/._01-preprocessing.Rmd
    Ignored:    analysis/._01-preprocessing.html
    Ignored:    analysis/._02.1-SampleQC.Rmd
    Ignored:    analysis/._03-filtering.Rmd
    Ignored:    analysis/._04-clustering.Rmd
    Ignored:    analysis/._04-clustering.knit.md
    Ignored:    analysis/._04.1-cell_cycle.Rmd
    Ignored:    analysis/._05-annotation.Rmd
    Ignored:    analysis/._07-cluster-analysis-all-timepoints.Rmd
    Ignored:    analysis/._Lam-0-NSC_no_integration.Rmd
    Ignored:    analysis/._Lam-01-NSC_integration.Rmd
    Ignored:    analysis/._Lam-02-NSC_annotation.Rmd
    Ignored:    analysis/._NSC-1-clustering.Rmd
    Ignored:    analysis/._NSC-2-annotation.Rmd
    Ignored:    analysis/._TDP-06-cluster_analysis.Rmd
    Ignored:    analysis/.__site.yml
    Ignored:    analysis/._additional_filtering.Rmd
    Ignored:    analysis/._additional_filtering_clustering.Rmd
    Ignored:    analysis/._index.Rmd
    Ignored:    analysis/._organoid-01-1-qualtiy-control.Rmd
    Ignored:    analysis/._organoid-01-clustering.Rmd
    Ignored:    analysis/._organoid-02-integration.Rmd
    Ignored:    analysis/._organoid-03-cluster_analysis.Rmd
    Ignored:    analysis/._organoid-04-group_integration.Rmd
    Ignored:    analysis/._organoid-04-stage_integration.Rmd
    Ignored:    analysis/._organoid-05-group_integration_cluster_analysis.Rmd
    Ignored:    analysis/._organoid-05-stage_integration_cluster_analysis.Rmd
    Ignored:    analysis/._organoid-06-1-prepare-sce.Rmd
    Ignored:    analysis/._organoid-06-conos-analysis-Seurat.Rmd
    Ignored:    analysis/._organoid-06-conos-analysis-function.Rmd
    Ignored:    analysis/._organoid-06-conos-analysis.Rmd
    Ignored:    analysis/._organoid-06-group-integration-conos-analysis.Rmd
    Ignored:    analysis/._organoid-07-conos-visualization.Rmd
    Ignored:    analysis/._organoid-07-group-integration-conos-visualization.Rmd
    Ignored:    analysis/._organoid-08-conos-comparison.Rmd
    Ignored:    analysis/._organoid-0x-sample_integration.Rmd
    Ignored:    analysis/01-preprocessing_cache/
    Ignored:    analysis/02-1-SampleQC_cache/
    Ignored:    analysis/02-quality_control_cache/
    Ignored:    analysis/02.1-SampleQC_cache/
    Ignored:    analysis/03-filtering_cache/
    Ignored:    analysis/04-clustering_cache/
    Ignored:    analysis/04.1-cell_cycle_cache/
    Ignored:    analysis/05-annotation_cache/
    Ignored:    analysis/06-clustering-all-timepoints_cache/
    Ignored:    analysis/07-cluster-analysis-all-timepoints_cache/
    Ignored:    analysis/CH-test-01-preprocessing_cache/
    Ignored:    analysis/CH-test-02-transgene-expression_cache/
    Ignored:    analysis/CH-test-03-cluster-analysis_cache/
    Ignored:    analysis/Lam-01-NSC_integration_cache/
    Ignored:    analysis/Lam-02-NSC_annotation_cache/
    Ignored:    analysis/NSC-1-clustering_cache/
    Ignored:    analysis/NSC-2-annotation_cache/
    Ignored:    analysis/TDP-01-preprocessing_cache/
    Ignored:    analysis/TDP-02-quality_control_cache/
    Ignored:    analysis/TDP-03-filtering_cache/
    Ignored:    analysis/TDP-04-clustering_cache/
    Ignored:    analysis/TDP-05-00-filtering-plasmid-QC_cache/
    Ignored:    analysis/TDP-05-plasmid_expression_cache/
    Ignored:    analysis/TDP-06-01-totalTDP-construct-quantification_cache/
    Ignored:    analysis/TDP-06-cluster_analysis_cache/
    Ignored:    analysis/TDP-07-01-STMN2_expression_cache/
    Ignored:    analysis/TDP-07-02-Prudencio_marker_expression_cache/
    Ignored:    analysis/TDP-07-03-Liu_sorted_nuclei_marker_expression_cache/
    Ignored:    analysis/TDP-07-04-Tollervey_marker_binding_cache/
    Ignored:    analysis/TDP-07-05-marker_gene_read_coverage_cache/
    Ignored:    analysis/TDP-07-cluster_12_cache/
    Ignored:    analysis/TDP-08-00-clustering-HA-D96_cache/
    Ignored:    analysis/TDP-08-01-HA-D96-expression-changes_cache/
    Ignored:    analysis/TDP-08-02-TDP_target_genes_cache/
    Ignored:    analysis/TDP-08-clustering-timeline-HA_cache/
    Ignored:    analysis/additional_filtering_cache/
    Ignored:    analysis/additional_filtering_clustering_cache/
    Ignored:    analysis/figure/
    Ignored:    analysis/organoid-01-1-qualtiy-control_cache/
    Ignored:    analysis/organoid-01-clustering_cache/
    Ignored:    analysis/organoid-02-integration_cache/
    Ignored:    analysis/organoid-03-cluster_analysis_cache/
    Ignored:    analysis/organoid-04-group_integration_cache/
    Ignored:    analysis/organoid-04-stage_integration_cache/
    Ignored:    analysis/organoid-05-group_integration_cluster_analysis_cache/
    Ignored:    analysis/organoid-05-stage_integration_cluster_analysis_cache/
    Ignored:    analysis/organoid-06-conos-analysis_cache/
    Ignored:    analysis/organoid-06-conos-analysis_test_cache/
    Ignored:    analysis/organoid-06-group-integration-conos-analysis_cache/
    Ignored:    analysis/organoid-07-conos-visualization_cache/
    Ignored:    analysis/organoid-07-group-integration-conos-visualization_cache/
    Ignored:    analysis/organoid-08-conos-comparison_cache/
    Ignored:    analysis/organoid-0x-sample_integration_cache/
    Ignored:    analysis/sample5_QC_cache/
    Ignored:    analysis/timepoints-01-organoid-integration_cache/
    Ignored:    data/.DS_Store
    Ignored:    data/._.DS_Store
    Ignored:    data/._.smbdeleteAAA17ed8b4b
    Ignored:    data/._Lam_figure2_markers.R
    Ignored:    data/._README.md
    Ignored:    data/._Reactive_astrocytes_markers.xlsx
    Ignored:    data/._known_NSC_markers.R
    Ignored:    data/._known_cell_type_markers.R
    Ignored:    data/._metadata.csv
    Ignored:    data/._virus_cell_tropism_markers.R
    Ignored:    data/._~$Reactive_astrocytes_markers.xlsx
    Ignored:    data/data_sushi/
    Ignored:    data/filtered_feature_matrices/
    Ignored:    output/.DS_Store
    Ignored:    output/._.DS_Store
    Ignored:    output/._Liu_TDP_neg_vs_pos_edgeR_dge_results.txt
    Ignored:    output/._NSC_cluster2_marker_genes.txt
    Ignored:    output/._TDP-06-no_integration_cluster12_marker_genes.txt
    Ignored:    output/._TDP-06-no_integration_cluster13_marker_genes.txt
    Ignored:    output/._organoid_integration_cluster1_marker_genes.txt
    Ignored:    output/._tbl_TDP-08-01-muscat_cluster_0.txt
    Ignored:    output/._tbl_TDP-08-01-muscat_cluster_1.txt
    Ignored:    output/._tbl_TDP-08-01-muscat_cluster_10.txt
    Ignored:    output/._tbl_TDP-08-01-muscat_cluster_11.txt
    Ignored:    output/._tbl_TDP-08-01-muscat_cluster_12.txt
    Ignored:    output/._tbl_TDP-08-01-muscat_cluster_13.txt
    Ignored:    output/._tbl_TDP-08-01-muscat_cluster_14.txt
    Ignored:    output/._tbl_TDP-08-01-muscat_cluster_5.txt
    Ignored:    output/._tbl_TDP-08-01-muscat_cluster_7.txt
    Ignored:    output/._tbl_TDP-08-01-muscat_cluster_8.txt
    Ignored:    output/._tbl_TDP-08-01-muscat_cluster_all.xlsx
    Ignored:    output/._tbl_TDP-08-02-targets_hek_cluster_0.txt
    Ignored:    output/._tbl_TDP-08-02-targets_hek_cluster_1.txt
    Ignored:    output/._tbl_TDP-08-02-targets_hek_cluster_10.txt
    Ignored:    output/._tbl_TDP-08-02-targets_hek_cluster_11.txt
    Ignored:    output/._tbl_TDP-08-02-targets_hek_cluster_12.txt
    Ignored:    output/._tbl_TDP-08-02-targets_hek_cluster_13.txt
    Ignored:    output/._tbl_TDP-08-02-targets_hek_cluster_14.txt
    Ignored:    output/._tbl_TDP-08-02-targets_hek_cluster_5.txt
    Ignored:    output/._tbl_TDP-08-02-targets_hek_cluster_7.txt
    Ignored:    output/._tbl_TDP-08-02-targets_hek_cluster_8.txt
    Ignored:    output/._tbl_TDP-08-02-targets_hek_cluster_all.xlsx
    Ignored:    output/._~$tbl_TDP-08-02-targets_hek_cluster_all.xlsx
    Ignored:    output/CH-test-01-preprocessing.rds
    Ignored:    output/CH-test-01-preprocessing_singlets.rds
    Ignored:    output/CH-test-01-preprocessing_singlets_filtered.rds
    Ignored:    output/CH-test-01-preprocessing_so.rds
    Ignored:    output/CH-test-01-preprocessing_so_filtered.rds
    Ignored:    output/CH-test-03-cluster-analysis_so.rds
    Ignored:    output/CH-test-03_scran_markers.rds
    Ignored:    output/Lam-01-clustering.rds
    Ignored:    output/Liu_TDP_neg_vs_pos_edgeR_dge.rds
    Ignored:    output/Liu_TDP_neg_vs_pos_edgeR_dge_results.txt
    Ignored:    output/NSC_1_clustering.rds
    Ignored:    output/NSC_cluster1_marker_genes.txt
    Ignored:    output/NSC_cluster2_marker_genes.txt
    Ignored:    output/NSC_cluster3_marker_genes.txt
    Ignored:    output/NSC_cluster4_marker_genes.txt
    Ignored:    output/NSC_cluster5_marker_genes.txt
    Ignored:    output/NSC_cluster6_marker_genes.txt
    Ignored:    output/NSC_cluster7_marker_genes.txt
    Ignored:    output/TDP-06-no_integration_cluster0_marker_genes.txt
    Ignored:    output/TDP-06-no_integration_cluster10_marker_genes.txt
    Ignored:    output/TDP-06-no_integration_cluster11_marker_genes.txt
    Ignored:    output/TDP-06-no_integration_cluster12_marker_genes.txt
    Ignored:    output/TDP-06-no_integration_cluster13_marker_genes.txt
    Ignored:    output/TDP-06-no_integration_cluster14_marker_genes.txt
    Ignored:    output/TDP-06-no_integration_cluster15_marker_genes.txt
    Ignored:    output/TDP-06-no_integration_cluster16_marker_genes.txt
    Ignored:    output/TDP-06-no_integration_cluster17_marker_genes.txt
    Ignored:    output/TDP-06-no_integration_cluster1_marker_genes.txt
    Ignored:    output/TDP-06-no_integration_cluster2_marker_genes.txt
    Ignored:    output/TDP-06-no_integration_cluster3_marker_genes.txt
    Ignored:    output/TDP-06-no_integration_cluster4_marker_genes.txt
    Ignored:    output/TDP-06-no_integration_cluster5_marker_genes.txt
    Ignored:    output/TDP-06-no_integration_cluster6_marker_genes.txt
    Ignored:    output/TDP-06-no_integration_cluster7_marker_genes.txt
    Ignored:    output/TDP-06-no_integration_cluster8_marker_genes.txt
    Ignored:    output/TDP-06-no_integration_cluster9_marker_genes.txt
    Ignored:    output/TDP-06_scran_markers.rds
    Ignored:    output/additional_filtering.rds
    Ignored:    output/conos/
    Ignored:    output/conos_organoid-06-conos-analysis.rds
    Ignored:    output/conos_organoid-06-group-integration-conos-analysis.rds
    Ignored:    output/figures/
    Ignored:    output/organoid_integration_cluster10_marker_genes.txt
    Ignored:    output/organoid_integration_cluster11_marker_genes.txt
    Ignored:    output/organoid_integration_cluster12_marker_genes.txt
    Ignored:    output/organoid_integration_cluster13_marker_genes.txt
    Ignored:    output/organoid_integration_cluster14_marker_genes.txt
    Ignored:    output/organoid_integration_cluster15_marker_genes.txt
    Ignored:    output/organoid_integration_cluster16_marker_genes.txt
    Ignored:    output/organoid_integration_cluster17_marker_genes.txt
    Ignored:    output/organoid_integration_cluster1_marker_genes.txt
    Ignored:    output/organoid_integration_cluster2_marker_genes.txt
    Ignored:    output/organoid_integration_cluster3_marker_genes.txt
    Ignored:    output/organoid_integration_cluster4_marker_genes.txt
    Ignored:    output/organoid_integration_cluster5_marker_genes.txt
    Ignored:    output/organoid_integration_cluster6_marker_genes.txt
    Ignored:    output/organoid_integration_cluster7_marker_genes.txt
    Ignored:    output/organoid_integration_cluster8_marker_genes.txt
    Ignored:    output/organoid_integration_cluster9_marker_genes.txt
    Ignored:    output/paper_supplement/
    Ignored:    output/res_TDP-08-01-muscat.rds
    Ignored:    output/sce_01_preprocessing.rds
    Ignored:    output/sce_02_quality_control.rds
    Ignored:    output/sce_03_filtering.rds
    Ignored:    output/sce_03_filtering_all_genes.rds
    Ignored:    output/sce_06-1-prepare-sce.rds
    Ignored:    output/sce_TDP-06-01-totalTDP-construct-quantification.rds
    Ignored:    output/sce_TDP-08-01-muscat.rds
    Ignored:    output/sce_TDP_01_preprocessing.rds
    Ignored:    output/sce_TDP_02_quality_control.rds
    Ignored:    output/sce_TDP_03_filtering.rds
    Ignored:    output/sce_TDP_03_filtering_all_genes.rds
    Ignored:    output/sce_organoid-01-clustering.rds
    Ignored:    output/sce_preprocessing.rds
    Ignored:    output/so_04-stage_integration.rds
    Ignored:    output/so_04_1_cell_cycle.rds
    Ignored:    output/so_04_clustering.rds
    Ignored:    output/so_06-clustering_all_timepoints.rds
    Ignored:    output/so_08-00_clustering_HA_D96.rds
    Ignored:    output/so_08-clustering_timeline_HA.rds
    Ignored:    output/so_0x-sample_integration.rds
    Ignored:    output/so_CH-test-02-transgene_expression.rds
    Ignored:    output/so_TDP-06-01-totalTDP-construct-quantification.rds
    Ignored:    output/so_TDP-06-cluster-analysis.rds
    Ignored:    output/so_TDP_04_clustering.rds
    Ignored:    output/so_TDP_05_plasmid_expression.rds
    Ignored:    output/so_additional_filtering_clustering.rds
    Ignored:    output/so_integrated_organoid-02-integration.rds
    Ignored:    output/so_merged_organoid-02-integration.rds
    Ignored:    output/so_organoid-01-clustering.rds
    Ignored:    output/so_sample_organoid-01-clustering.rds
    Ignored:    output/so_timepoints-01-organoid_integration.rds
    Ignored:    output/tbl_TDP-08-01-muscat.rds
    Ignored:    output/tbl_TDP-08-01-muscat_cluster_0.txt
    Ignored:    output/tbl_TDP-08-01-muscat_cluster_1.txt
    Ignored:    output/tbl_TDP-08-01-muscat_cluster_10.txt
    Ignored:    output/tbl_TDP-08-01-muscat_cluster_11.txt
    Ignored:    output/tbl_TDP-08-01-muscat_cluster_12.txt
    Ignored:    output/tbl_TDP-08-01-muscat_cluster_13.txt
    Ignored:    output/tbl_TDP-08-01-muscat_cluster_14.txt
    Ignored:    output/tbl_TDP-08-01-muscat_cluster_5.txt
    Ignored:    output/tbl_TDP-08-01-muscat_cluster_7.txt
    Ignored:    output/tbl_TDP-08-01-muscat_cluster_8.txt
    Ignored:    output/tbl_TDP-08-01-muscat_cluster_all.xlsx
    Ignored:    output/tbl_TDP-08-02-targets_hek.rds
    Ignored:    output/tbl_TDP-08-02-targets_hek_cluster_0.txt
    Ignored:    output/tbl_TDP-08-02-targets_hek_cluster_1.txt
    Ignored:    output/tbl_TDP-08-02-targets_hek_cluster_10.txt
    Ignored:    output/tbl_TDP-08-02-targets_hek_cluster_11.txt
    Ignored:    output/tbl_TDP-08-02-targets_hek_cluster_12.txt
    Ignored:    output/tbl_TDP-08-02-targets_hek_cluster_13.txt
    Ignored:    output/tbl_TDP-08-02-targets_hek_cluster_14.txt
    Ignored:    output/tbl_TDP-08-02-targets_hek_cluster_5.txt
    Ignored:    output/tbl_TDP-08-02-targets_hek_cluster_7.txt
    Ignored:    output/tbl_TDP-08-02-targets_hek_cluster_8.txt
    Ignored:    output/tbl_TDP-08-02-targets_hek_cluster_all.xlsx
    Ignored:    output/~$tbl_TDP-08-02-targets_hek_cluster_all.xlsx
    Ignored:    scripts/.DS_Store
    Ignored:    scripts/._.DS_Store
    Ignored:    scripts/._bu_Rcode.R
    Ignored:    scripts/._plasmid_expression.sh
    Ignored:    scripts/._plasmid_expression_cell_hashing_test.sh
    Ignored:    scripts/._plasmid_expression_total_TDP.sh
    Ignored:    scripts/._prepare_salmon_transcripts.R
    Ignored:    scripts/._prepare_salmon_transcripts_cell_hashing_test.R

Untracked files:
    Untracked:  Filtered.pdf
    Untracked:  Hist(sce)
    Untracked:  Unfiltered
    Untracked:  Unfiltered.pdf
    Untracked:  analysis/.TDP-06-01-totalTDP-construct-quantification.Rmd.swp
    Untracked:  analysis/Lam-0-NSC_no_integration.Rmd
    Untracked:  analysis/TDP-06-01-totalTDP-construct-quantification_bu.Rmd
    Untracked:  analysis/TDP-07-01-STMN2_expression copy.Rmd
    Untracked:  analysis/TDP-07-05-marker_gene_read_coverage.Rmd
    Untracked:  analysis/additional_filtering.Rmd
    Untracked:  analysis/additional_filtering_clustering.Rmd
    Untracked:  analysis/organoid-01-1-qualtiy-control.Rmd
    Untracked:  analysis/organoid-06-conos-analysis-Seurat.Rmd
    Untracked:  analysis/organoid-06-conos-analysis-function.Rmd
    Untracked:  analysis/organoid-07-conos-visualization.Rmd
    Untracked:  analysis/organoid-07-group-integration-conos-visualization.Rmd
    Untracked:  analysis/organoid-08-conos-comparison.Rmd
    Untracked:  analysis/organoid-0x-sample_integration.Rmd
    Untracked:  analysis/sample5_QC.Rmd
    Untracked:  cms_PCA10_k1000_k_min200.pdf
    Untracked:  cms_PCA10_k500.pdf
    Untracked:  cms_PCA10_k700_batch_min100.pdf
    Untracked:  cms_PCA10_k700_batch_min50.pdf
    Untracked:  cms_PCA10_k_min100.pdf
    Untracked:  cms_PCA10_k_min200.pdf
    Untracked:  cms_PCA_10_k700.pdf
    Untracked:  cms_umap_PCA.pdf
    Untracked:  coverage.pdf
    Untracked:  coverage_sashimi.pdf
    Untracked:  coverage_sashimi.png
    Untracked:  data/Homo_sapiens.GRCh38.98.sorted.gtf
    Untracked:  data/Jun2021/
    Untracked:  data/Kanton_et_al/
    Untracked:  data/Lam_et_al/
    Untracked:  data/Liu_et_al/
    Untracked:  data/Prudencio_et_al/
    Untracked:  data/Sep2020/
    Untracked:  data/cell_hashing_test/
    Untracked:  data/reference/
    Untracked:  data/virus_cell_tropism_markers.R
    Untracked:  data/~$Reactive_astrocytes_markers.xlsx
    Untracked:  iCLIP_nrXLs_markers.pdf
    Untracked:  pbDS_cell_level.pdf
    Untracked:  pbDS_heatmap.pdf
    Untracked:  pbDS_top_expr_umap.pdf
    Untracked:  pbDS_upset.pdf
    Untracked:  sashimi.pdf
    Untracked:  scripts/bu_Rcode.R
    Untracked:  scripts/bu_code.Rmd
    Untracked:  scripts/plasmid_expression_cell_hashing_test.sh
    Untracked:  scripts/plasmid_expression_total_TDP.sh
    Untracked:  scripts/prepare_salmon_transcripts_cell_hashing_test.R
    Untracked:  scripts/prepare_salmon_transcripts_total_TDP.R
    Untracked:  scripts/salmon-latest_linux_x86_64/
    Untracked:  stmn2.pdf
    Untracked:  tdp.pdf
    Untracked:  timeline_k1000.pdf
    Untracked:  timeline_k10000.pdf
    Untracked:  timeline_k500.pdf
    Untracked:  timeline_k5000.pdf

Unstaged changes:
    Modified:   analysis/05-annotation.Rmd
    Modified:   analysis/TDP-04-clustering.Rmd
    Modified:   analysis/TDP-07-01-STMN2_expression.Rmd
    Modified:   analysis/TDP-07-cluster_12.Rmd
    Modified:   analysis/TDP-08-01-HA-D96-expression-changes.Rmd
    Modified:   analysis/_site.yml
    Modified:   analysis/organoid-02-integration.Rmd
    Modified:   analysis/organoid-04-group_integration.Rmd
    Modified:   analysis/organoid-06-conos-analysis.Rmd
Note that any generated files, e.g. HTML, png, CSS, etc., are not included in this status report because it is ok for generated content to have uncommitted changes.
These are the previous versions of the repository in which changes were made to the R Markdown (analysis/timepoints-02-cluster-analysis.Rmd) and HTML (docs/timepoints-02-cluster-analysis.html) files. If you've configured a remote Git repository (see ?wflow_git_remote), click on the hyperlinks in the table below to view the files as they were in that past version.
| File | Version | Author | Date | Message |
|---|---|---|---|---|
| Rmd | 8f1b6c0 | khembach | 2021-09-06 | compute and visualize cms score with CellMixS |
| html | 917cd29 | khembach | 2021-08-31 | Build site. |
| Rmd | 24d0bcc | khembach | 2021-08-31 | compare cluster distribution before and after integration of organoid |
| html | bdd5187 | khembach | 2021-06-16 | Build site. |
| Rmd | a6ee6b3 | khembach | 2021-06-16 | use 15k cells for UMAP |
| html | c551eef | khembach | 2021-06-02 | Build site. |
| Rmd | 88cf42a | khembach | 2021-06-02 | add DR with new colors for manuscript |
| html | 6d0fe5e | khembach | 2021-04-08 | Build site. |
| Rmd | 6e38cc0 | khembach | 2021-04-08 | add cell line by cluster heatmap |
| html | f20c60a | khembach | 2021-04-08 | Build site. |
| Rmd | 0692bda | khembach | 2021-04-08 | adjust heatmap sizes |
| html | 3b9b3d6 | khembach | 2021-04-08 | Build site. |
| Rmd | 659479a | khembach | 2021-04-08 | adjust heatmap sizes |
| html | f219ac6 | khembach | 2021-04-08 | Build site. |
| Rmd | 6525819 | khembach | 2021-04-08 | cluster analysis of integrated full timeline and organoid data |
Load packages
library(ComplexHeatmap)
library(cowplot)
library(ggplot2)
library(dplyr)
library(muscat)
library(RColorBrewer)
library(Seurat)
library(SingleCellExperiment)
library(CellMixS)
library(BiocParallel)
Load data & convert to SCE
so <- readRDS(file.path("output", "so_timepoints-01-organoid_integration.rds"))
sce <- as.SingleCellExperiment(so, assay = "RNA")
colData(sce) <- as.data.frame(colData(sce)) %>%
    mutate_if(is.character, as.factor) %>%
    DataFrame(row.names = colnames(sce))
levels(sce$integration_group)[levels(sce$integration_group) == "NC"] <- "iCoMoNSC"
sce$integration_group <- relevel(sce$integration_group, "iCoMoNSC")
Cluster-sample counts
(n_cells <- table(sce$cluster_id, sce$integration_group))
     iCoMoNSC 409b2   H9
  0      9355  1455 2356
  1      9548   303  345
  2       241  2504 4353
  3      6838    84   88
  4      5809   544  412
  5      2992  1787 1074
  6        73  2623 2972
  7      4028  1097  454
  8       732  1495 3199
  9      4260   533  443
  10     1170  2061 1611
  11      139  1747 1759
  12     1644   581  427
  13      209  1263 1045
  14     2358     5    2
  15     1245   461  582
  16      227   760  933
  17      292   494  640
  18     1410     5    2
  19      959   115   53
  20       12   301  448
  21      169    54   28
Relative cluster-abundances
fqs <- prop.table(n_cells, margin = 2)
mat <- round(as.matrix(unclass(fqs))*100, 1)
colfunc <- colorRampPalette(c("ghostwhite", "deepskyblue4"))
Heatmap(mat,
    col = colfunc(10),
    name = "Percentage\nof cells",
    cluster_rows = FALSE,
    cluster_columns = FALSE,
    row_names_side = "left",
    row_title = "cluster ID",
    column_title = "cell line",
    column_title_side = "bottom",
    rect_gp = gpar(col = "white"),
    cell_fun = function(i, j, x, y, width, height, fill)
        grid.text(mat[j, i], x = x, y = y,
            gp = gpar(col = "black", fontsize = 10)))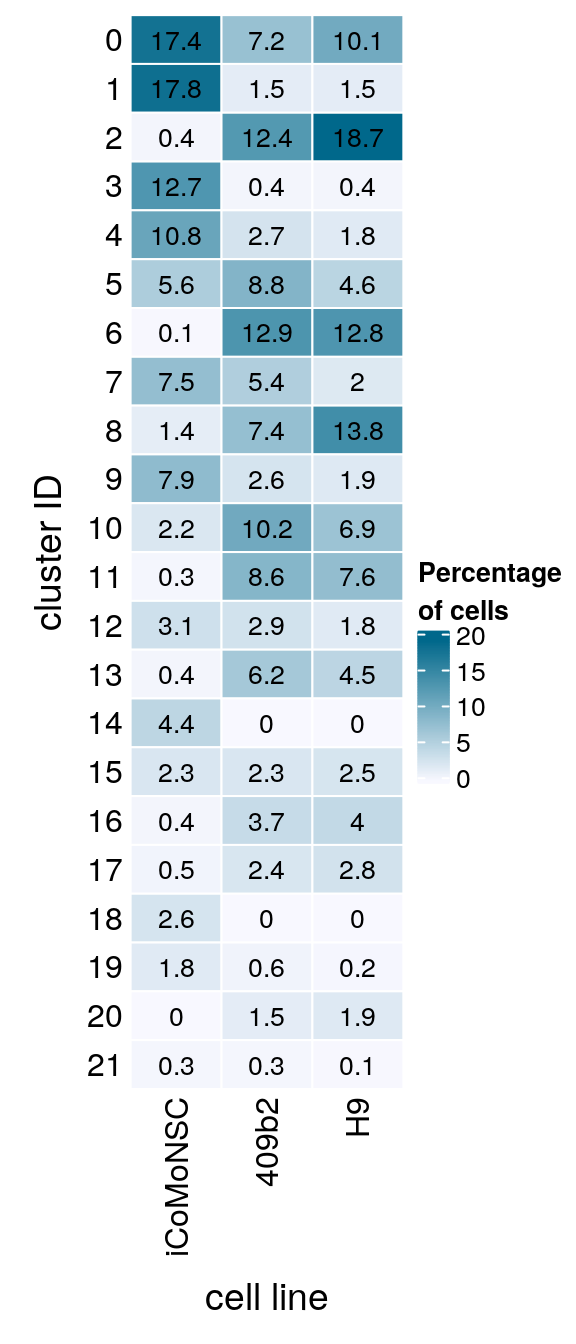
(n_cells <- table(sce$integration_group, sce$cluster_id))
              0    1    2    3    4    5    6    7    8    9   10   11   12
  iCoMoNSC 9355 9548  241 6838 5809 2992   73 4028  732 4260 1170  139 1644
  409b2    1455  303 2504   84  544 1787 2623 1097 1495  533 2061 1747  581
  H9       2356  345 4353   88  412 1074 2972  454 3199  443 1611 1759  427

             13   14   15   16   17   18   19   20   21
  iCoMoNSC  209 2358 1245  227  292 1410  959   12  169
  409b2    1263    5  461  760  494    5  115  301   54
  H9       1045    2  582  933  640    2   53  448   28
fqs <- prop.table(n_cells, margin = 2)
mat <- round(as.matrix(unclass(fqs))*100, 1)
Heatmap(mat,
col = colfunc(10),
name = "Percentage\nof cells",
cluster_rows = FALSE,
cluster_columns = FALSE,
row_names_side = "left",
row_title = "cell line",
column_title = "cluster ID",
column_title_side = "bottom",
rect_gp = gpar(col = "white"),
cell_fun = function(i, j, x, y, width, height, fill)
grid.text(mat[j, i], x = x, y = y,
gp = gpar(col = "black", fontsize = 10)))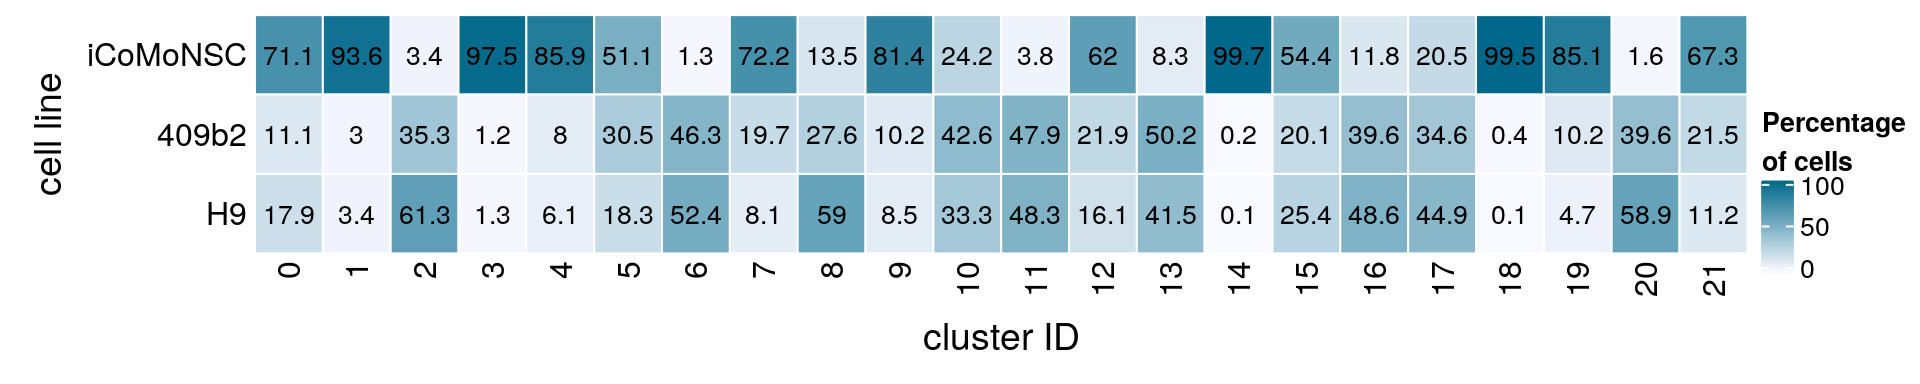
(n_cells_group <- table(sce$cluster_id, sce$Stage))
      P22  D52  D96 D223 iPSCs   EB Neuroectoderm Neuroepithelium Organoid-1M
  0     0 9222   96   37     0    0             0               0         201
  1  9548    0    0    0   271  123            38              44         148
  2   241    0    0    0  3376 3103           197              69         107
  3  6838    0    0    0    10   25            13              19          91
  4     0   17 2607 3185     0    0             0               0           1
  5     0 2981   10    1     0    0             0               0         175
  6    73    0    0    0    50    8          2101             885        2274
  7    23   39 1949 2017     0    0             1               1         697
  8     0  473  197   62     0    0             0               2          98
  9     0    1   12 4247     0    0             0               0           6
  10    0  855  271   44     0    0             0               0           6
  11    4  118    4   13     0    0             1               0         144
  12    0    5 1611   28     0    0             0               0           9
  13    0    6   42  161     0    0             0               0          13
  14    0    4   13 2341     0    0             0               0           0
  15    0  501  685   59     0    0             0               0         672
  16    0  204   17    6     0    0             0               0          80
  17    0  186   71   35     1    2           346             292         317
  18    0 1384   17    9     0    0             0               0           4
  19    0   37  479  443     0    0             0               1          12
  20   12    0    0    0   592   39            60              50           6
  21    0   92   52   25     0    0             0               0           9

     Organoid-2M Organoid-4M
  0         2696         914
  1           24           0
  2            5           0
  3           10           4
  4          467         488
  5         2336         350
  6          274           3
  7          828          24
  8         1429        3165
  9          302         668
  10        2460        1206
  11        2472         889
  12         691         308
  13        1624         671
  14           2           5
  15         244         127
  16        1086         527
  17         135          41
  18           3           0
  19          95          60
  20           1           1
  21          36          37
fqs <- prop.table(n_cells_group, margin = 2)
mat <- round(as.matrix(unclass(fqs))*100, 2)
Heatmap(mat,
col = colfunc(10),
name = "Percentage\nof cells",
cluster_rows = FALSE,
cluster_columns = FALSE,
row_names_side = "left",
row_title = "cluster ID",
column_title = "time point",
column_title_side = "bottom",
rect_gp = gpar(col = "white"),
cell_fun = function(i, j, x, y, width, height, fill)
grid.text(mat[j, i] , x = x, y = y,
gp = gpar(col = "black", fontsize = 10)))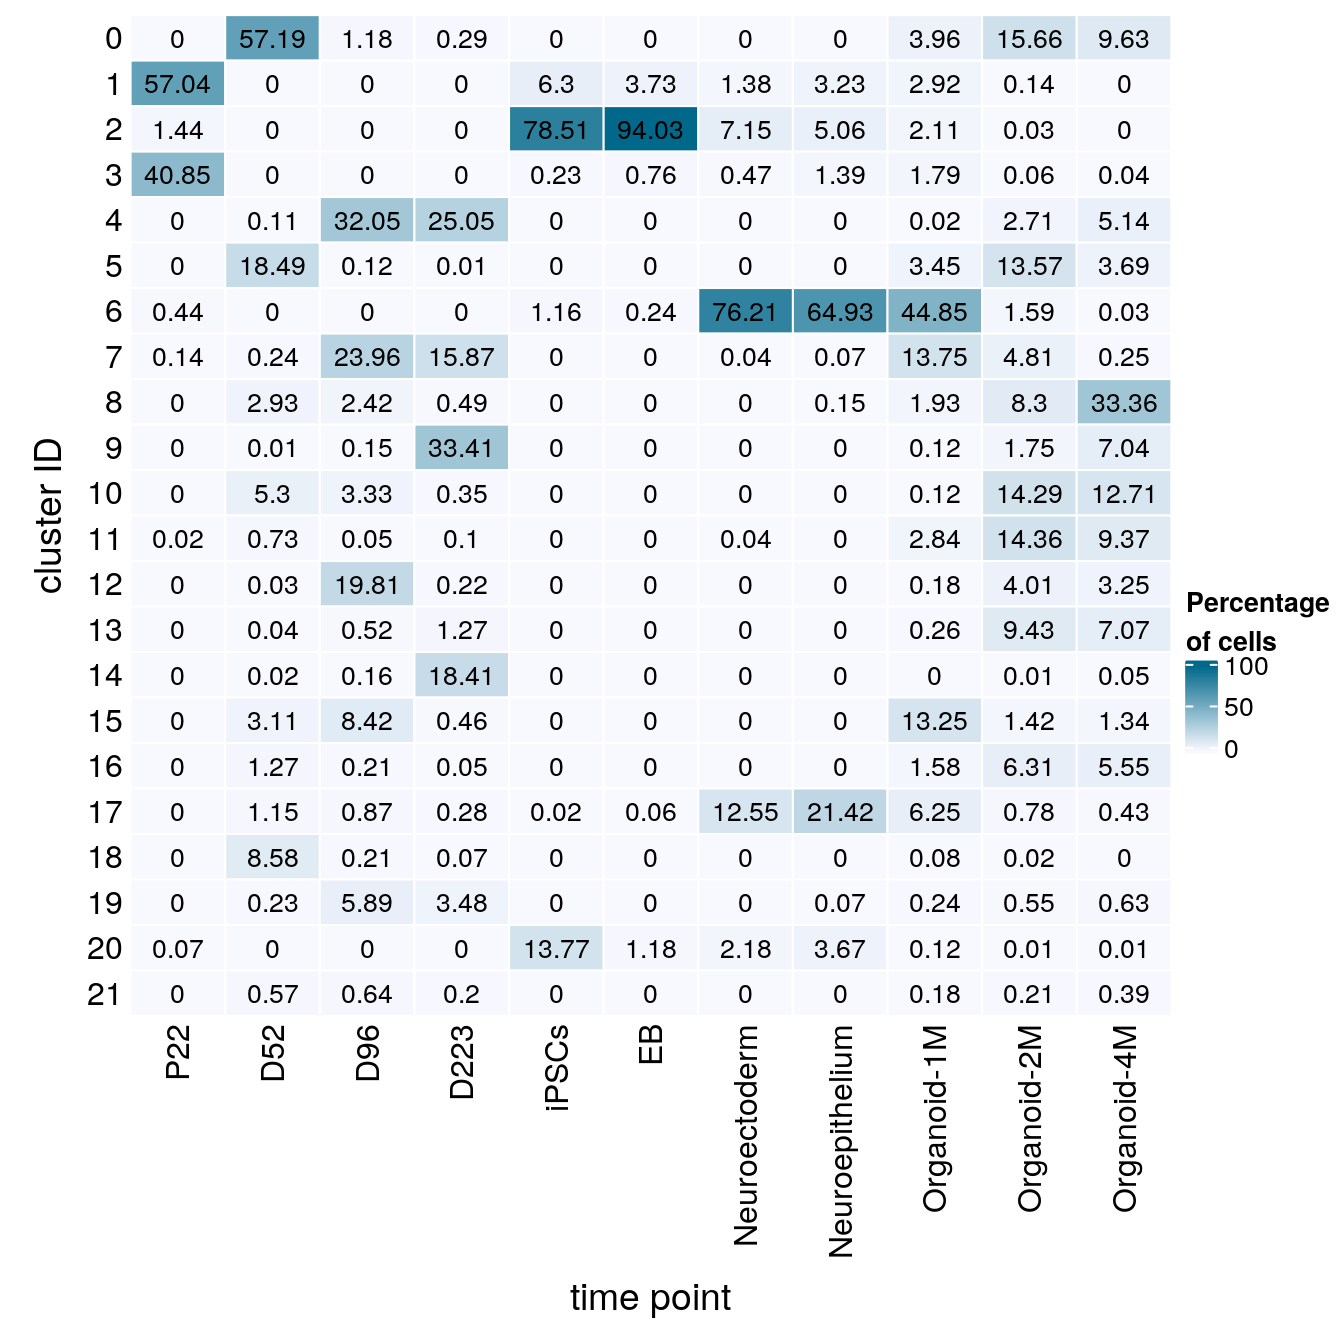
Heatmap with the lineage labels from the Kanton et al. paper. Cells without the label (all iCoMoNSCs) are excluded from the heatmap!
(n_cells_lineage <- table(sce$cluster_id, sce$cl_FullLineage))
choroid plexus/mesenchymal-like cells cortical neurons
0 0 26
1 91 0
2 0 0
3 1 0
4 0 928
5 0 7
6 2 1
7 0 34
8 0 366
9 1 7
10 0 2748
11 0 27
12 0 2
13 0 1189
14 0 0
15 191 0
16 0 187
17 4 1
18 0 0
19 0 1
20 0 0
21 81 0
cycling dorsal progenitors cycling ventral progenitors
0 0 0
1 0 0
2 0 0
3 52 0
4 0 0
5 2 1
6 259 1
7 0 0
8 0 0
9 0 12
10 2 0
11 1377 989
12 0 0
13 0 0
14 0 0
15 2 0
16 7 19
17 0 0
18 0 0
19 0 0
20 0 0
21 0 0
ectodermal/neuroectodermal-like cells gliogenic/outer RGCs and astrocytes
0 0 0
1 18 1
2 19 0
3 5 0
4 0 0
5 1 349
6 496 0
7 0 0
8 0 1
9 1 922
10 0 0
11 4 75
12 0 429
13 0 0
14 0 1
15 0 0
16 0 131
17 294 22
18 0 0
19 1 5
20 30 0
21 1 0
IPs and early cortical neurons midbrain/hindbrain cells
0 2 1027
1 0 1
2 0 0
3 0 0
4 4 7
5 3 1
6 4 56
7 0 1443
8 59 190
9 0 1
10 859 42
11 11 12
12 0 0
13 0 462
14 0 0
15 0 5
16 768 33
17 0 8
18 0 7
19 0 1
20 0 0
21 0 0
neuroepithelial-like cells retina progenitors RGCs RGCs early stem cells
0 3 0 0 0 1
1 96 58 1 17 365
2 253 53 0 64 6468
3 41 40 1 8 23
4 0 0 1 0 0
5 0 1 1877 619 0
6 2466 915 20 1327 44
7 2 1 0 8 0
8 3 0 5 37 1
9 0 0 17 15 0
10 2 0 4 0 0
11 1 1 909 70 0
12 0 0 559 17 0
13 0 0 0 0 0
14 0 0 0 6 0
15 0 73 0 772 0
16 0 0 72 9 0
17 318 3 95 357 28
18 0 0 0 0 0
19 0 0 1 157 1
20 45 0 0 2 672
21 0 0 0 0 0
ventral progenitors and neurons
0 2752
1 0
2 0
3 1
4 16
5 0
6 4
7 63
8 4032
9 0
10 15
11 30
12 1
13 657
14 0
15 0
16 467
17 4
18 0
19 1
20 0
21 0fqs <- prop.table(n_cells_lineage, margin = 2)
mat <- round(as.matrix(unclass(fqs))*100, 2)
cn <- colnames(mat)
Heatmap(mat,
col = colfunc(10),
name = "Percentage\nof cells",
cluster_rows = FALSE,
cluster_columns = FALSE,
show_column_names = FALSE,
row_names_side = "left",
row_title = "cluster ID",
column_title = "Lineage",
column_title_side = "bottom",
rect_gp = gpar(col = "white"),
cell_fun = function(i, j, x, y, width, height, fill)
grid.text(mat[j, i], x = x, y = y,
gp = gpar(col = "black", fontsize = 10)),
bottom_annotation = HeatmapAnnotation(
text = anno_text(cn, rot = 80, just = "right")))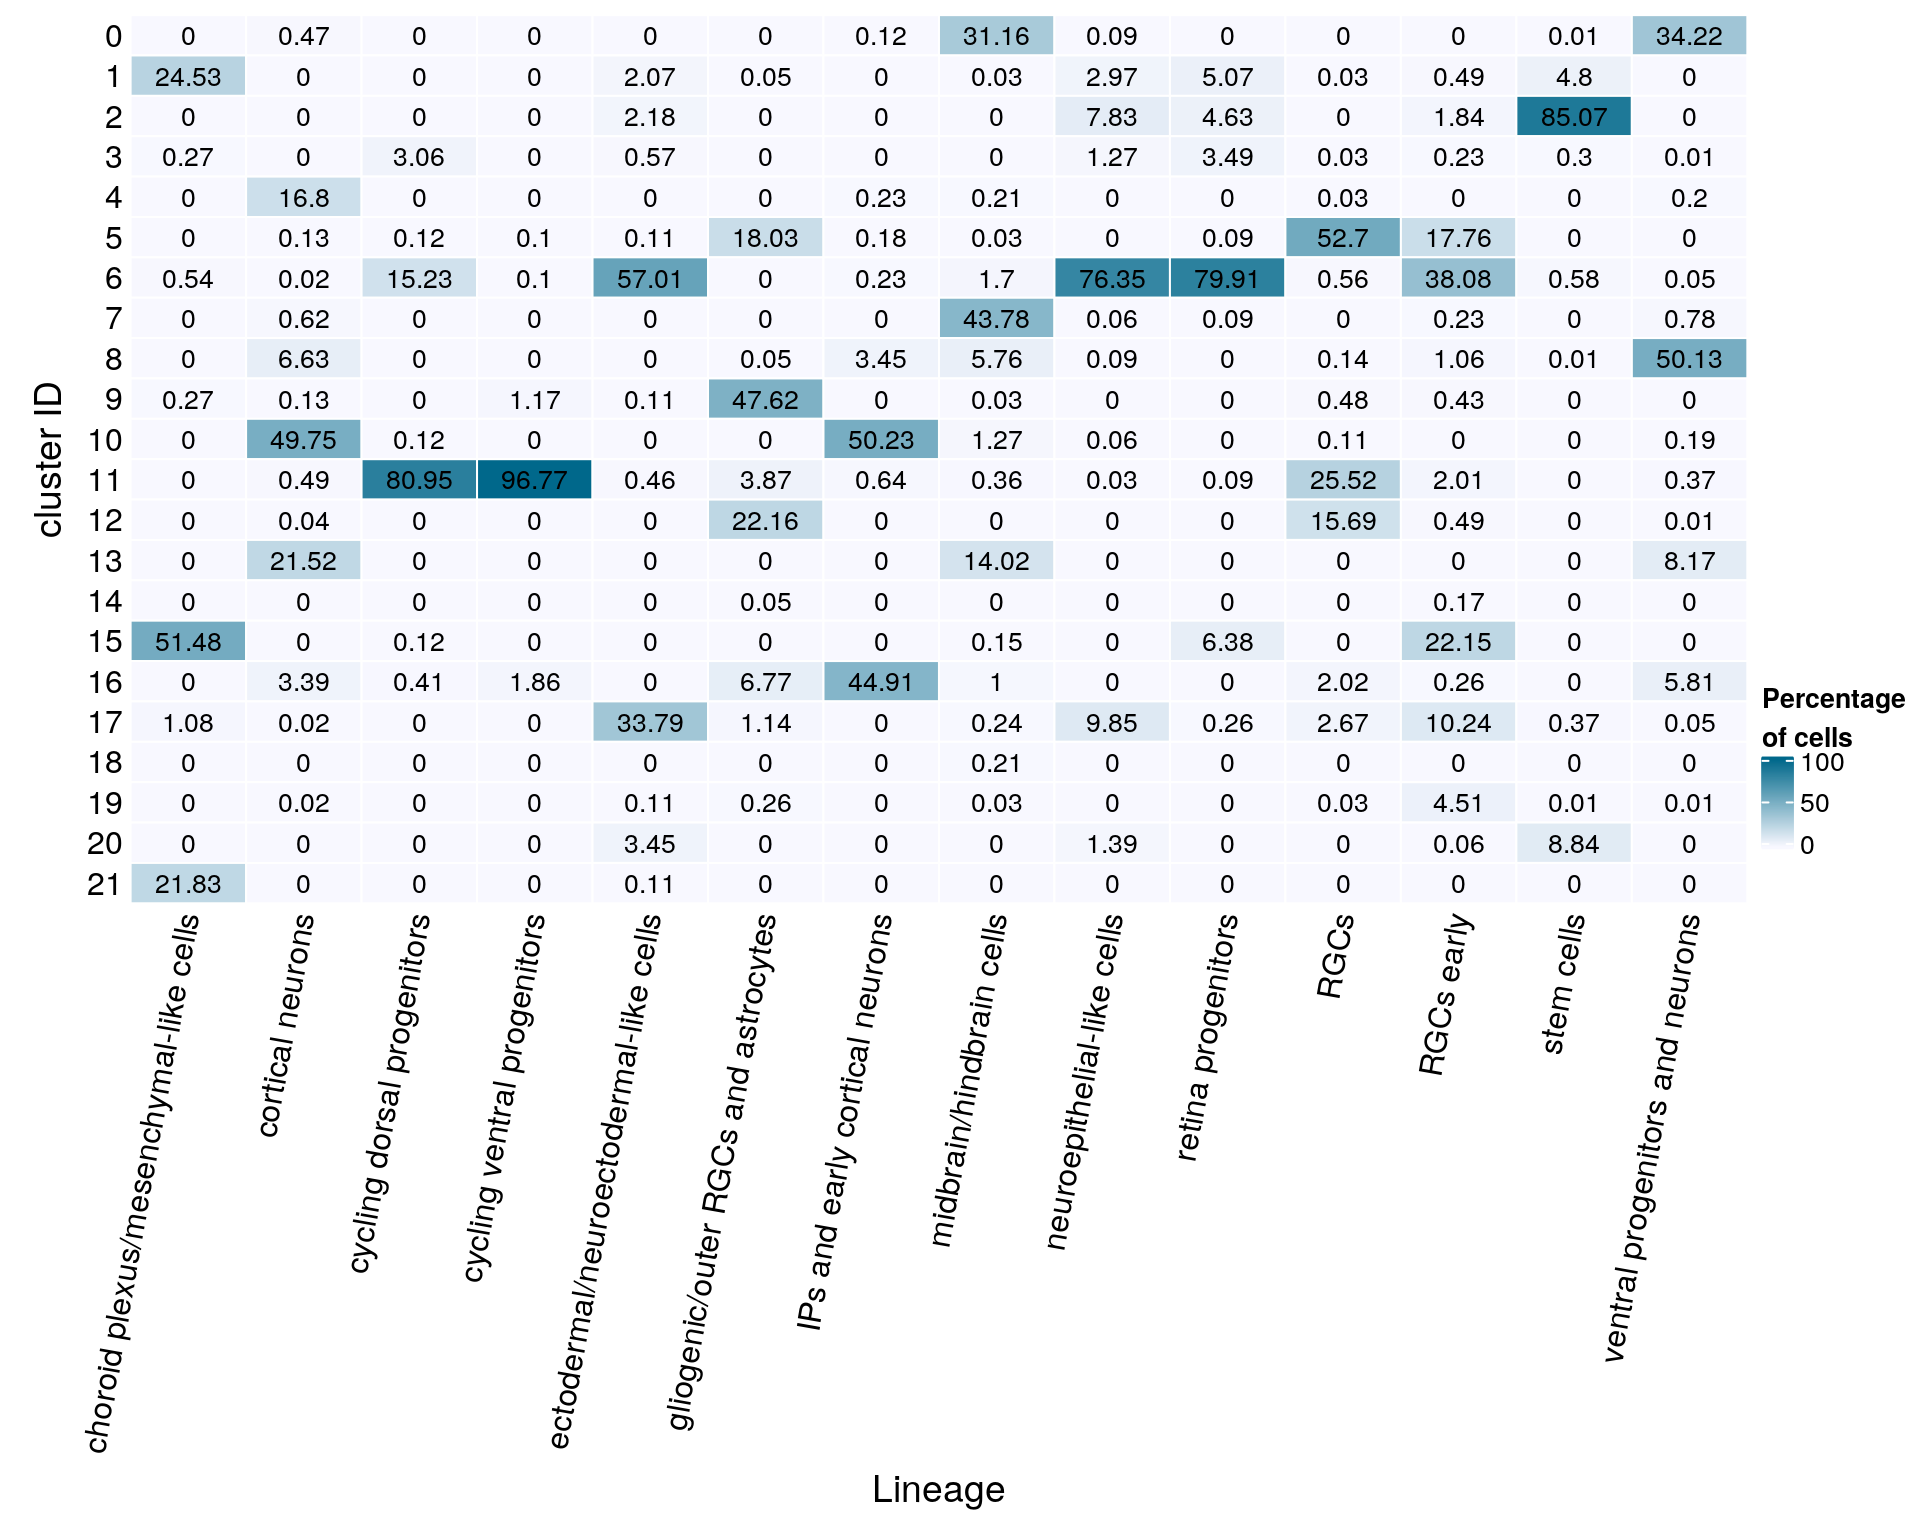
(n_cells_lineage <- table(sce$cl_FullLineage, sce$cluster_id))
                                           0    1    2    3    4    5    6    7
  choroid plexus/mesenchymal-like cells    0   91    0    1    0    0    2    0
  cortical neurons                        26    0    0    0  928    7    1   34
  cycling dorsal progenitors               0    0    0   52    0    2  259    0
  cycling ventral progenitors              0    0    0    0    0    1    1    0
  ectodermal/neuroectodermal-like cells    0   18   19    5    0    1  496    0
  gliogenic/outer RGCs and astrocytes      0    1    0    0    0  349    0    0
  IPs and early cortical neurons           2    0    0    0    4    3    4    0
  midbrain/hindbrain cells              1027    1    0    0    7    1   56 1443
  neuroepithelial-like cells               3   96  253   41    0    0 2466    2
  retina progenitors                       0   58   53   40    0    1  915    1
  RGCs                                     0    1    0    1    1 1877   20    0
  RGCs early                               0   17   64    8    0  619 1327    8
  stem cells                               1  365 6468   23    0    0   44    0
  ventral progenitors and neurons       2752    0    0    1   16    0    4   63

                                           8    9   10   11   12   13   14   15
  choroid plexus/mesenchymal-like cells    0    1    0    0    0    0    0  191
  cortical neurons                       366    7 2748   27    2 1189    0    0
  cycling dorsal progenitors               0    0    2 1377    0    0    0    2
  cycling ventral progenitors              0   12    0  989    0    0    0    0
  ectodermal/neuroectodermal-like cells    0    1    0    4    0    0    0    0
  gliogenic/outer RGCs and astrocytes      1  922    0   75  429    0    1    0
  IPs and early cortical neurons          59    0  859   11    0    0    0    0
  midbrain/hindbrain cells               190    1   42   12    0  462    0    5
  neuroepithelial-like cells               3    0    2    1    0    0    0    0
  retina progenitors                       0    0    0    1    0    0    0   73
  RGCs                                     5   17    4  909  559    0    0    0
  RGCs early                              37   15    0   70   17    0    6  772
  stem cells                               1    0    0    0    0    0    0    0
  ventral progenitors and neurons       4032    0   15   30    1  657    0    0

                                          16   17   18   19   20   21
  choroid plexus/mesenchymal-like cells    0    4    0    0    0   81
  cortical neurons                       187    1    0    1    0    0
  cycling dorsal progenitors               7    0    0    0    0    0
  cycling ventral progenitors             19    0    0    0    0    0
  ectodermal/neuroectodermal-like cells    0  294    0    1   30    1
  gliogenic/outer RGCs and astrocytes    131   22    0    5    0    0
  IPs and early cortical neurons         768    0    0    0    0    0
  midbrain/hindbrain cells                33    8    7    1    0    0
  neuroepithelial-like cells               0  318    0    0   45    0
  retina progenitors                       0    3    0    0    0    0
  RGCs                                    72   95    0    1    0    0
  RGCs early                               9  357    0  157    2    0
  stem cells                               0   28    0    1  672    0
  ventral progenitors and neurons        467    4    0    1    0    0
fqs <- prop.table(n_cells_lineage, margin = 2)
mat <- round(as.matrix(unclass(fqs))*100, 2)
Heatmap(mat,
col = colfunc(10),
name = "Percentage\nof cells",
cluster_rows = FALSE,
cluster_columns = FALSE,
row_names_side = "left",
row_title = "Lineage",
row_names_rot = 10,
column_title = "cluster ID",
column_title_side = "bottom",
rect_gp = gpar(col = "white"),
cell_fun = function(i, j, x, y, width, height, fill)
grid.text(mat[j, i], x = x, y = y,
gp = gpar(col = "black", fontsize = 10)))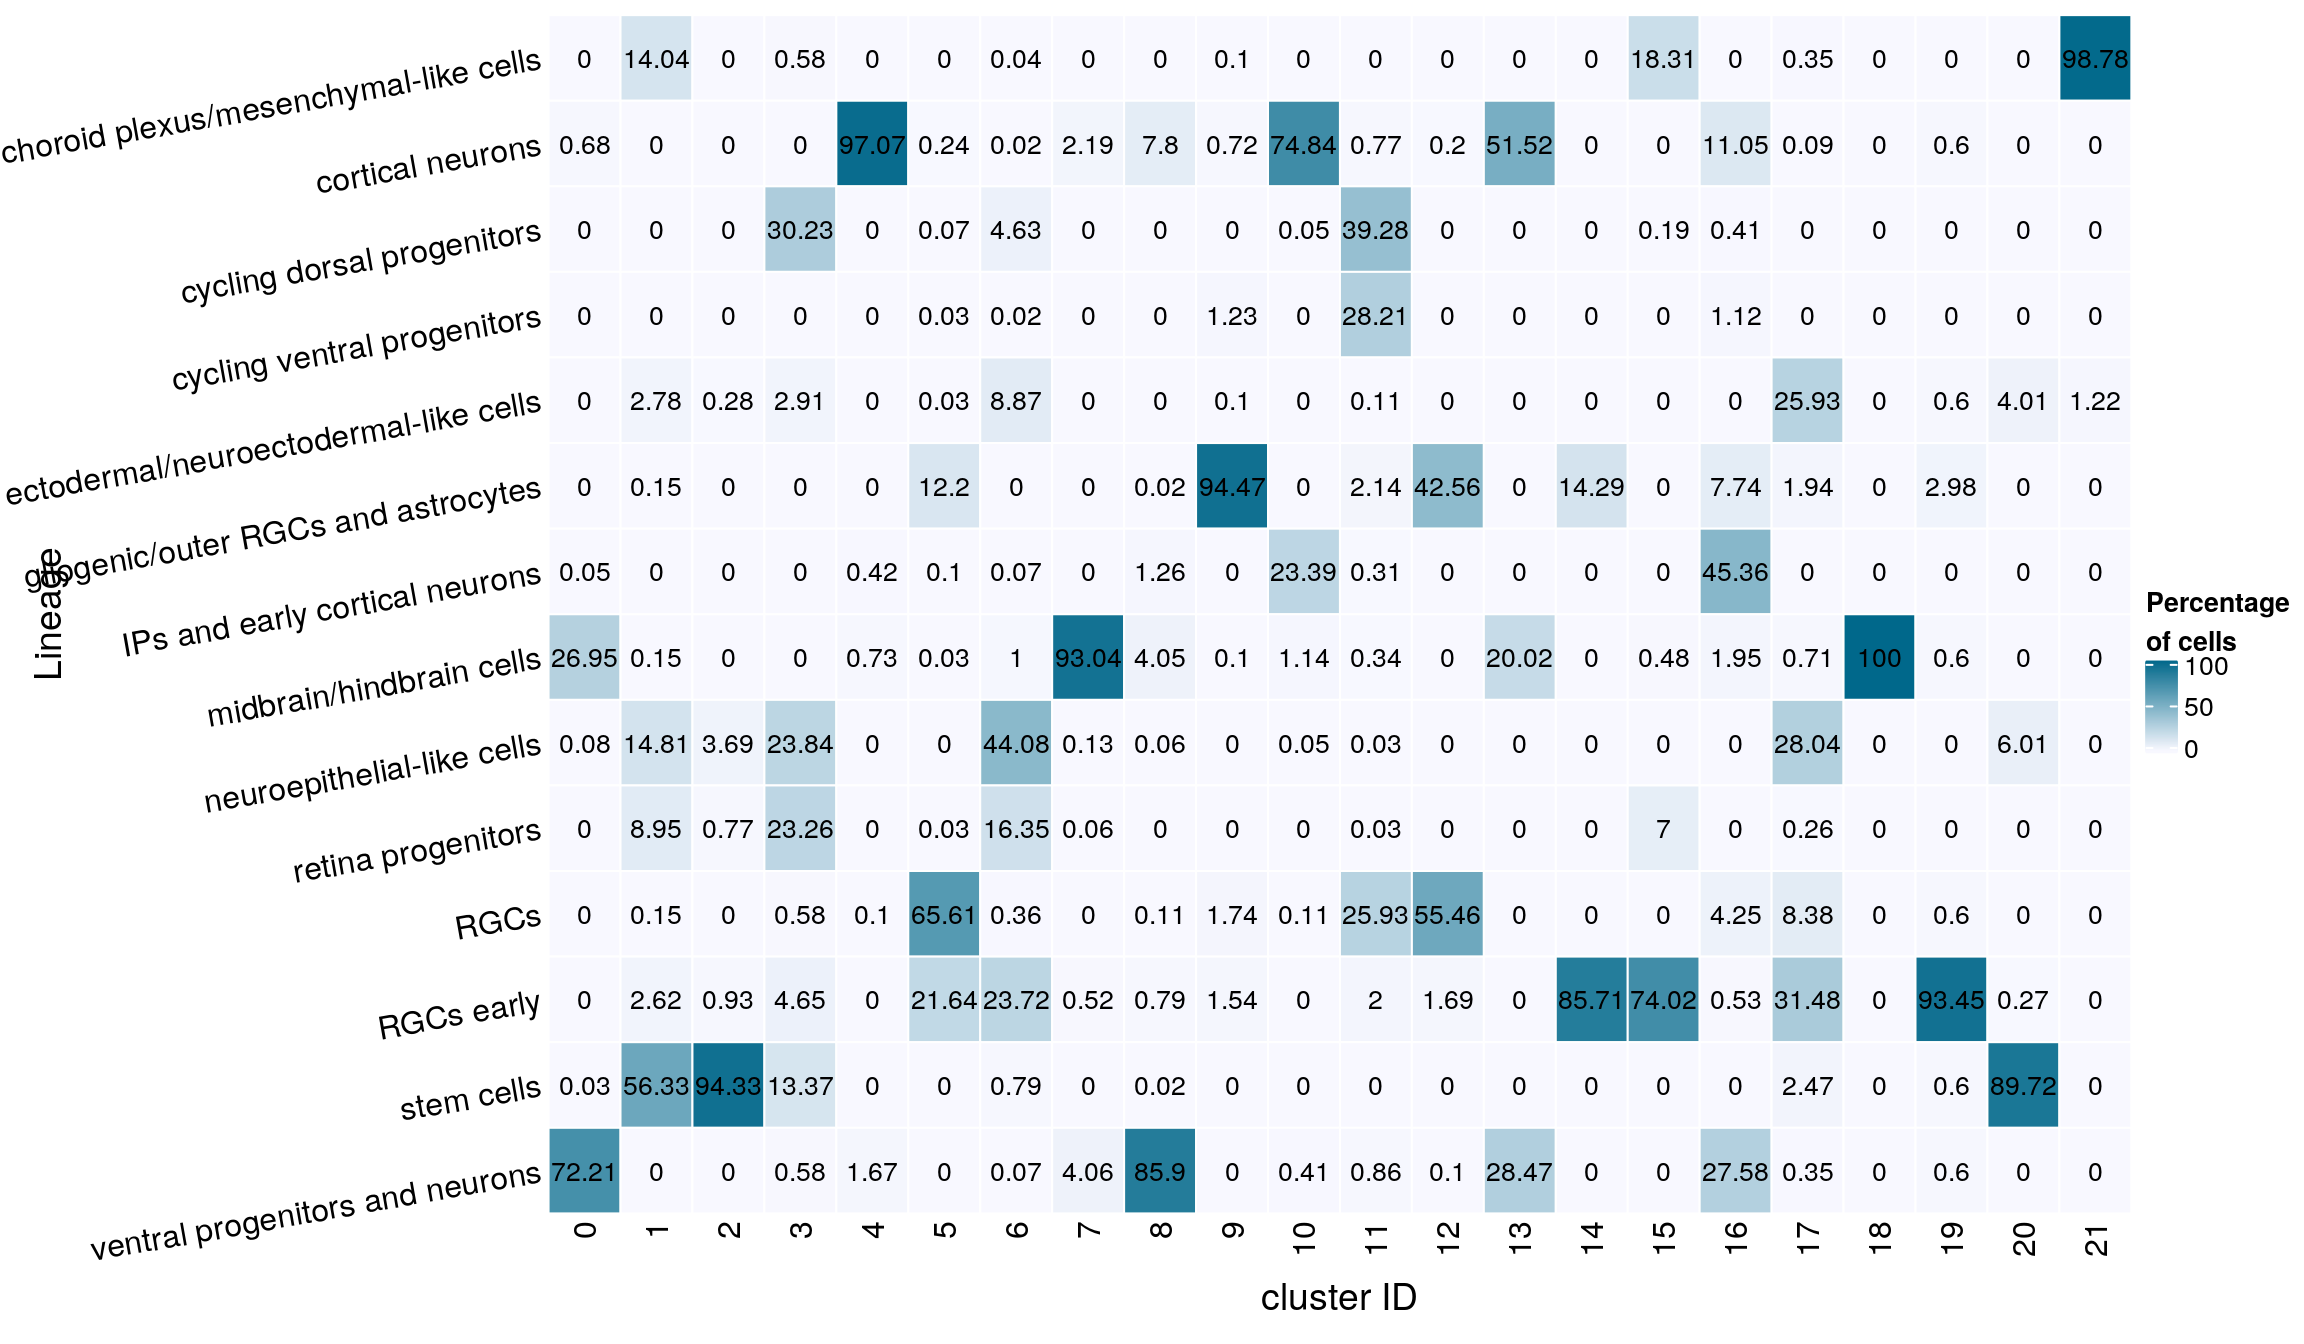
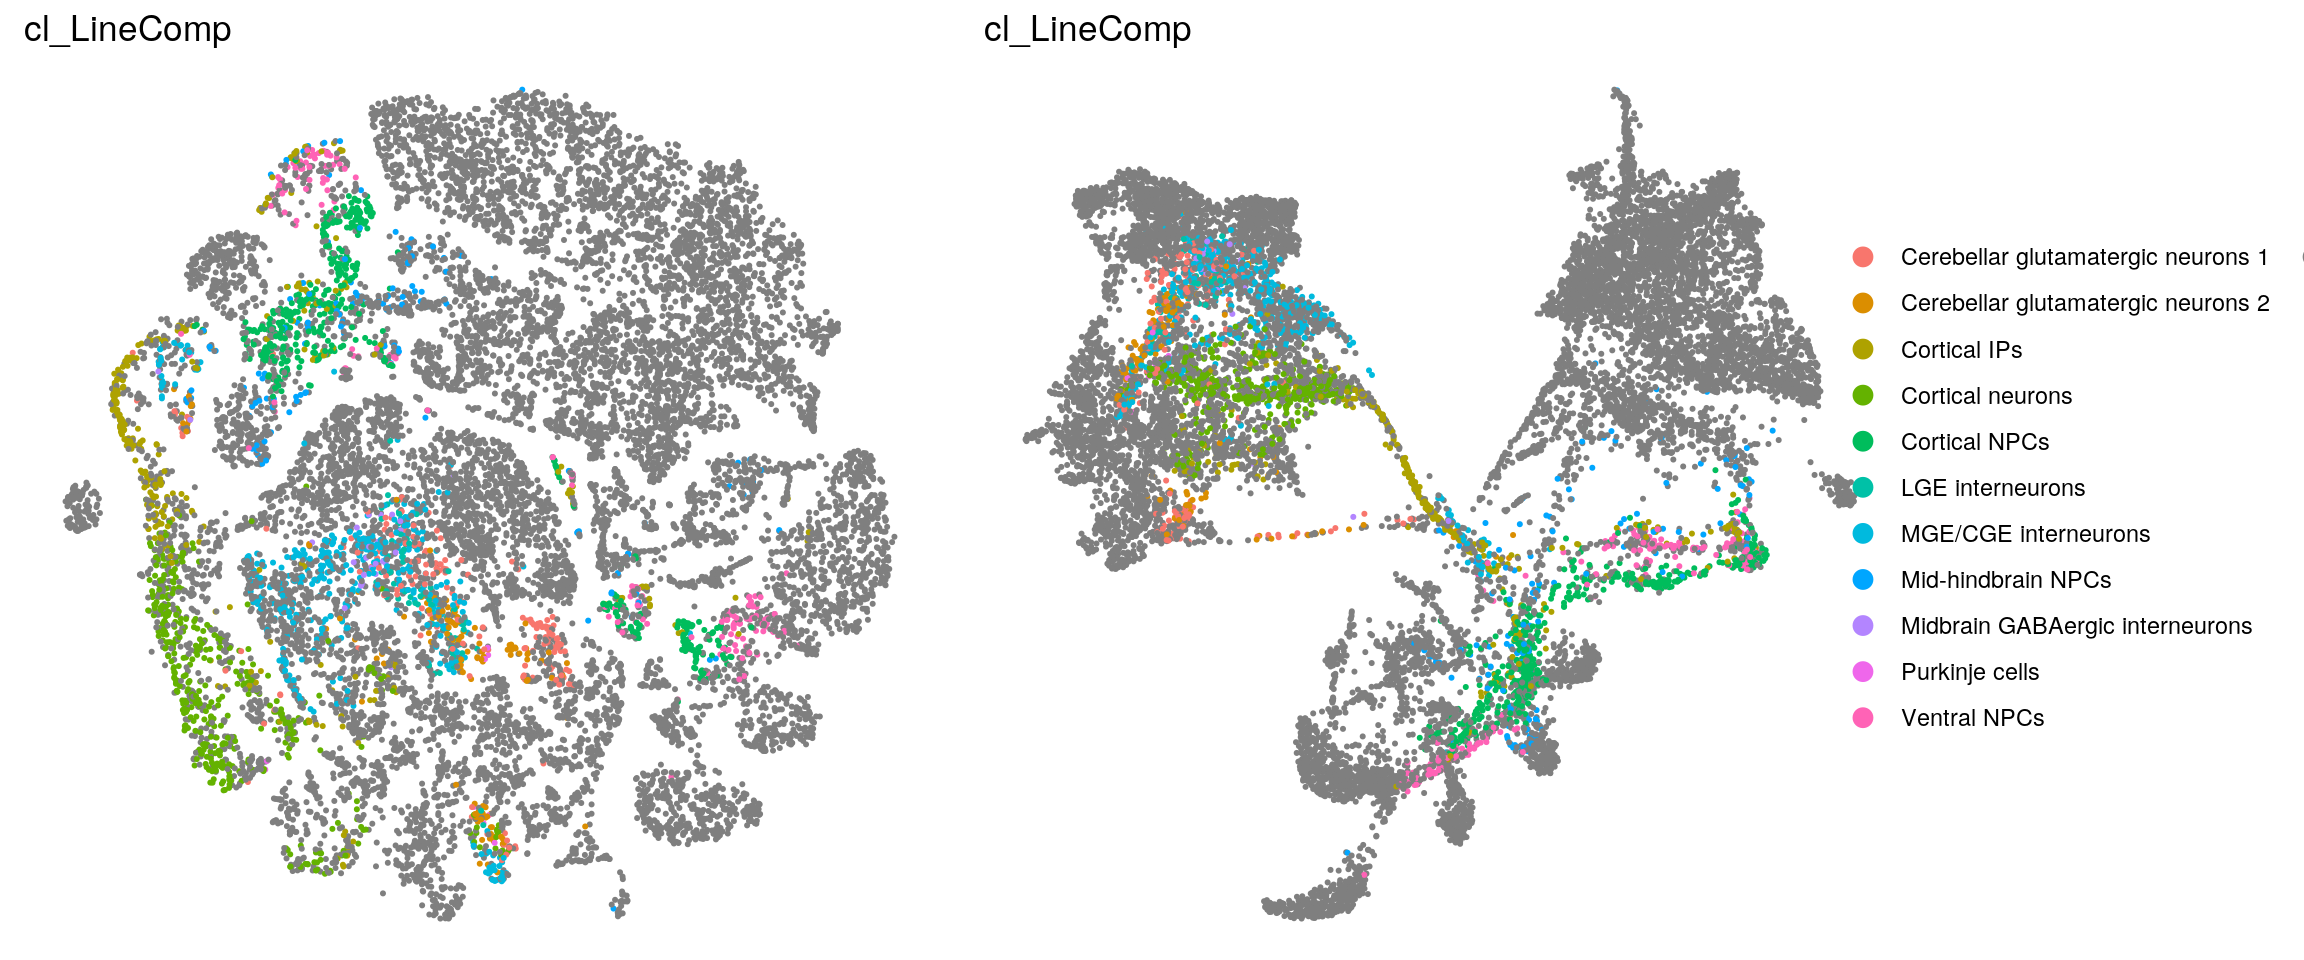
Heatmap with the line labels from the Kanton et. al paper. Cell without the label, are excluded from the heatmap!
(n_cells_linecomp <- table(sce$cluster_id, sce$cl_LineComp))
     Cerebellar glutamatergic neurons 1 Cerebellar glutamatergic neurons 2
  0                                 501                                341
  1                                   1                                  0
  2                                   0                                  0
  3                                   0                                  0
  4                                   4                                  3
  5                                   1                                  1
  6                                   0                                 10
  7                                 558                                196
  8                                  54                                 63
  9                                   0                                  0
  10                                 32                                  4
  11                                  2                                  6
  12                                  0                                  0
  13                                126                                294
  14                                  0                                  0
  15                                  1                                  0
  16                                  6                                  1
  17                                  0                                  0
  18                                  2                                  1
  19                                  0                                  0
  20                                  0                                  0
  21                                  0                                  0

     Cortical IPs Cortical neurons Cortical NPCs LGE interneurons
  0             2                5             0              466
  1             0                0             0                0
  2             0                0             0                0
  3             0                0             0                0
  4            85              349             0                0
  5           198                0          1433                0
  6             1                0            10                0
  7             3                3             0                1
  8           116               69             0                9
  9             7                0             4                0
  10          557             1835             0                4
  11          319                0          1231                2
  12           71                0           460                0
  13            1              682             0               55
  14            0                0             0                0
  15            1                0             1                0
  16          752                0            17                0
  17            4                0            56                0
  18            0                0             0                0
  19            0                0             0                0
  20            0                0             0                0
  21            0                0             0                0

     MGE/CGE interneurons Mid-hindbrain NPCs Midbrain GABAergic interneurons
  0                  1157                  1                             127
  1                     0                  5                               0
  2                     0                  4                               0
  3                     0                  9                               0
  4                     3                  0                               0
  5                     5                354                               1
  6                     0                246                               0
  7                     3                 34                               6
  8                   901                  2                              48
  9                     2                  3                               0
  10                    6                  1                               0
  11                   11                192                               0
  12                    2                  5                               0
  13                  275                  0                               0
  14                    0                  1                               0
  15                    0                 62                               0
  16                  235                 12                               1
  17                    0                 48                               0
  18                    0                  0                               0
  19                    1                  5                               0
  20                    0                  0                               0
  21                    0                  4                               0

     Purkinje cells Ventral NPCs
  0               1            0
  1               0            0
  2               0            0
  3               0            0
  4               1            0
  5               0           96
  6               0            1
  7               3            0
  8               0            1
  9               0          229
  10              2            1
  11              0          602
  12              0           93
  13             38            0
  14              0            1
  15              0            0
  16              0           40
  17              0            6
  18              0            0
  19              0            1
  20              0            0
  21              0            0
fqs <- prop.table(n_cells_linecomp, margin = 2)
mat <- round(as.matrix(unclass(fqs))*100, 2)
cn <- colnames(mat)
Heatmap(mat,
col = colfunc(10),
name = "Percentage\nof cells",
cluster_rows = FALSE,
cluster_columns = FALSE,
show_column_names = FALSE,
row_names_side = "left",
row_title = "cluster ID",
column_title = "line ",
column_title_side = "bottom",
rect_gp = gpar(col = "white"),
cell_fun = function(i, j, x, y, width, height, fill)
grid.text(mat[j, i], x = x, y = y,
gp = gpar(col = "black", fontsize = 10)),
bottom_annotation = HeatmapAnnotation(
text = anno_text(cn, rot = 80, just = "right")))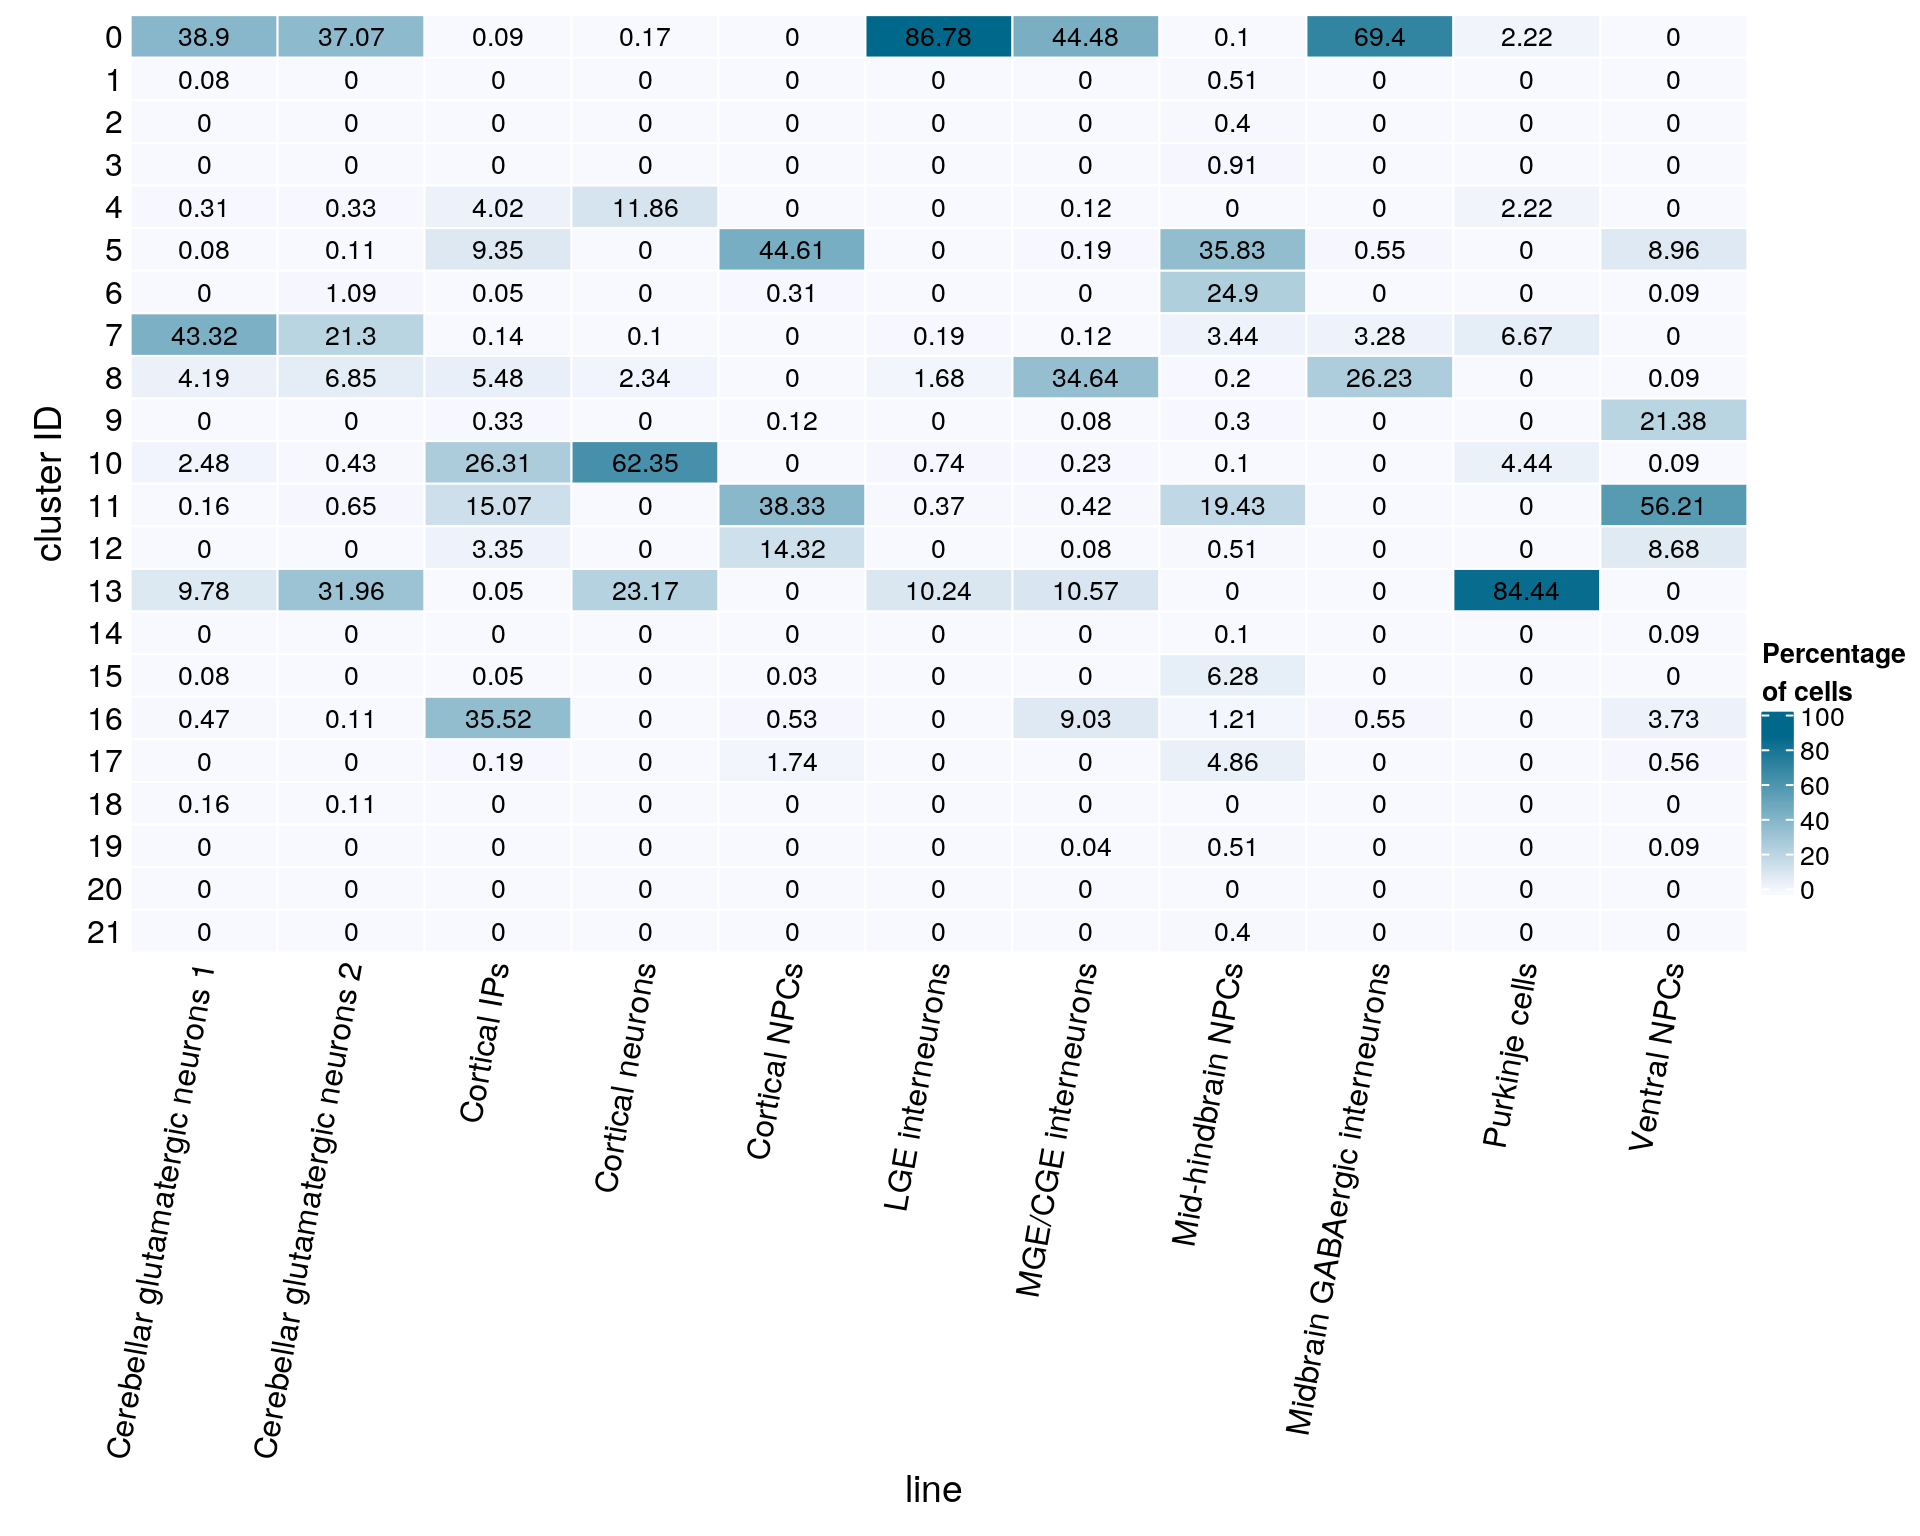
(n_cells_linecomp <- table(sce$cl_LineComp, sce$cluster_id))
                                        0    1    2    3    4    5    6    7
  Cerebellar glutamatergic neurons 1  501    1    0    0    4    1    0  558
  Cerebellar glutamatergic neurons 2  341    0    0    0    3    1   10  196
  Cortical IPs                          2    0    0    0   85  198    1    3
  Cortical neurons                      5    0    0    0  349    0    0    3
  Cortical NPCs                         0    0    0    0    0 1433   10    0
  LGE interneurons                    466    0    0    0    0    0    0    1
  MGE/CGE interneurons               1157    0    0    0    3    5    0    3
  Mid-hindbrain NPCs                    1    5    4    9    0  354  246   34
  Midbrain GABAergic interneurons     127    0    0    0    0    1    0    6
  Purkinje cells                        1    0    0    0    1    0    0    3
  Ventral NPCs                          0    0    0    0    0   96    1    0

                                        8    9   10   11   12   13   14   15
  Cerebellar glutamatergic neurons 1   54    0   32    2    0  126    0    1
  Cerebellar glutamatergic neurons 2   63    0    4    6    0  294    0    0
  Cortical IPs                        116    7  557  319   71    1    0    1
  Cortical neurons                     69    0 1835    0    0  682    0    0
  Cortical NPCs                         0    4    0 1231  460    0    0    1
  LGE interneurons                      9    0    4    2    0   55    0    0
  MGE/CGE interneurons                901    2    6   11    2  275    0    0
  Mid-hindbrain NPCs                    2    3    1  192    5    0    1   62
  Midbrain GABAergic interneurons      48    0    0    0    0    0    0    0
  Purkinje cells                        0    0    2    0    0   38    0    0
  Ventral NPCs                          1  229    1  602   93    0    1    0

                                       16   17   18   19   20   21
  Cerebellar glutamatergic neurons 1    6    0    2    0    0    0
  Cerebellar glutamatergic neurons 2    1    0    1    0    0    0
  Cortical IPs                        752    4    0    0    0    0
  Cortical neurons                      0    0    0    0    0    0
  Cortical NPCs                        17   56    0    0    0    0
  LGE interneurons                      0    0    0    0    0    0
  MGE/CGE interneurons                235    0    0    1    0    0
  Mid-hindbrain NPCs                   12   48    0    5    0    4
  Midbrain GABAergic interneurons       1    0    0    0    0    0
  Purkinje cells                        0    0    0    0    0    0
  Ventral NPCs                         40    6    0    1    0    0
fqs <- prop.table(n_cells_linecomp, margin = 2)
mat <- round(as.matrix(unclass(fqs))*100, 2)
Heatmap(mat,
col = colfunc(10),
name = "Percentage\nof cells",
cluster_rows = FALSE,
cluster_columns = FALSE,
row_names_side = "left",
row_title = "Lineage",
row_names_rot = 10,
column_title = "line",
column_title_side = "bottom",
rect_gp = gpar(col = "white"),
cell_fun = function(i, j, x, y, width, height, fill)
grid.text(mat[j, i], x = x, y = y,
gp = gpar(col = "black", fontsize = 10)))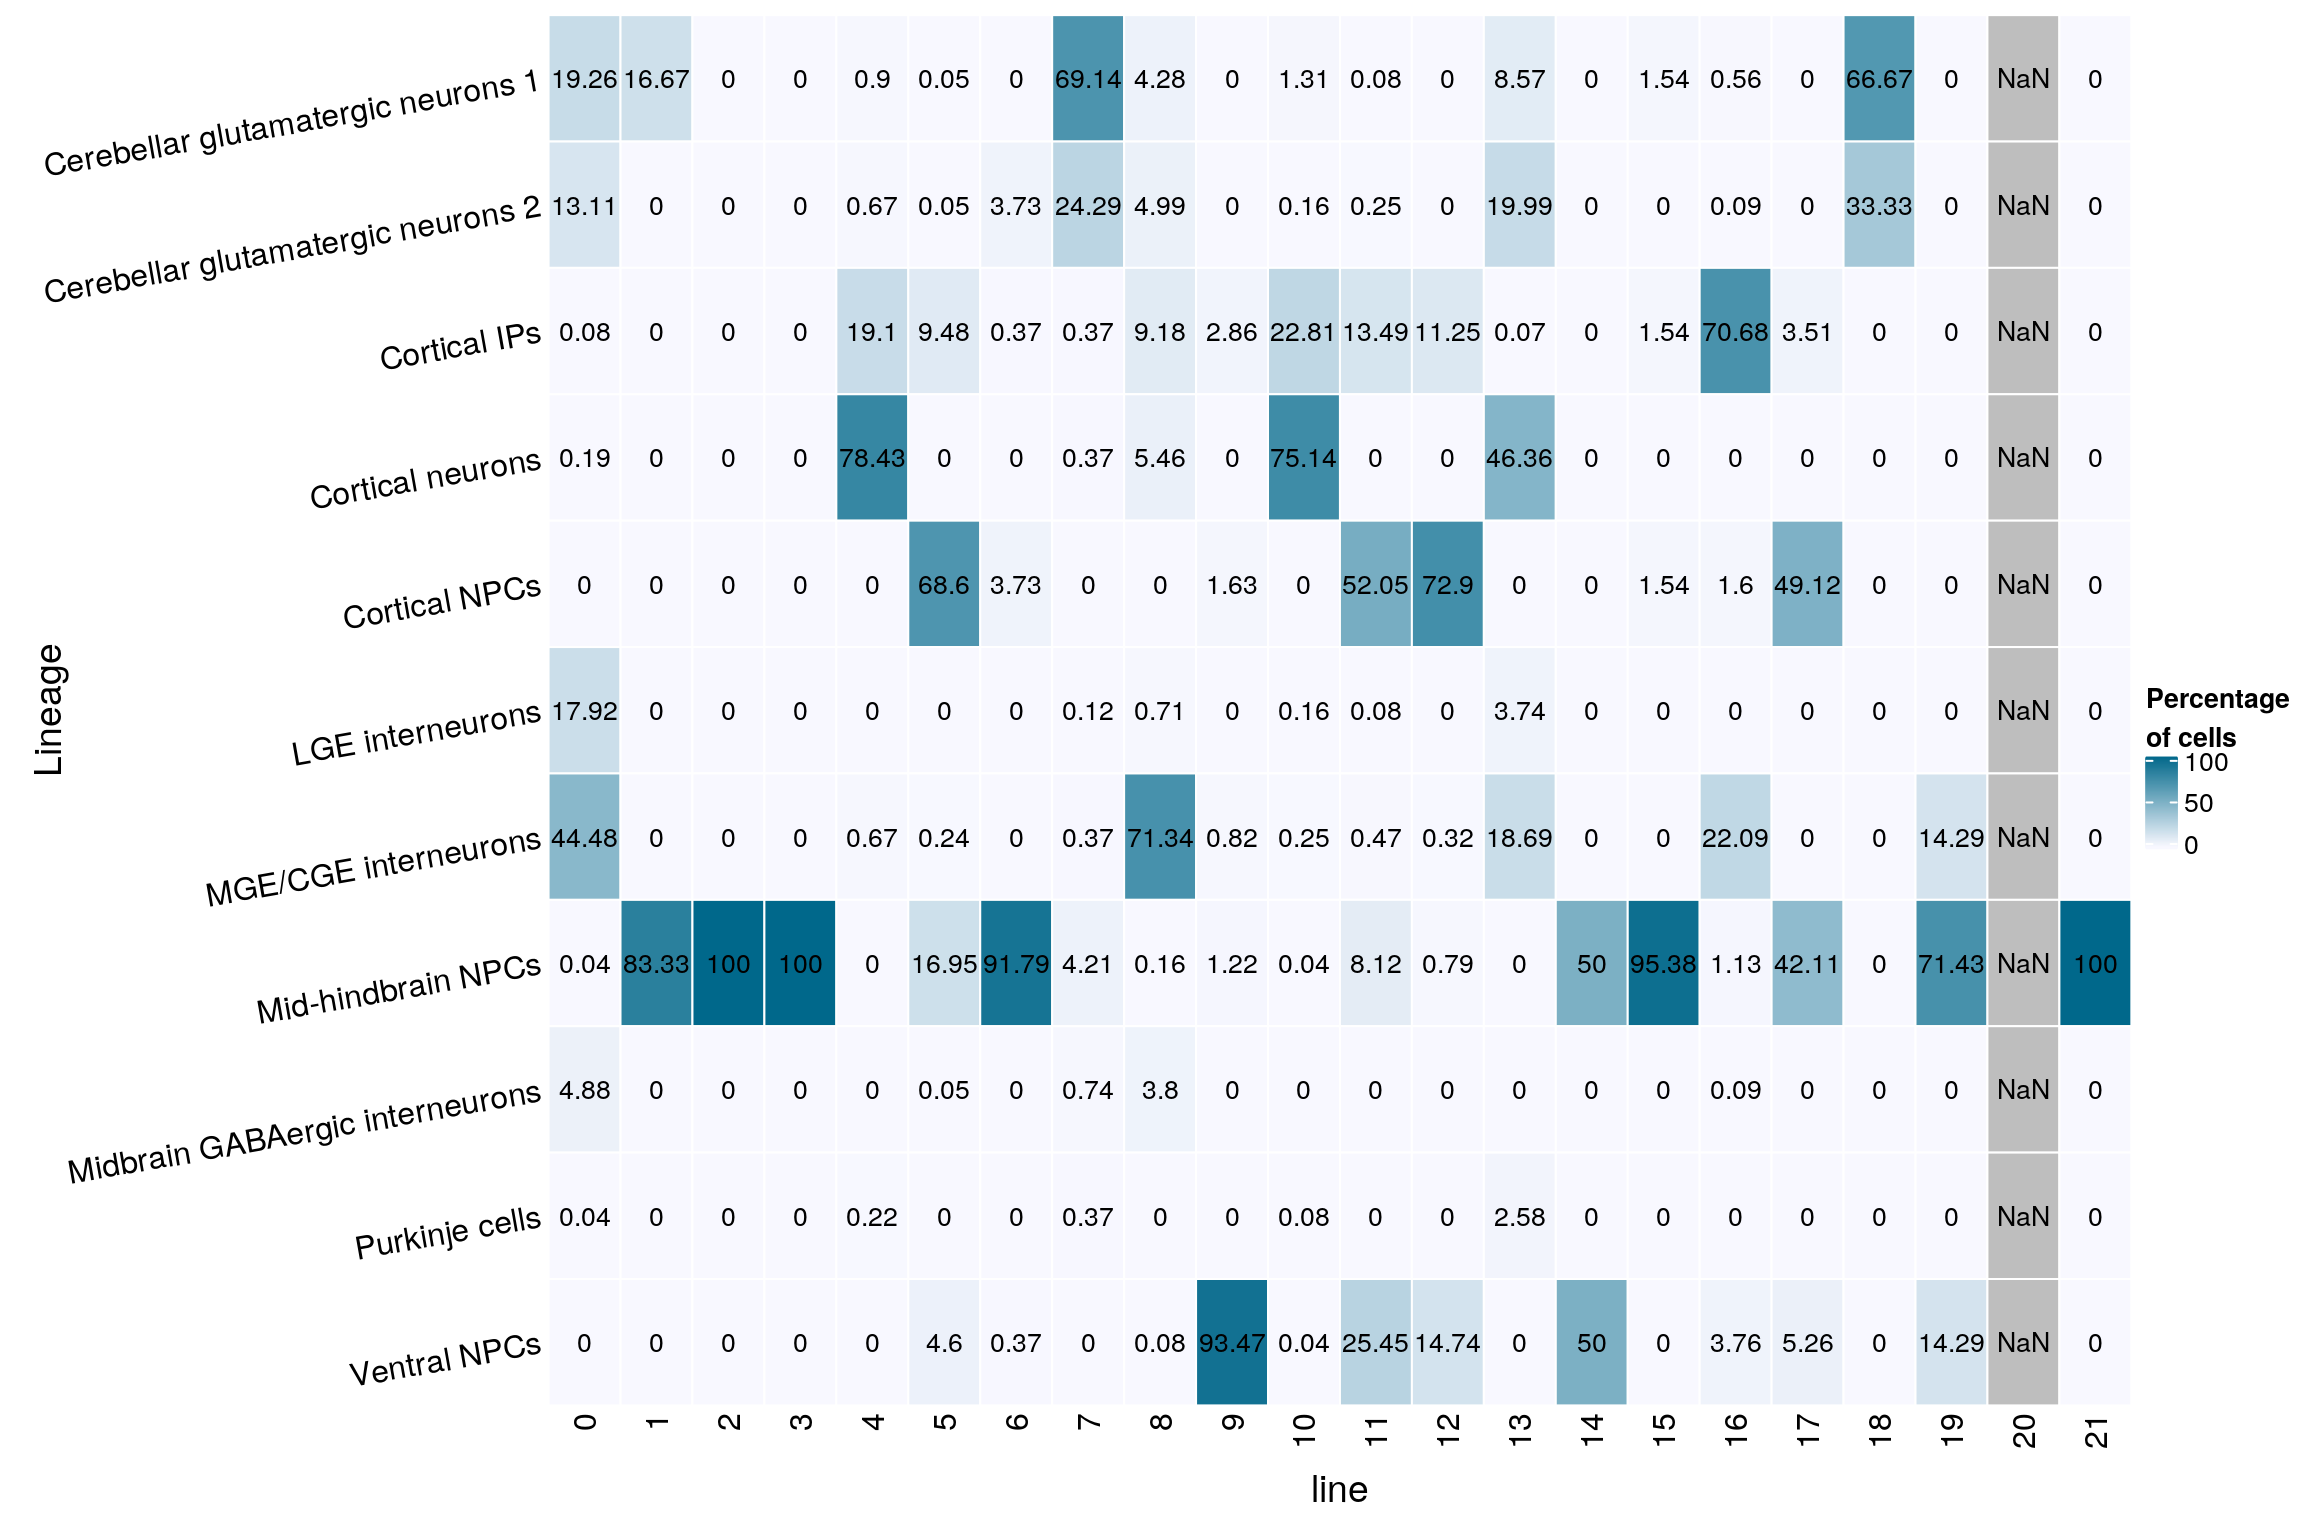
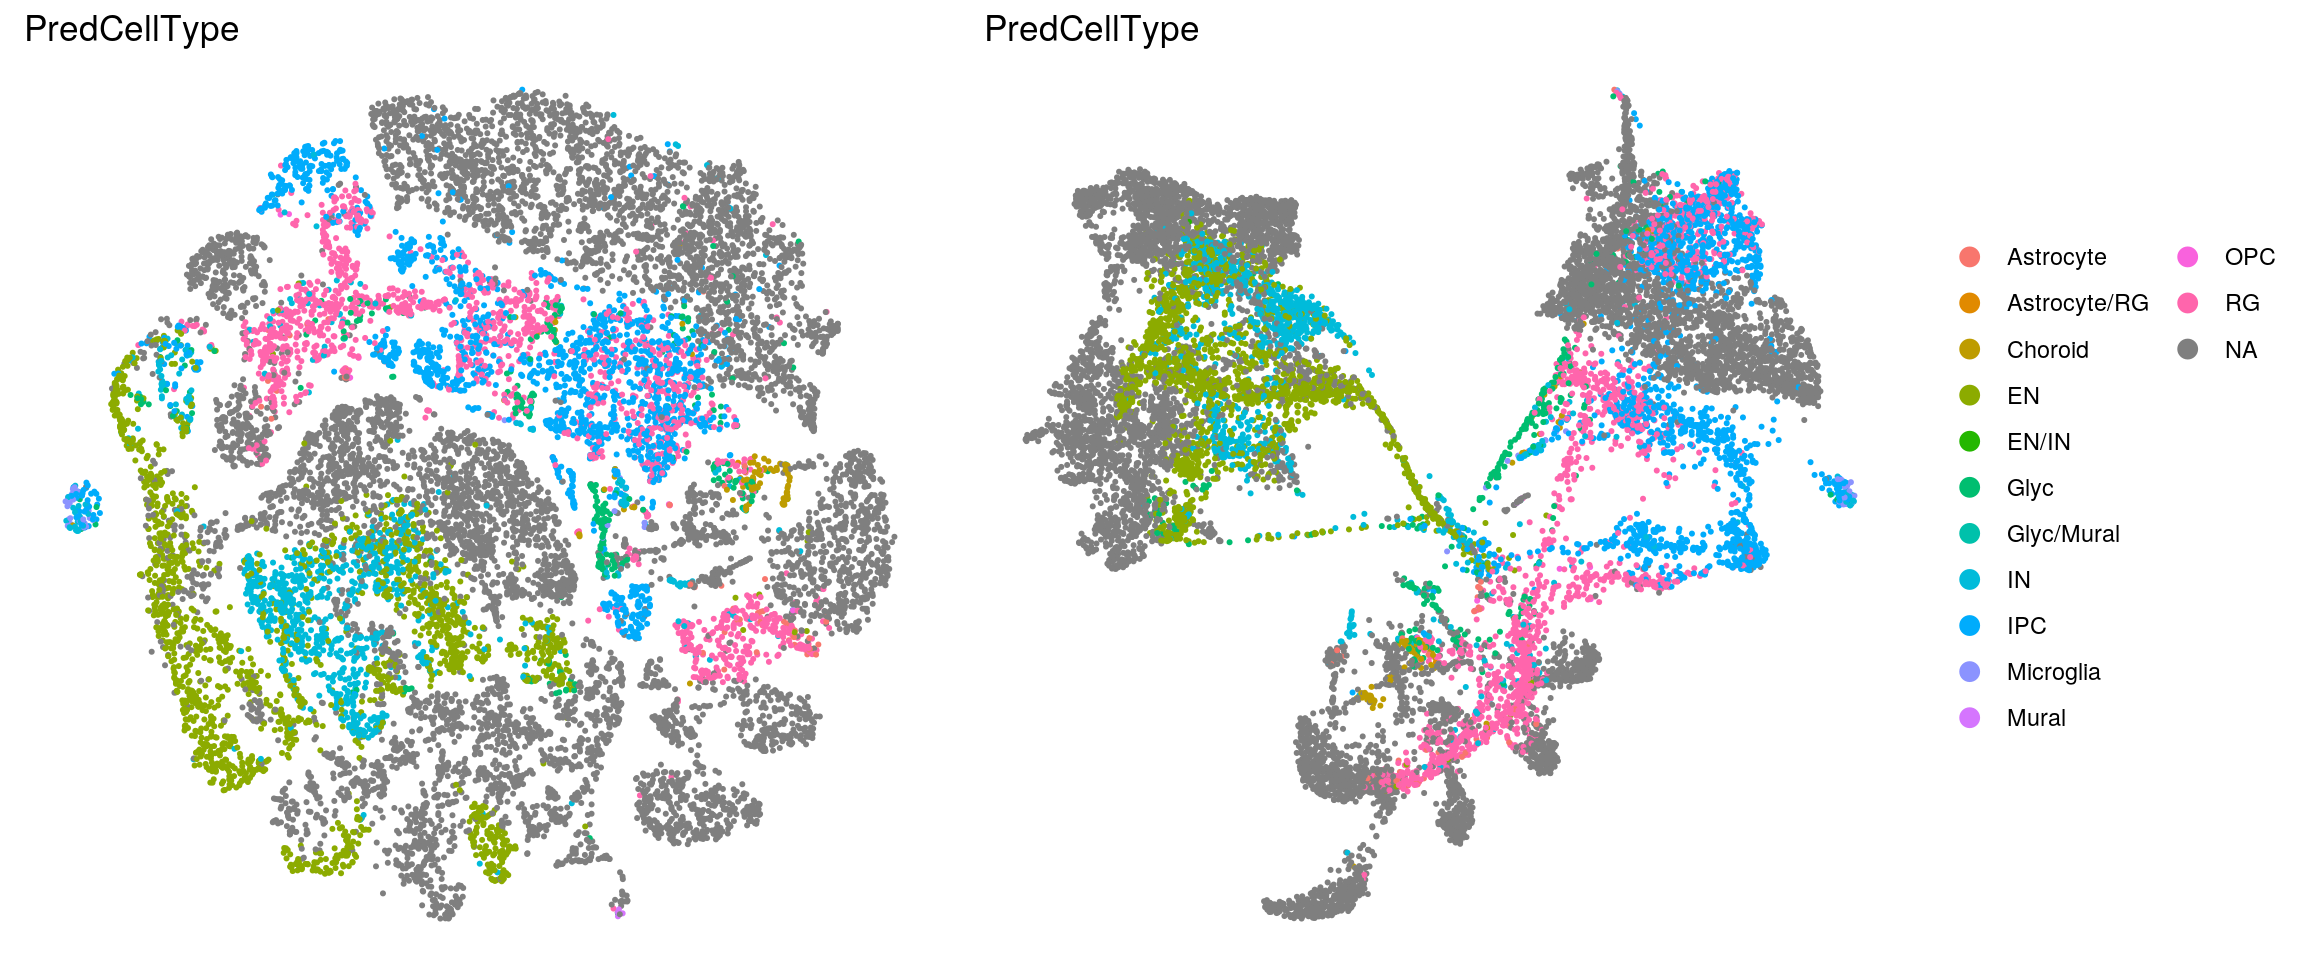
Heatmap with the cell type labels from the Kanton et. al paper. Cell without the label, are excluded from the heatmap!
(n_cells_predcell <- table(sce$cluster_id, sce$PredCellType))
     Astrocyte Astrocyte/RG Choroid Choroid/RG   EN EN/Glyc EN/IN Endothelial
  0          0            0       0          0 2356       2     3           0
  1          8            0       5          0    1       0     1           0
  2          0            0       9          0    0       0     0           0
  3          0            0       0          0    0       0     0           0
  4          0            0       0          0  939       0     0           0
  5         89            0      12          1   22       0     0           0
  6          3            0      61          0   24       0     0           0
  7          0            0       0          0 1109       0     0           0
  8          0            0       0          0 1102       2     0           0
  9        149            1       2          0   18       0     0           0
  10         0            0       0          0 3624       0     0           0
  11         2            0       0          0    5       0     0           0
  12        24            0       0          0    6       0     0           0
  13         0            0       0          0 2107       3     1           0
  14         1            1       1          0    0       0     0           0
  15        21            1     452          0    3       0     0           0
  16        40            1       0          0  837       0     1           0
  17         2            0      38          0    2       0     0           4
  18         0            0       0          0    6       0     0           0
  19        10            0       1          0    0       0     0           0
  20         1            0       1          0    0       0     0           0
  21         0            0       0          0    2       0     0           1

     Glyc Glyc/IN Glyc/Mural Glyc/RG   IN IN/Microglia  IPC IPC/RG Microglia
  0    16       0          0       0 1433            0    1      0         0
  1   113       0          0       0   72            0  257      0        29
  2   210       0          0       0    6            0 4493      0         4
  3     0       0          0       0    5            0  162      0         0
  4     0       0          0       0   17            0    0      0         0
  5    62       0          0       0  193            0   13      0         0
  6   669       0          0       0  127            0 2025      0         2
  7   247       0          0       0  176            0   17      0         0
  8    34       0          0       0 3533            0   23      0         0
  9     0       0          0       0   25            0    2      0         0
  10    0       0          0       0   37            0    5      0         0
  11    3       0          0       0   38            0 2457      1         0
  12    3       0          0       0   60            0    3      0         1
  13    1       0          0       0  196            0    0      0         0
  14    0       0          0       0    0            0    0      0         0
  15  285       0          0       0   33            0    9      0         1
  16   34       0          0       0  250            0  343      0         0
  17  565       0          0       1  197            0   81      0        44
  18    1       0          0       0    0            0    0      0         0
  19    0       1          0       0  149            0    0      0         0
  20   27       0          0       0  217            0  307      0       189
  21    0       0          1       0    1            1    6      0         7

     Mural  OPC   RG
  0      0    0    0
  1      1    0  161
  2      0    0 2135
  3      0    0    5
  4      0    0    0
  5      0    0 2469
  6      0    0 2684
  7      0    0    2
  8      0    0    0
  9      0   11  768
  10     0    0    6
  11     0    4  996
  12     0    0  911
  13     0    0    0
  14     0    0    4
  15     0    0  238
  16     0   28  159
  17     0    0  200
  18     0    0    0
  19     0    0    7
  20     0    0    7
  21    58    0    5
fqs <- prop.table(n_cells_predcell, margin = 2)
mat <- round(as.matrix(unclass(fqs))*100, 2)
cn <- colnames(mat)
Heatmap(mat,
col = colfunc(10),
name = "Percentage\nof cells",
cluster_rows = FALSE,
cluster_columns = FALSE,
show_column_names = FALSE,
row_names_side = "left",
row_title = "cluster ID",
column_title = "cell type",
column_title_side = "bottom",
rect_gp = gpar(col = "white"),
cell_fun = function(i, j, x, y, width, height, fill)
grid.text(mat[j, i], x = x, y = y,
gp = gpar(col = "black", fontsize = 10)),
bottom_annotation = HeatmapAnnotation(
text = anno_text(cn, rot = 80, just = "right")))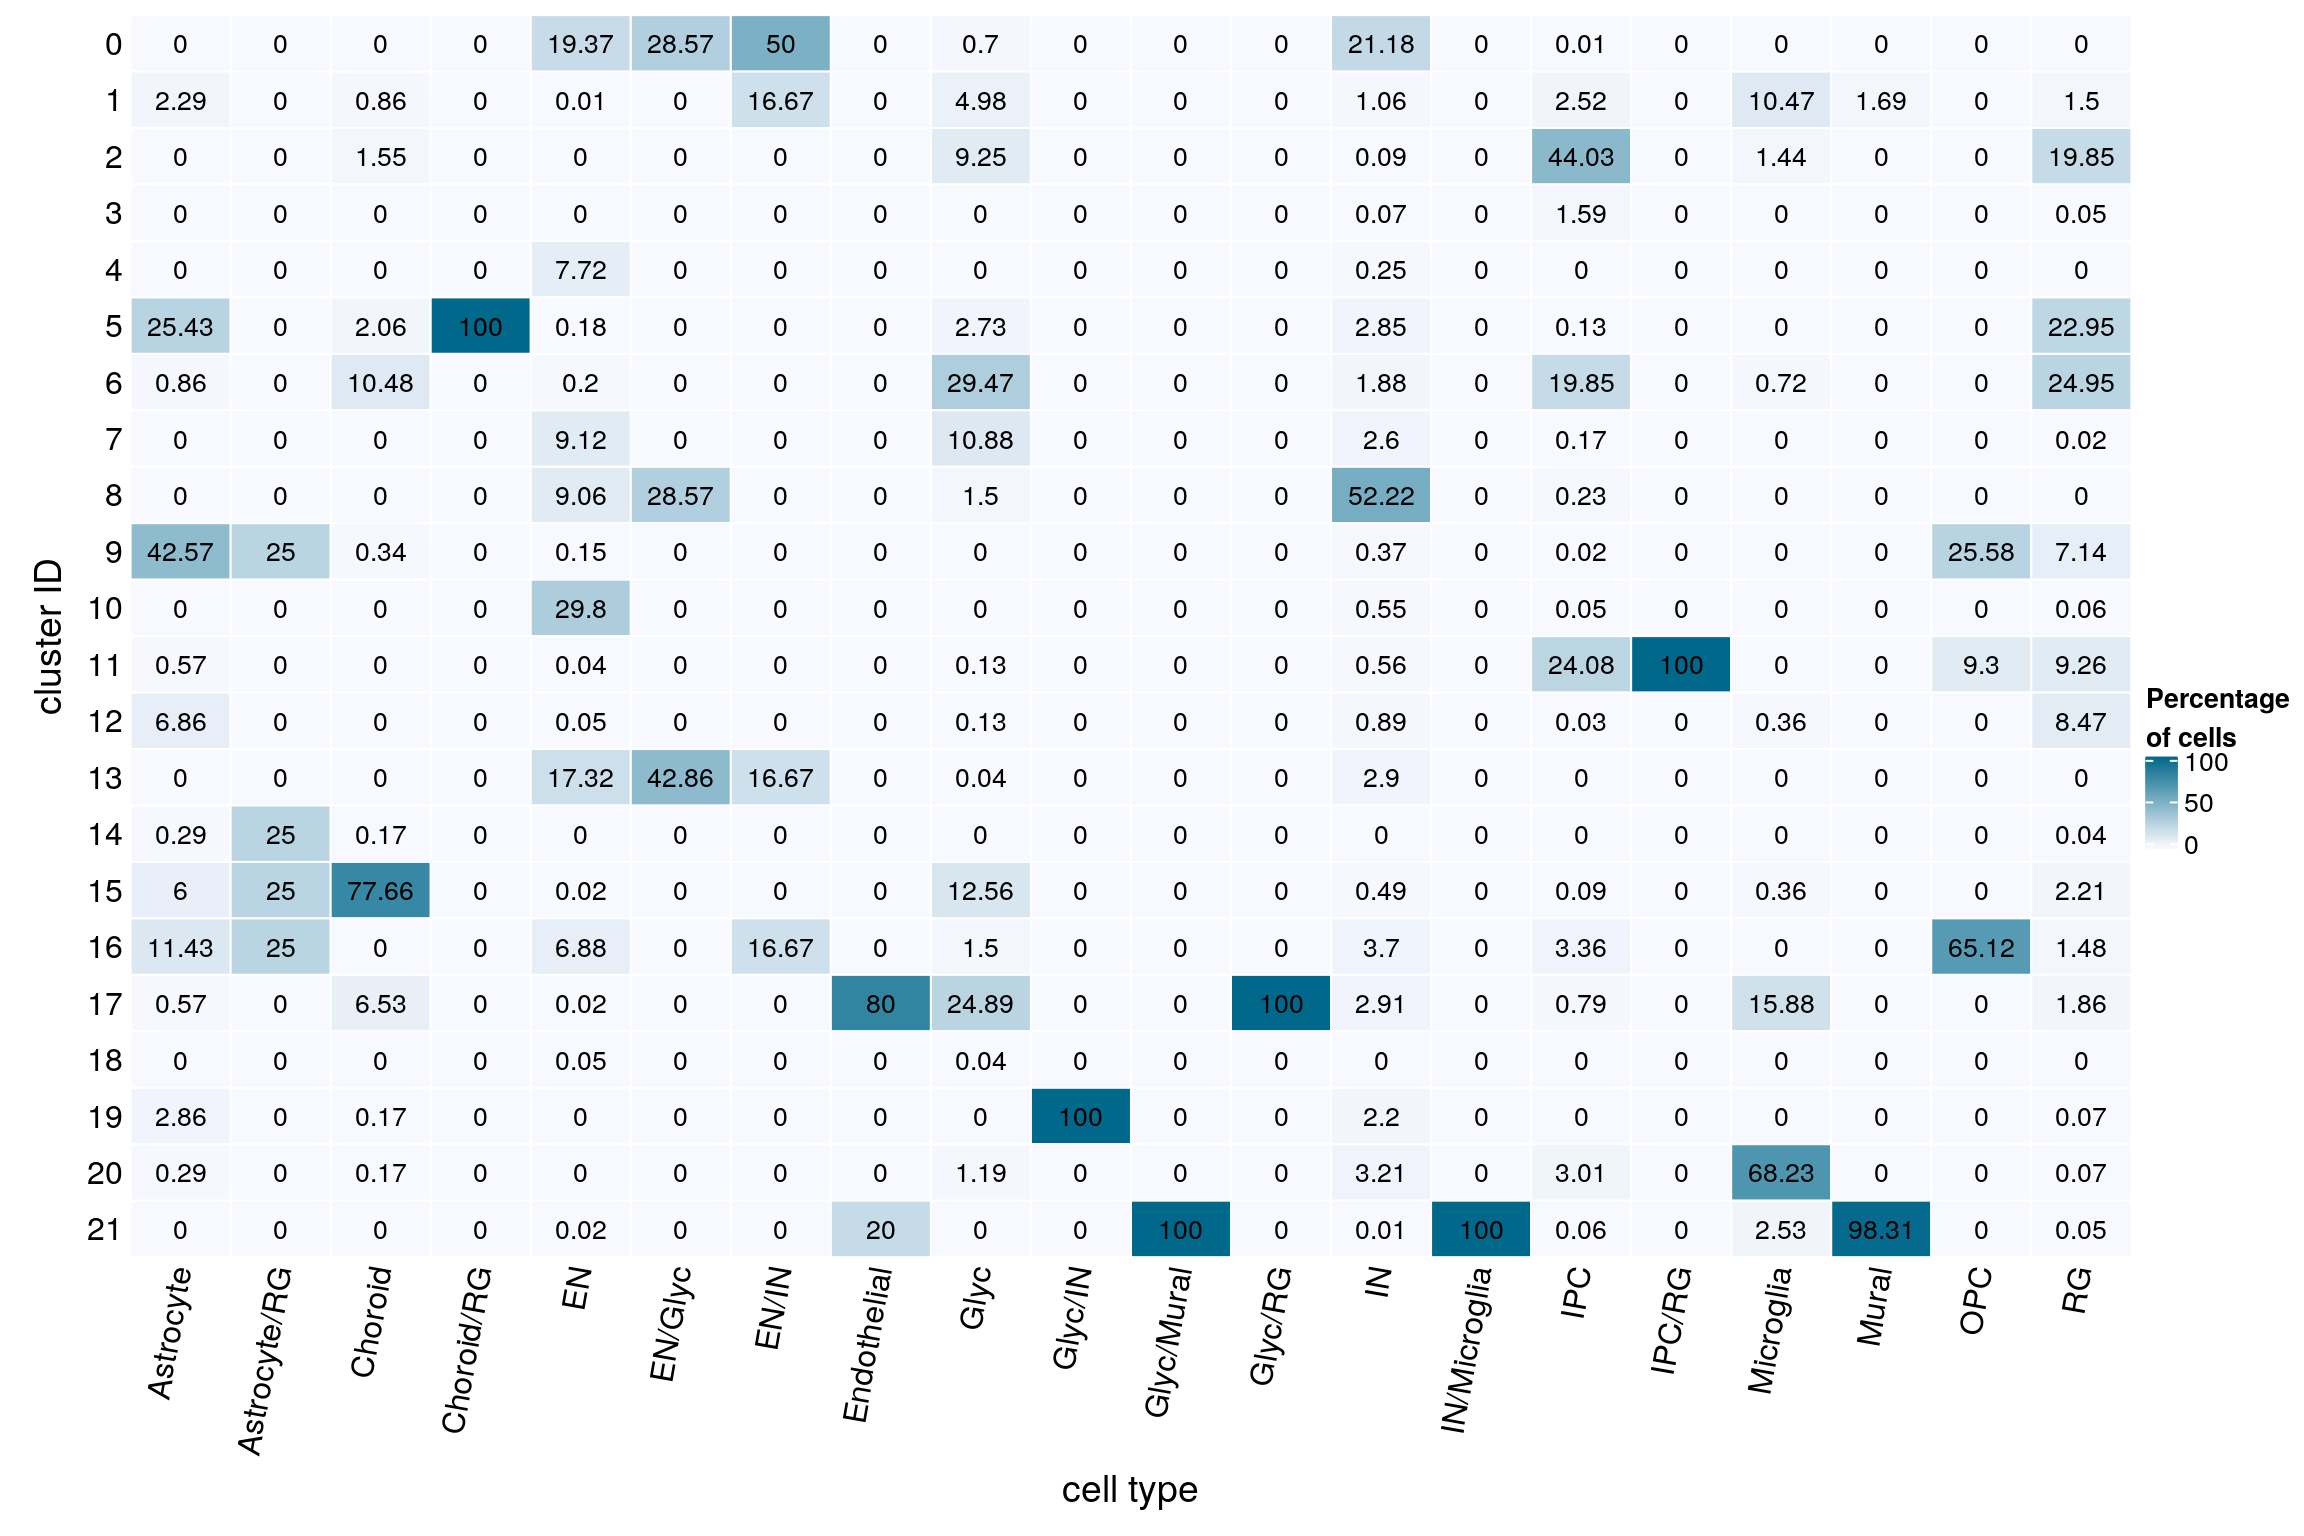
| Version | Author | Date |
|---|---|---|
| 6d0fe5e | khembach | 2021-04-08 |
(n_cells_predcell <- table(sce$PredCellType, sce$cluster_id))
                  0    1    2    3    4    5    6    7    8    9   10   11   12
  Astrocyte       0    8    0    0    0   89    3    0    0  149    0    2   24
  Astrocyte/RG    0    0    0    0    0    0    0    0    0    1    0    0    0
  Choroid         0    5    9    0    0   12   61    0    0    2    0    0    0
  Choroid/RG      0    0    0    0    0    1    0    0    0    0    0    0    0
  EN           2356    1    0    0  939   22   24 1109 1102   18 3624    5    6
  EN/Glyc         2    0    0    0    0    0    0    0    2    0    0    0    0
  EN/IN           3    1    0    0    0    0    0    0    0    0    0    0    0
  Endothelial     0    0    0    0    0    0    0    0    0    0    0    0    0
  Glyc           16  113  210    0    0   62  669  247   34    0    0    3    3
  Glyc/IN         0    0    0    0    0    0    0    0    0    0    0    0    0
  Glyc/Mural      0    0    0    0    0    0    0    0    0    0    0    0    0
  Glyc/RG         0    0    0    0    0    0    0    0    0    0    0    0    0
  IN           1433   72    6    5   17  193  127  176 3533   25   37   38   60
  IN/Microglia    0    0    0    0    0    0    0    0    0    0    0    0    0
  IPC             1  257 4493  162    0   13 2025   17   23    2    5 2457    3
  IPC/RG          0    0    0    0    0    0    0    0    0    0    0    1    0
  Microglia       0   29    4    0    0    0    2    0    0    0    0    0    1
  Mural           0    1    0    0    0    0    0    0    0    0    0    0    0
  OPC             0    0    0    0    0    0    0    0    0   11    0    4    0
  RG              0  161 2135    5    0 2469 2684    2    0  768    6  996  911

                 13   14   15   16   17   18   19   20   21
  Astrocyte       0    1   21   40    2    0   10    1    0
  Astrocyte/RG    0    1    1    1    0    0    0    0    0
  Choroid         0    1  452    0   38    0    1    1    0
  Choroid/RG      0    0    0    0    0    0    0    0    0
  EN           2107    0    3  837    2    6    0    0    2
  EN/Glyc         3    0    0    0    0    0    0    0    0
  EN/IN           1    0    0    1    0    0    0    0    0
  Endothelial     0    0    0    0    4    0    0    0    1
  Glyc            1    0  285   34  565    1    0   27    0
  Glyc/IN         0    0    0    0    0    0    1    0    0
  Glyc/Mural      0    0    0    0    0    0    0    0    1
  Glyc/RG         0    0    0    0    1    0    0    0    0
  IN            196    0   33  250  197    0  149  217    1
  IN/Microglia    0    0    0    0    0    0    0    0    1
  IPC             0    0    9  343   81    0    0  307    6
  IPC/RG          0    0    0    0    0    0    0    0    0
  Microglia       0    0    1    0   44    0    0  189    7
  Mural           0    0    0    0    0    0    0    0   58
  OPC             0    0    0   28    0    0    0    0    0
  RG              0    4  238  159  200    0    7    7    5
fqs <- prop.table(n_cells_predcell, margin = 2)
mat <- round(as.matrix(unclass(fqs))*100, 2)
Heatmap(mat,
col = colfunc(10),
name = "Percentage\nof cells",
cluster_rows = FALSE,
cluster_columns = FALSE,
row_names_side = "left",
row_title = "cell type",
row_names_rot = 10,
column_title = "line",
column_title_side = "bottom",
rect_gp = gpar(col = "white"),
cell_fun = function(i, j, x, y, width, height, fill)
grid.text(mat[j, i], x = x, y = y,
gp = gpar(col = "black", fontsize = 10)))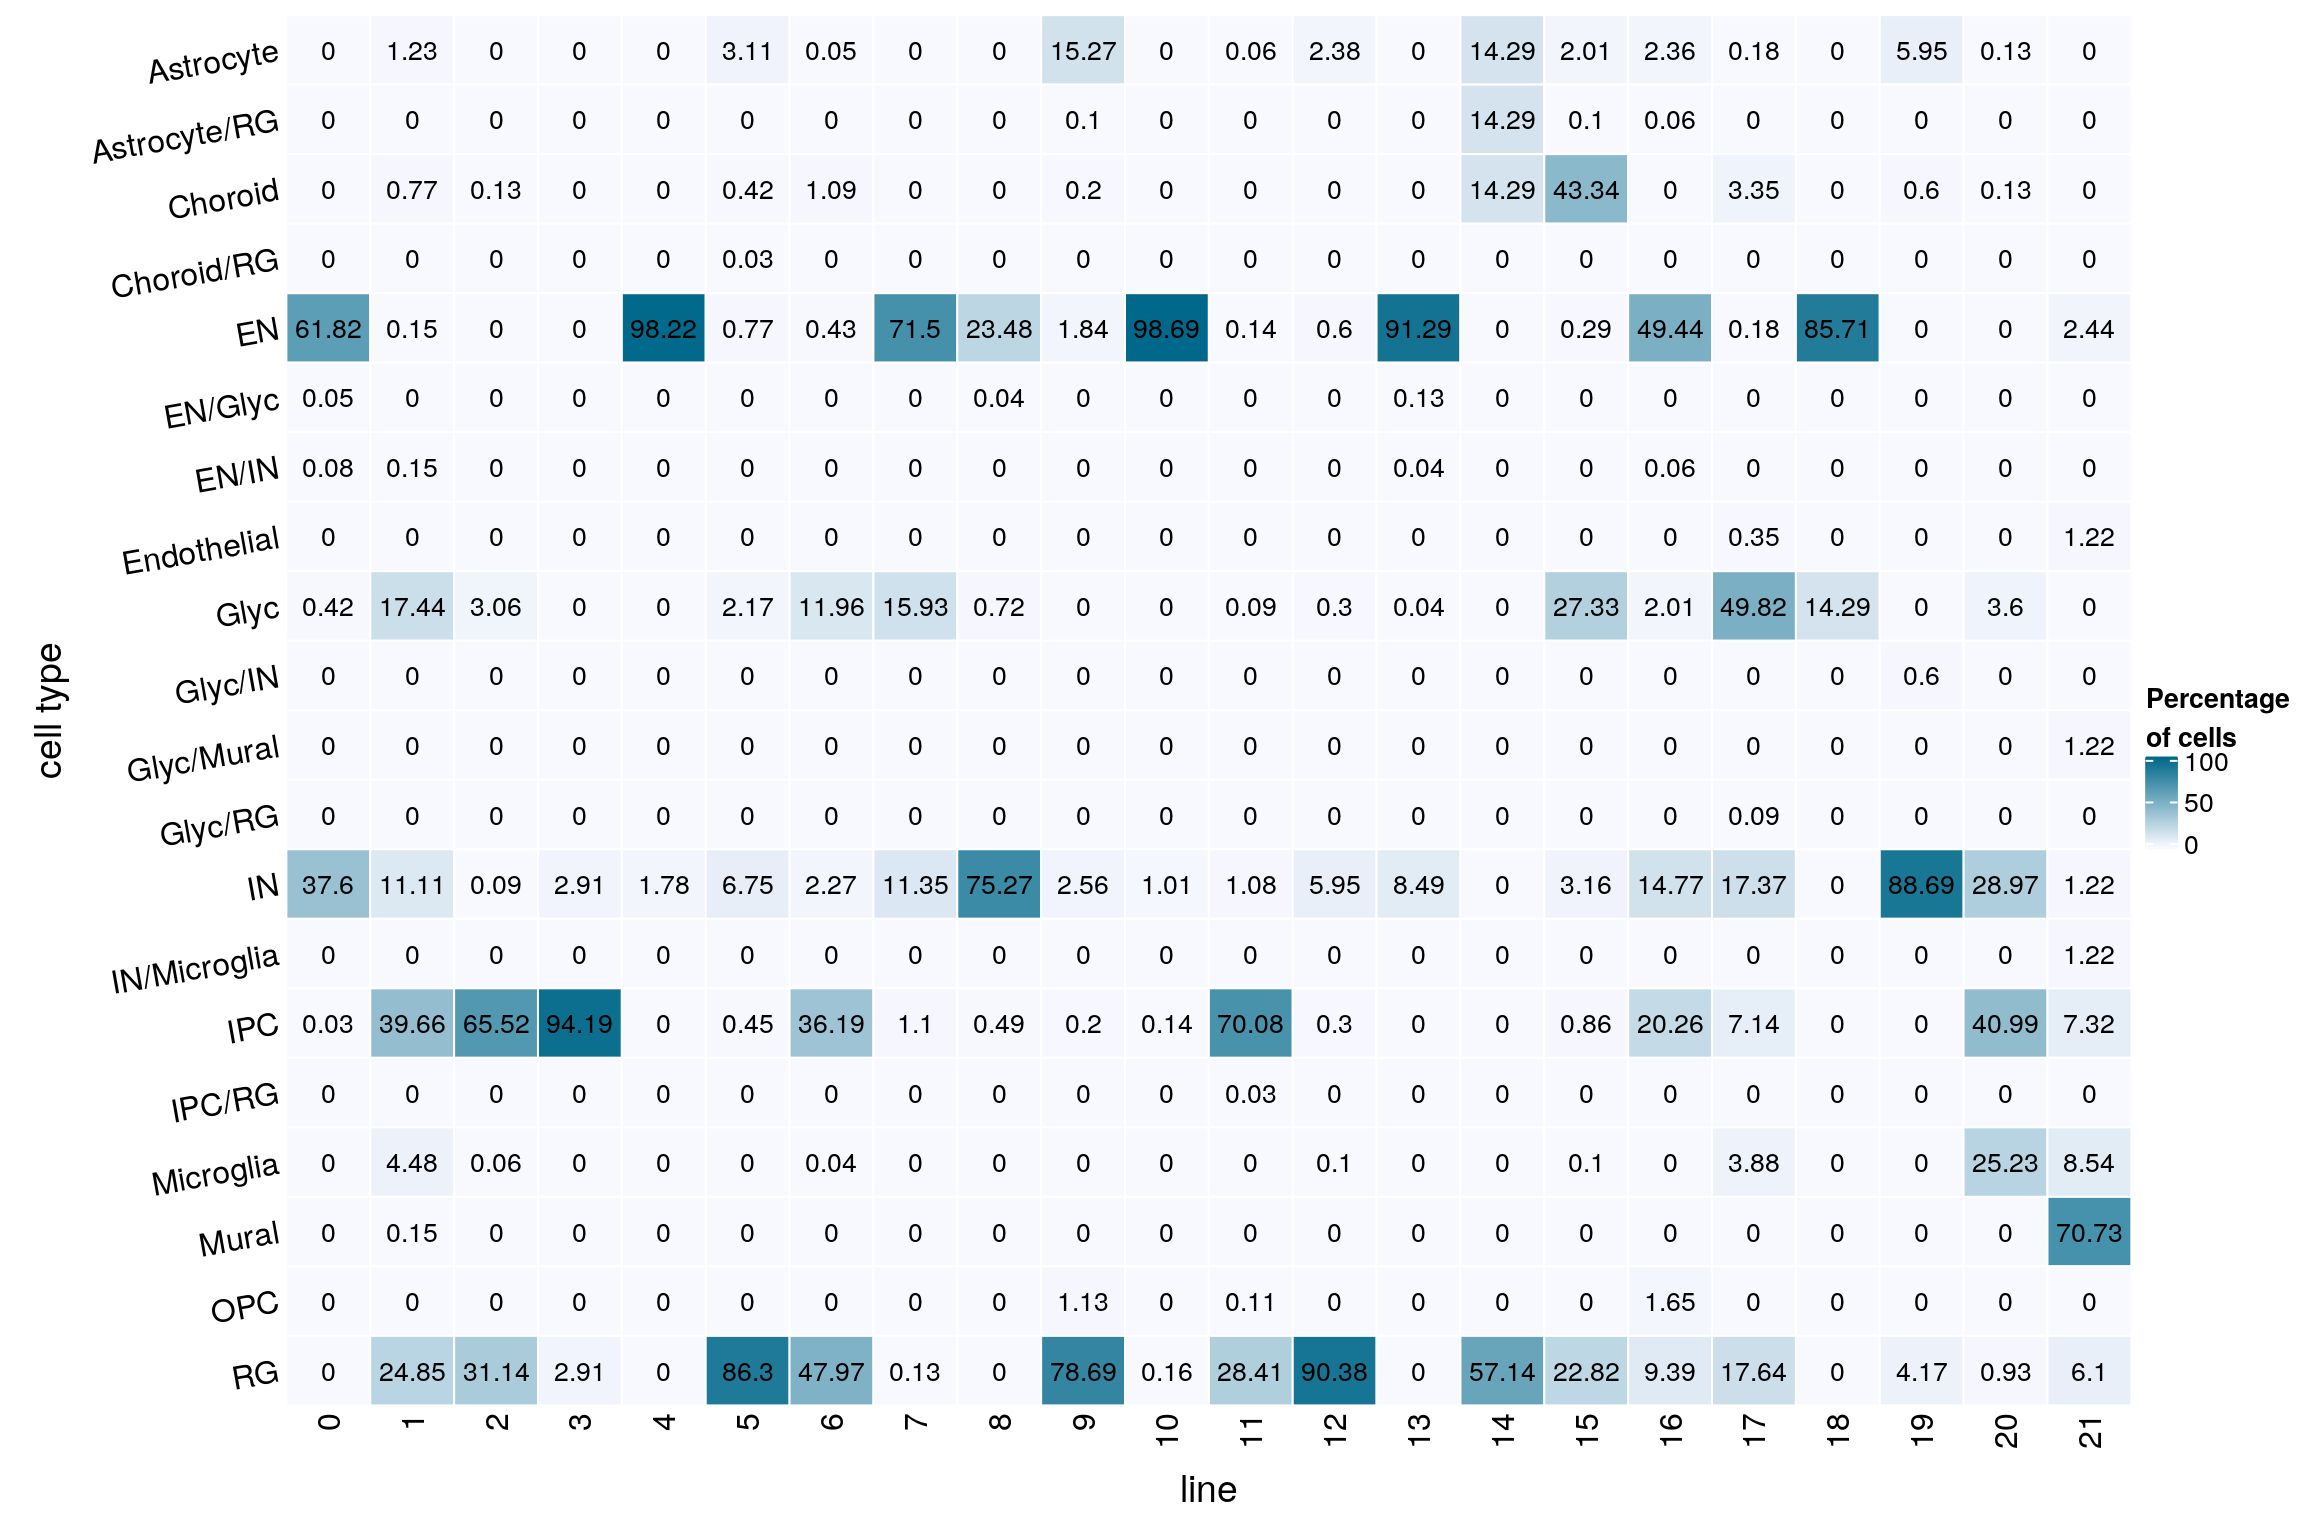
| Version | Author | Date |
|---|---|---|
| 6d0fe5e | khembach | 2021-04-08 |
Plots for manuscript
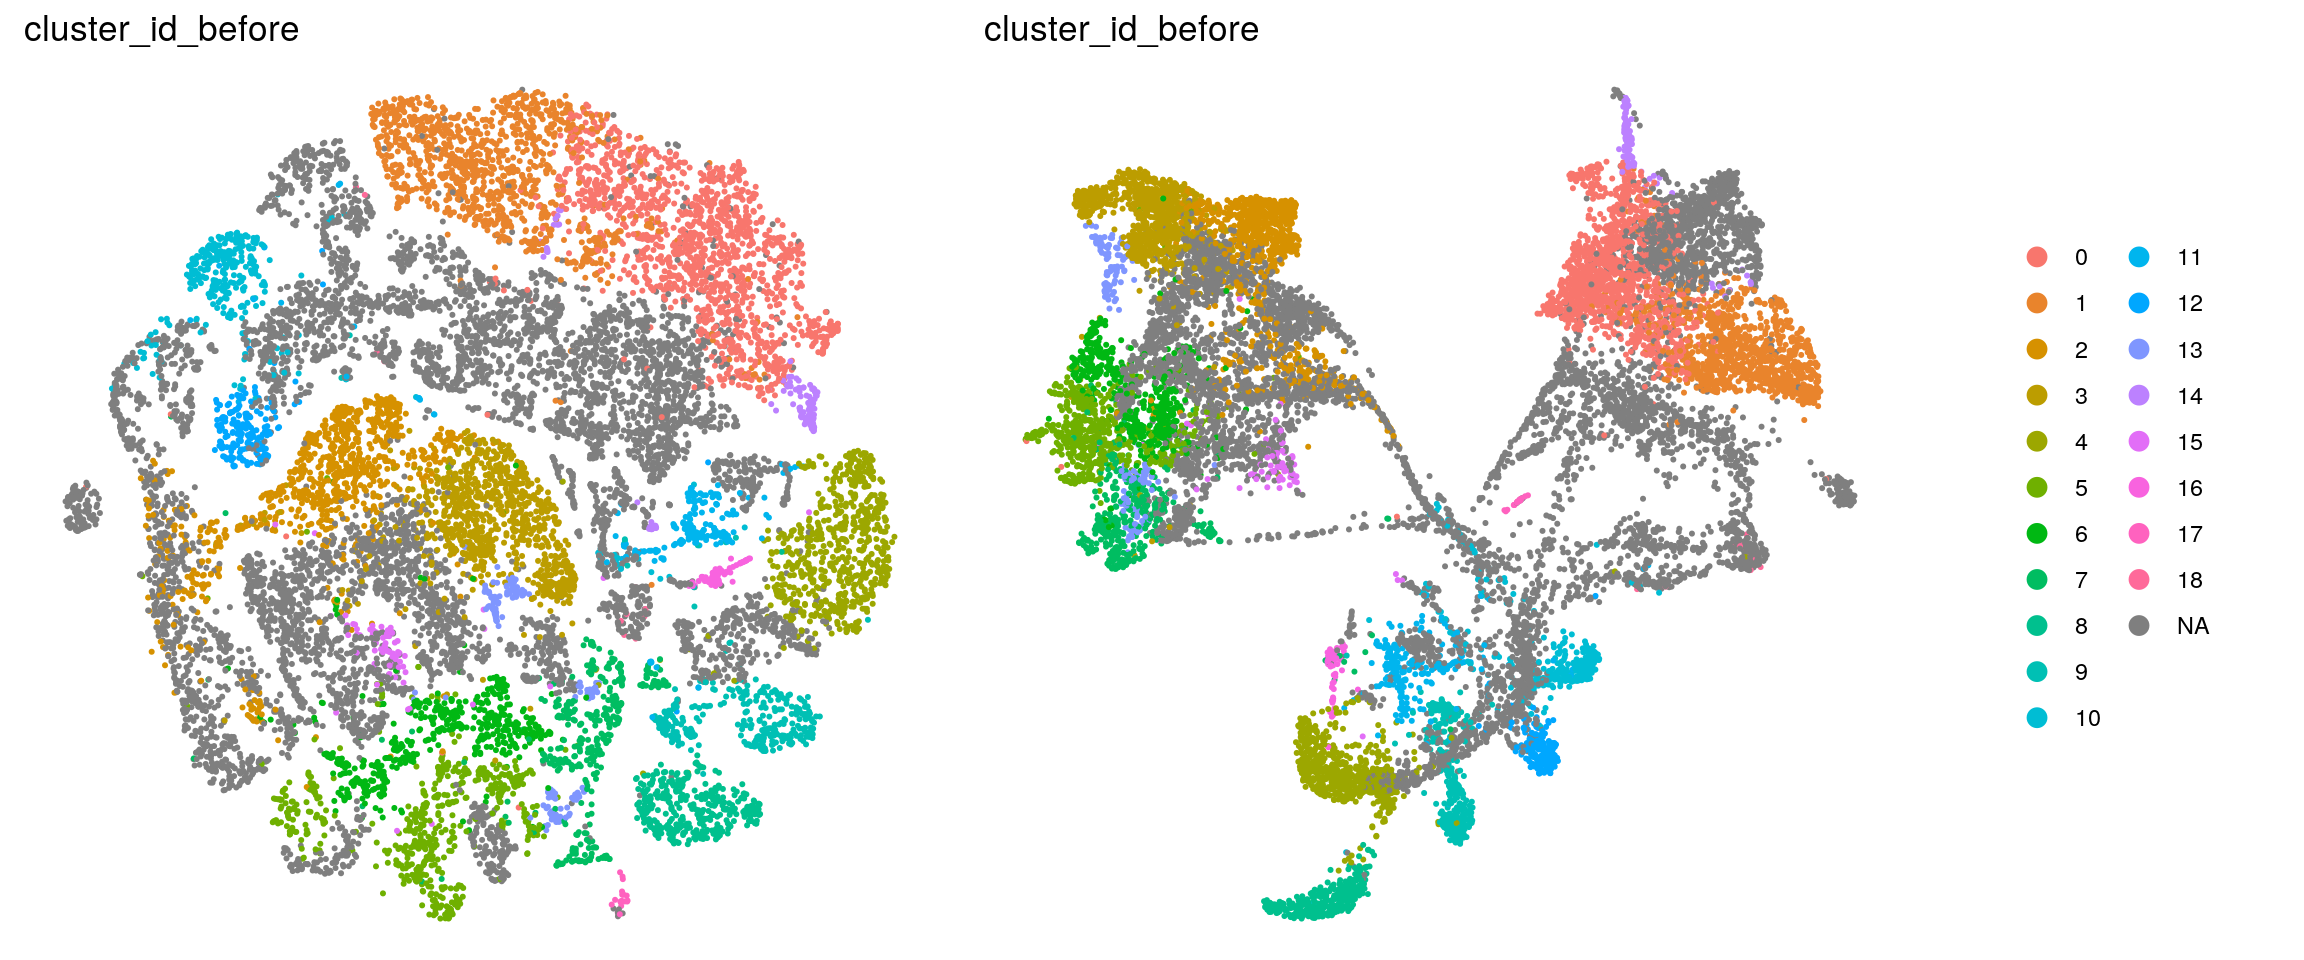
Distribution of timeline clusters before and after integration
How are the individual clusters distributed after integration of the organoid dataset?
## Load the Seurat object from our NSC analysis
so_before <- readRDS(file.path("output", "so_06-clustering_all_timepoints.rds"))
so_before <- SetIdent(so_before, value = "RNA_snn_res.0.4")
so_before@meta.data$cluster_id <- Idents(so_before)
table(so_before@meta.data$cluster_id)
   0    1    2    3    4    5    6    7    8    9   10   11   12   13   14   15
9211 6812 5756 5731 4326 3791 3233 2521 2324 2215 2046 1409 1294 1135  730  454
  16   17   18
 450  170  102
## join the cluster_ids from both clustering runs
before <- data.frame(cell = colnames(so_before),
cluster_before = so_before@meta.data[,c("cluster_id")])
after <- data.frame(cell = colnames(so),
cluster_after = so@meta.data[,c("cluster_id")])
clusters <- before %>% full_join(after)
## check if cells from the same cluster are still in the same cluster
(n_clusters <- table(clusters$cluster_after, clusters$cluster_before))
        0    1    2    3    4    5    6    7    8    9   10   11   12   13   14
  0     1    1 4523 4727    4   27   28    3    0    0    0    0    0   34    0
  1  8217  717    0    0    0    0    0    0    0    0    0    0    0    0  614
  2   194   47    0    0    0    0    0    0    0    0    0    0    0    0    0
  3   706 6017    0    0    0    0    0    0    0    0    0    0    0    0  115
  4     6    0   48   22    2 3272 2389   58    0    0    0    0    0    3    0
  5     0    0    0    0    1    0    0    0    0    5 1724   11 1249    0    0
  6    55   18    0    0    0    0    0    0    0    0    0    0    0    0    0
  7     9    2   10   39    7  288  594 2408    0   10    1   59    0  592    0
  8     4    0   90   27    3   14  144   21    0    0    3    2    0    8    0
  9     0    0    1    0 4216    2    0    4    9    6    1   19    0    0    0
  10    0    0 1070    7    0   44   39    1    0    0    1    0    0    1    0
  11    1    8    0    0    6    0    0    0    0    1    8   11    4    0    0
  12    0    0    0    0   23    0    0    1    0 1607    7    3    0    0    0
  13    0    0    2    7    0  144   37   17    1    0    0    0    0    1    0
  14    0    0    0    0   34    0    0    1 2308   12    2    0    0    0    0
  15    0    0    0    0   11    0    0    0    1   67   25 1135    6    0    0
  16    0    0    8    0    8    0    0    0    0    9  196    5    0    0    0
  17    8    0    0    0   10    0    0    0    1   14   68  162   22    0    0
  18    0    0    4  902    0    0    2    6    0    0    0    0    0  496    0
  19    0    0    0    0    1    0    0    1    4  484   10    2   13    0    0
  20   10    2    0    0    0    0    0    0    0    0    0    0    0    0    0
  21    0    0    0    0    0    0    0    0    0    0    0    0    0    0    1

       15   16   17   18
  0     7    0    0    0
  1     0    0    0    0
  2     0    0    0    0
  3     0    0    0    0
  4     9    0    0    0
  5     0    1    0    1
  6     0    0    0    0
  7     8    0    1    0
  8   416    0    0    0
  9     1    1    0    0
  10    7    0    0    0
  11    0    0    0  100
  12    0    3    0    0
  13    0    0    0    0
  14    0    1    0    0
  15    0    0    0    0
  16    0    0    0    1
  17    5    1    1    0
  18    0    0    0    0
  19    1  443    0    0
  20    0    0    0    0
  21    0    0  168    0
fqs <- prop.table(n_clusters, margin = 2)
mat <- as.matrix(unclass(fqs))
Heatmap(mat,
col = rev(brewer.pal(11, "RdGy")[-6]),
name = "Frequency",
cluster_rows = FALSE,
cluster_columns = FALSE,
row_names_side = "left",
row_title = "clusters after organoid integration",
column_title = "clusters before organoid integration",
column_title_side = "bottom",
rect_gp = gpar(col = "white"),
cell_fun = function(i, j, x, y, width, height, fill)
grid.text(round(mat[j, i] * 100, 2), x = x, y = y,
gp = gpar(col = "white", fontsize = 8)))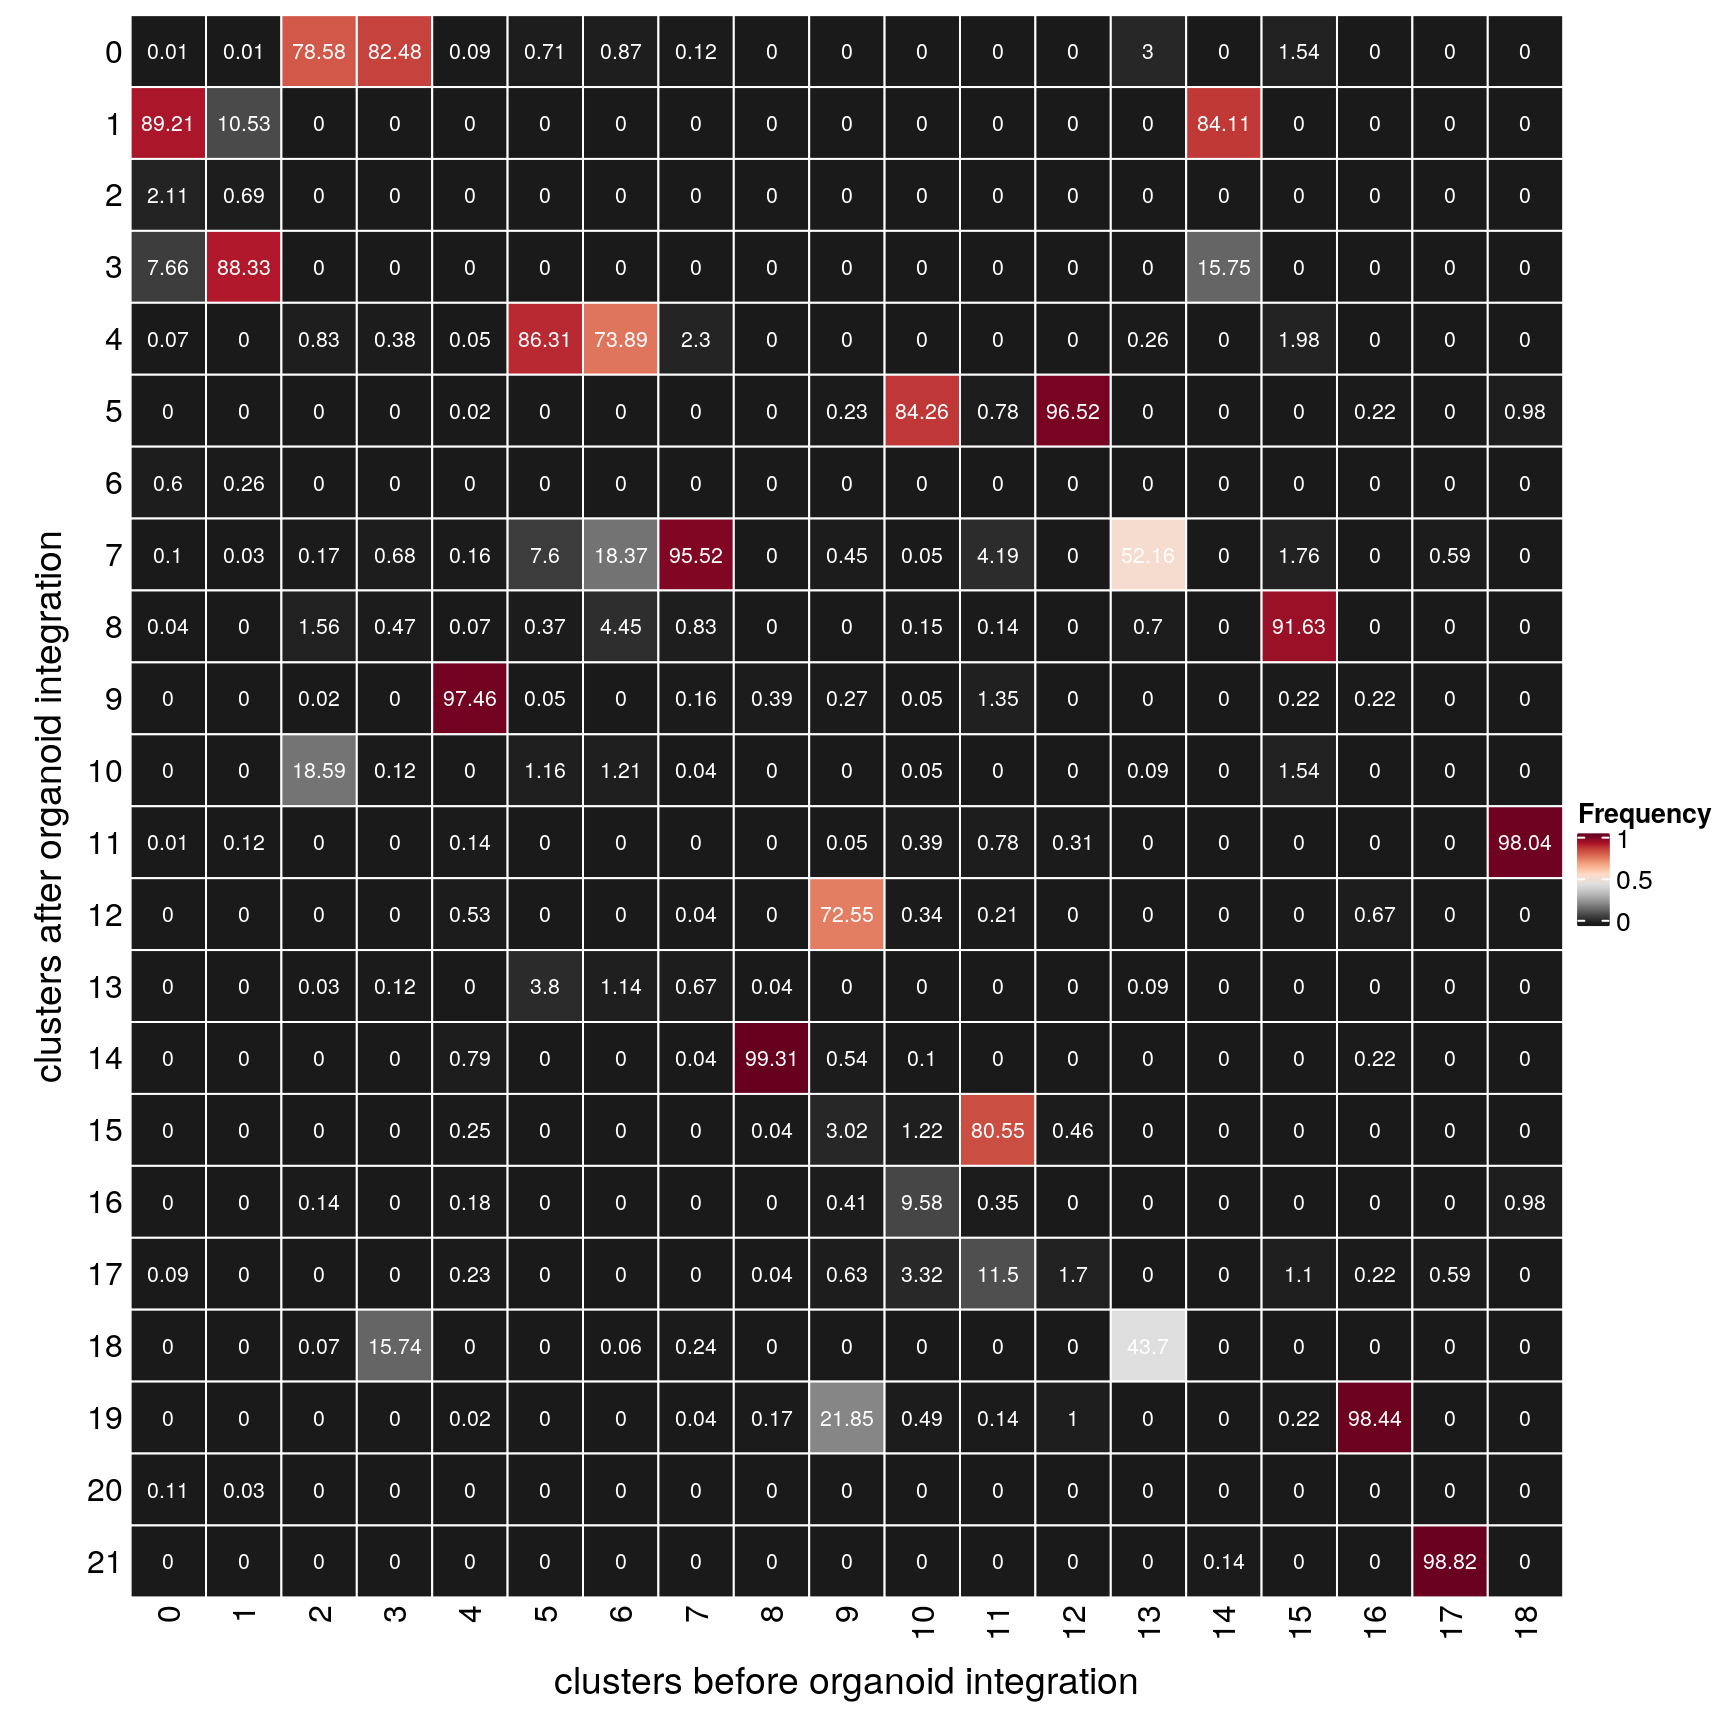
| Version | Author | Date |
|---|---|---|
| 917cd29 | khembach | 2021-08-31 |
(n_clusters <- table(clusters$cluster_before, clusters$cluster_after))
        0    1    2    3    4    5    6    7    8    9   10   11   12   13   14
  0     1 8217  194  706    6    0   55    9    4    0    0    1    0    0    0
  1     1  717   47 6017    0    0   18    2    0    0    0    8    0    0    0
  2  4523    0    0    0   48    0    0   10   90    1 1070    0    0    2    0
  3  4727    0    0    0   22    0    0   39   27    0    7    0    0    7    0
  4     4    0    0    0    2    1    0    7    3 4216    0    6   23    0   34
  5    27    0    0    0 3272    0    0  288   14    2   44    0    0  144    0
  6    28    0    0    0 2389    0    0  594  144    0   39    0    0   37    0
  7     3    0    0    0   58    0    0 2408   21    4    1    0    1   17    1
  8     0    0    0    0    0    0    0    0    0    9    0    0    0    1 2308
  9     0    0    0    0    0    5    0   10    0    6    0    1 1607    0   12
  10    0    0    0    0    0 1724    0    1    3    1    1    8    7    0    2
  11    0    0    0    0    0   11    0   59    2   19    0   11    3    0    0
  12    0    0    0    0    0 1249    0    0    0    0    0    4    0    0    0
  13   34    0    0    0    3    0    0  592    8    0    1    0    0    1    0
  14    0  614    0  115    0    0    0    0    0    0    0    0    0    0    0
  15    7    0    0    0    9    0    0    8  416    1    7    0    0    0    0
  16    0    0    0    0    0    1    0    0    0    1    0    0    3    0    1
  17    0    0    0    0    0    0    0    1    0    0    0    0    0    0    0
  18    0    0    0    0    0    1    0    0    0    0    0  100    0    0    0

       15   16   17   18   19   20   21
  0     0    0    8    0    0   10    0
  1     0    0    0    0    0    2    0
  2     0    8    0    4    0    0    0
  3     0    0    0  902    0    0    0
  4    11    8   10    0    1    0    0
  5     0    0    0    0    0    0    0
  6     0    0    0    2    0    0    0
  7     0    0    0    6    1    0    0
  8     1    0    1    0    4    0    0
  9    67    9   14    0  484    0    0
  10   25  196   68    0   10    0    0
  11 1135    5  162    0    2    0    0
  12    6    0   22    0   13    0    0
  13    0    0    0  496    0    0    0
  14    0    0    0    0    0    0    1
  15    0    0    5    0    1    0    0
  16    0    0    1    0  443    0    0
  17    0    0    1    0    0    0  168
  18    0    1    0    0    0    0    0
fqs <- prop.table(n_clusters, margin = 2)
mat <- as.matrix(unclass(fqs))
Heatmap(mat,
col = rev(brewer.pal(11, "RdGy")[-6]),
name = "Frequency",
cluster_rows = FALSE,
cluster_columns = FALSE,
row_names_side = "left",
row_title = "clusters before organoid integration",
column_title = "clusters after organoid integration",
column_title_side = "bottom",
rect_gp = gpar(col = "white"),
cell_fun = function(i, j, x, y, width, height, fill)
grid.text(round(mat[j, i] * 100, 2), x = x, y = y,
gp = gpar(col = "white", fontsize = 8)))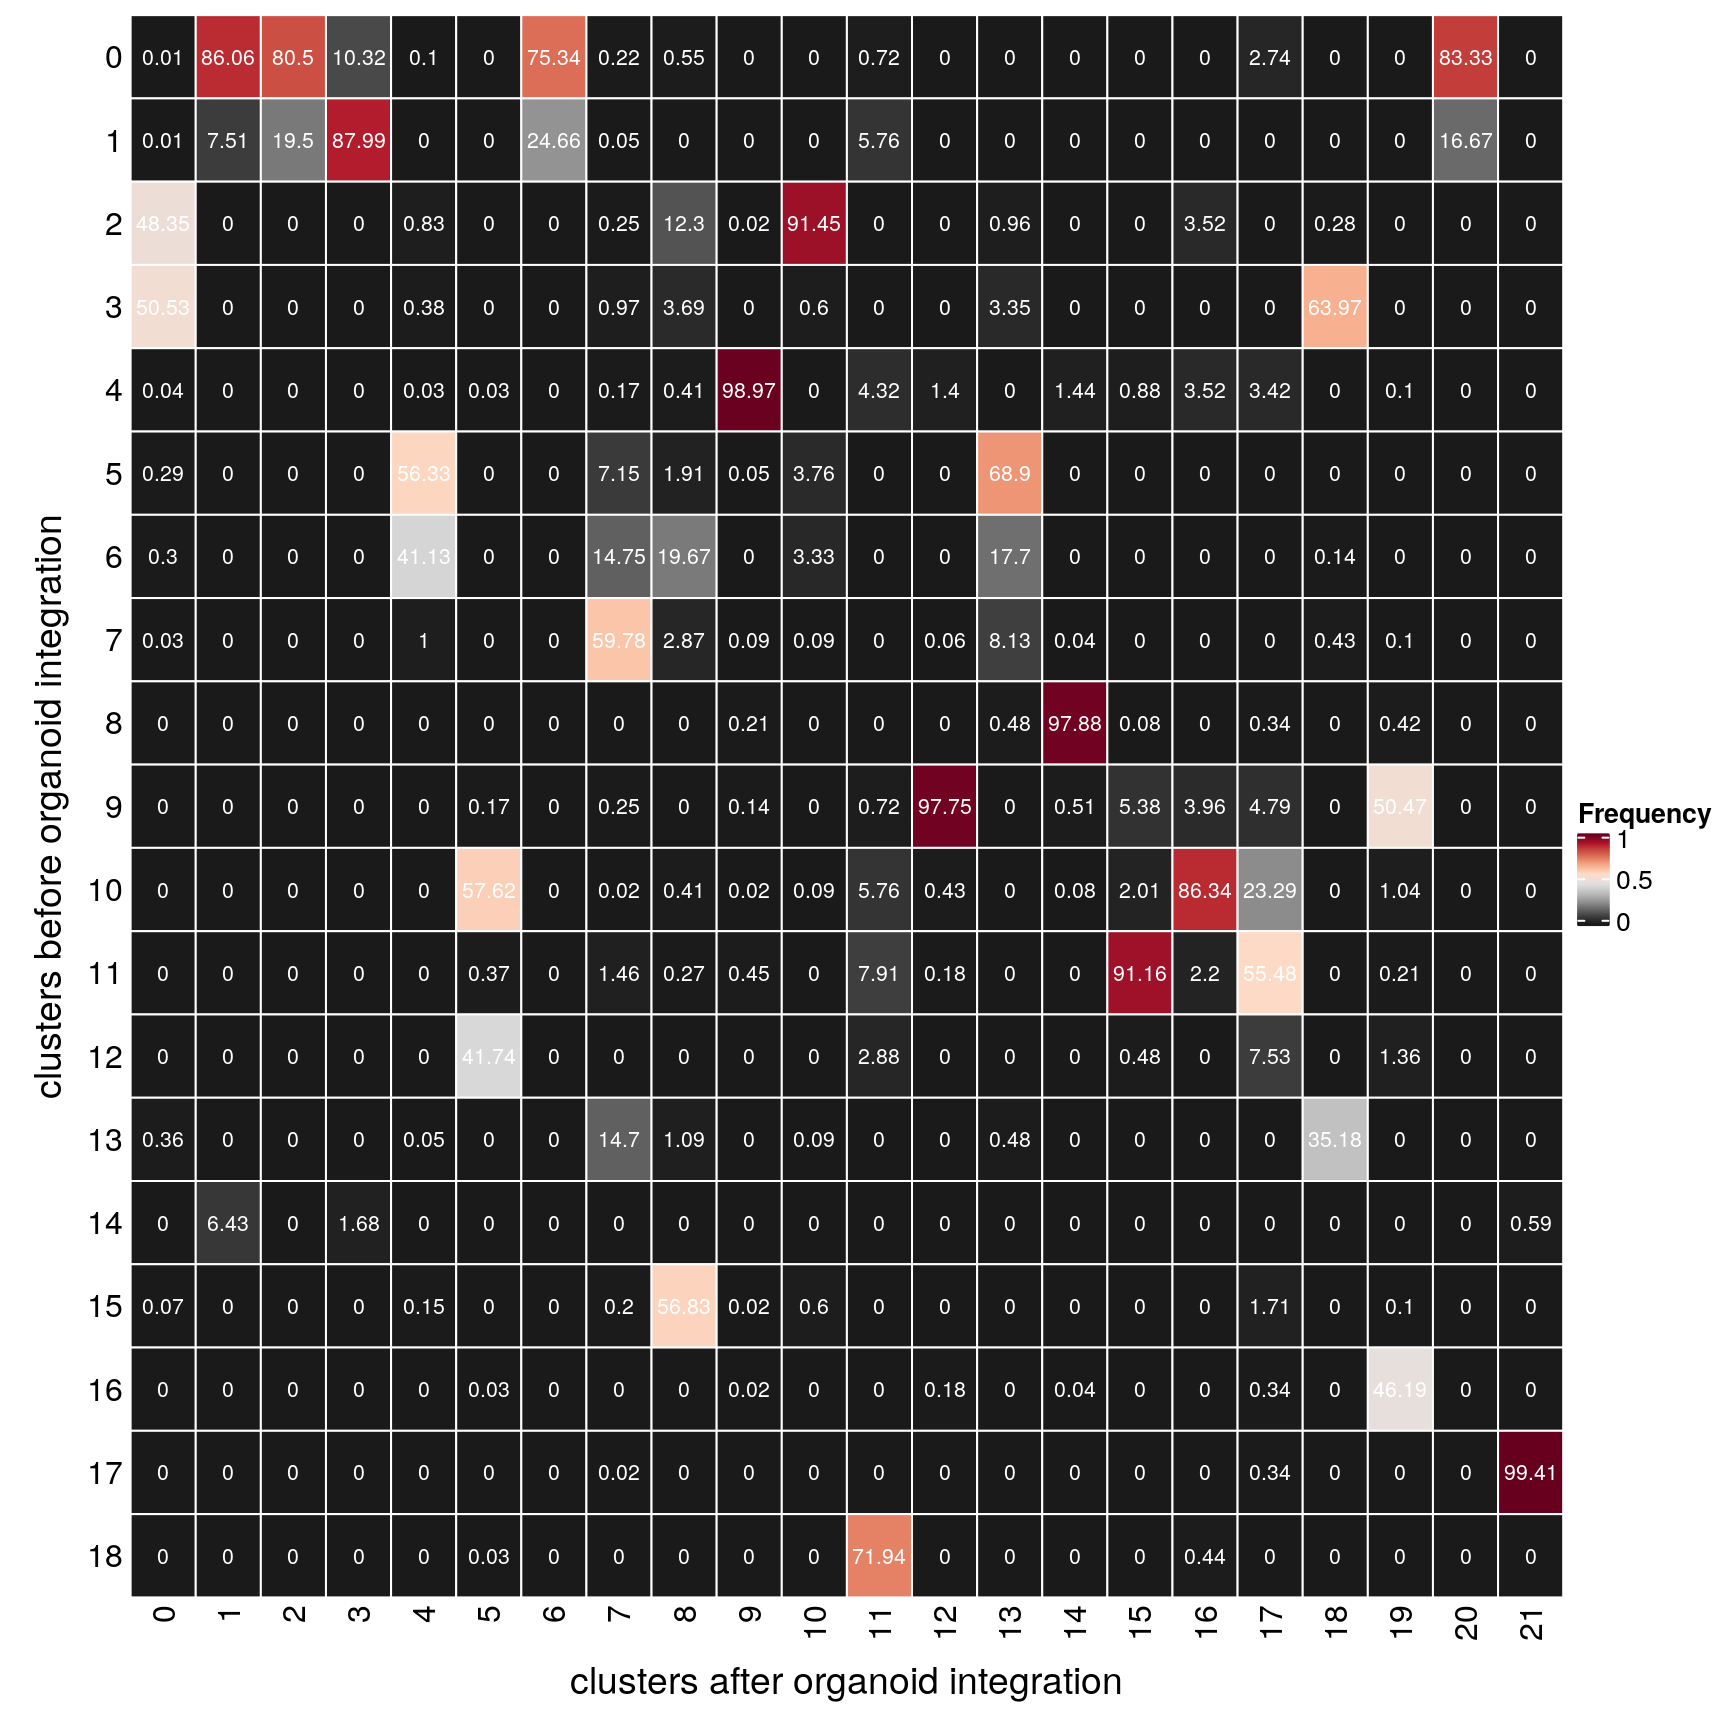
| Version | Author | Date |
|---|---|---|
| 917cd29 | khembach | 2021-08-31 |
## add the old cluster identities to the Seurat object
so@meta.data$cluster_id_before <- so_before@meta.data$cluster_id[
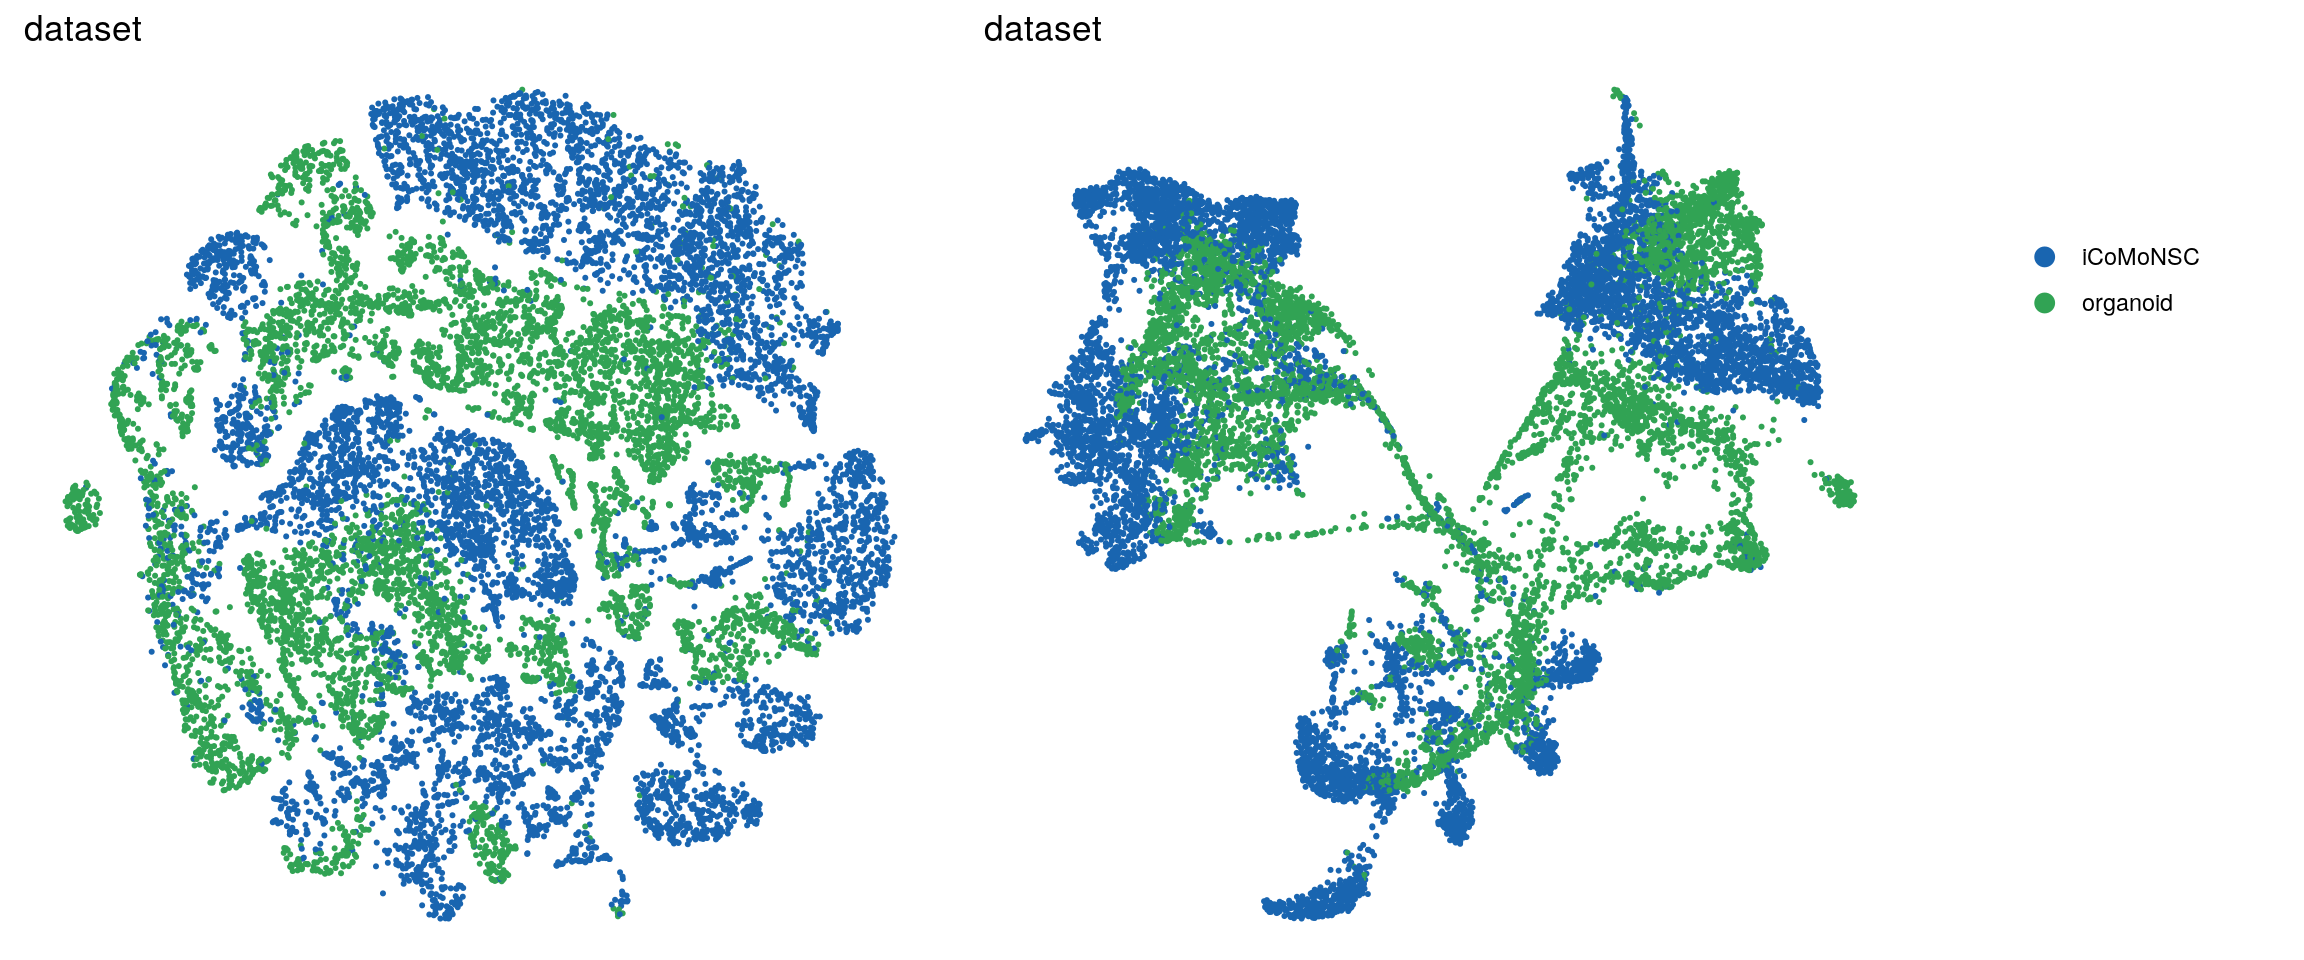
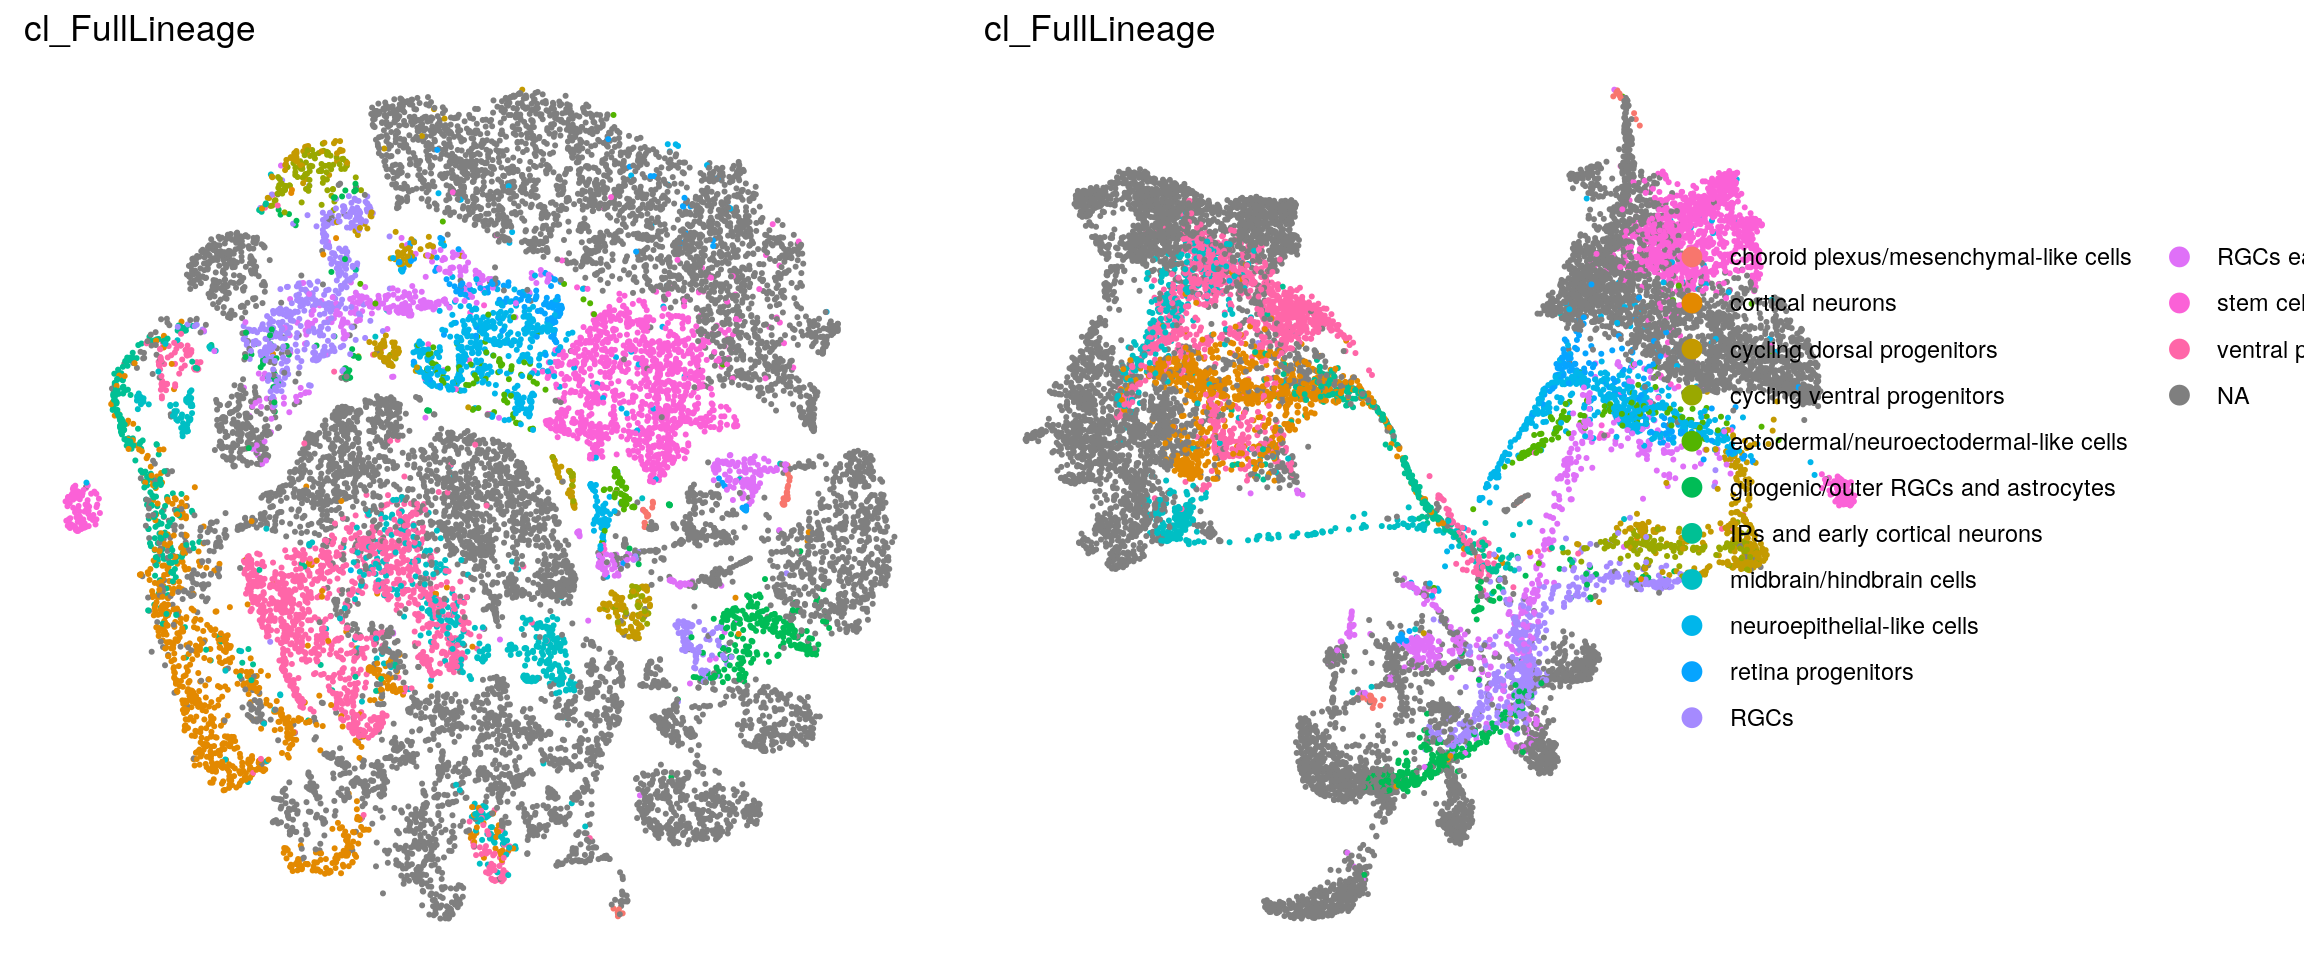
match(colnames(so), colnames(so_before))]UMAP
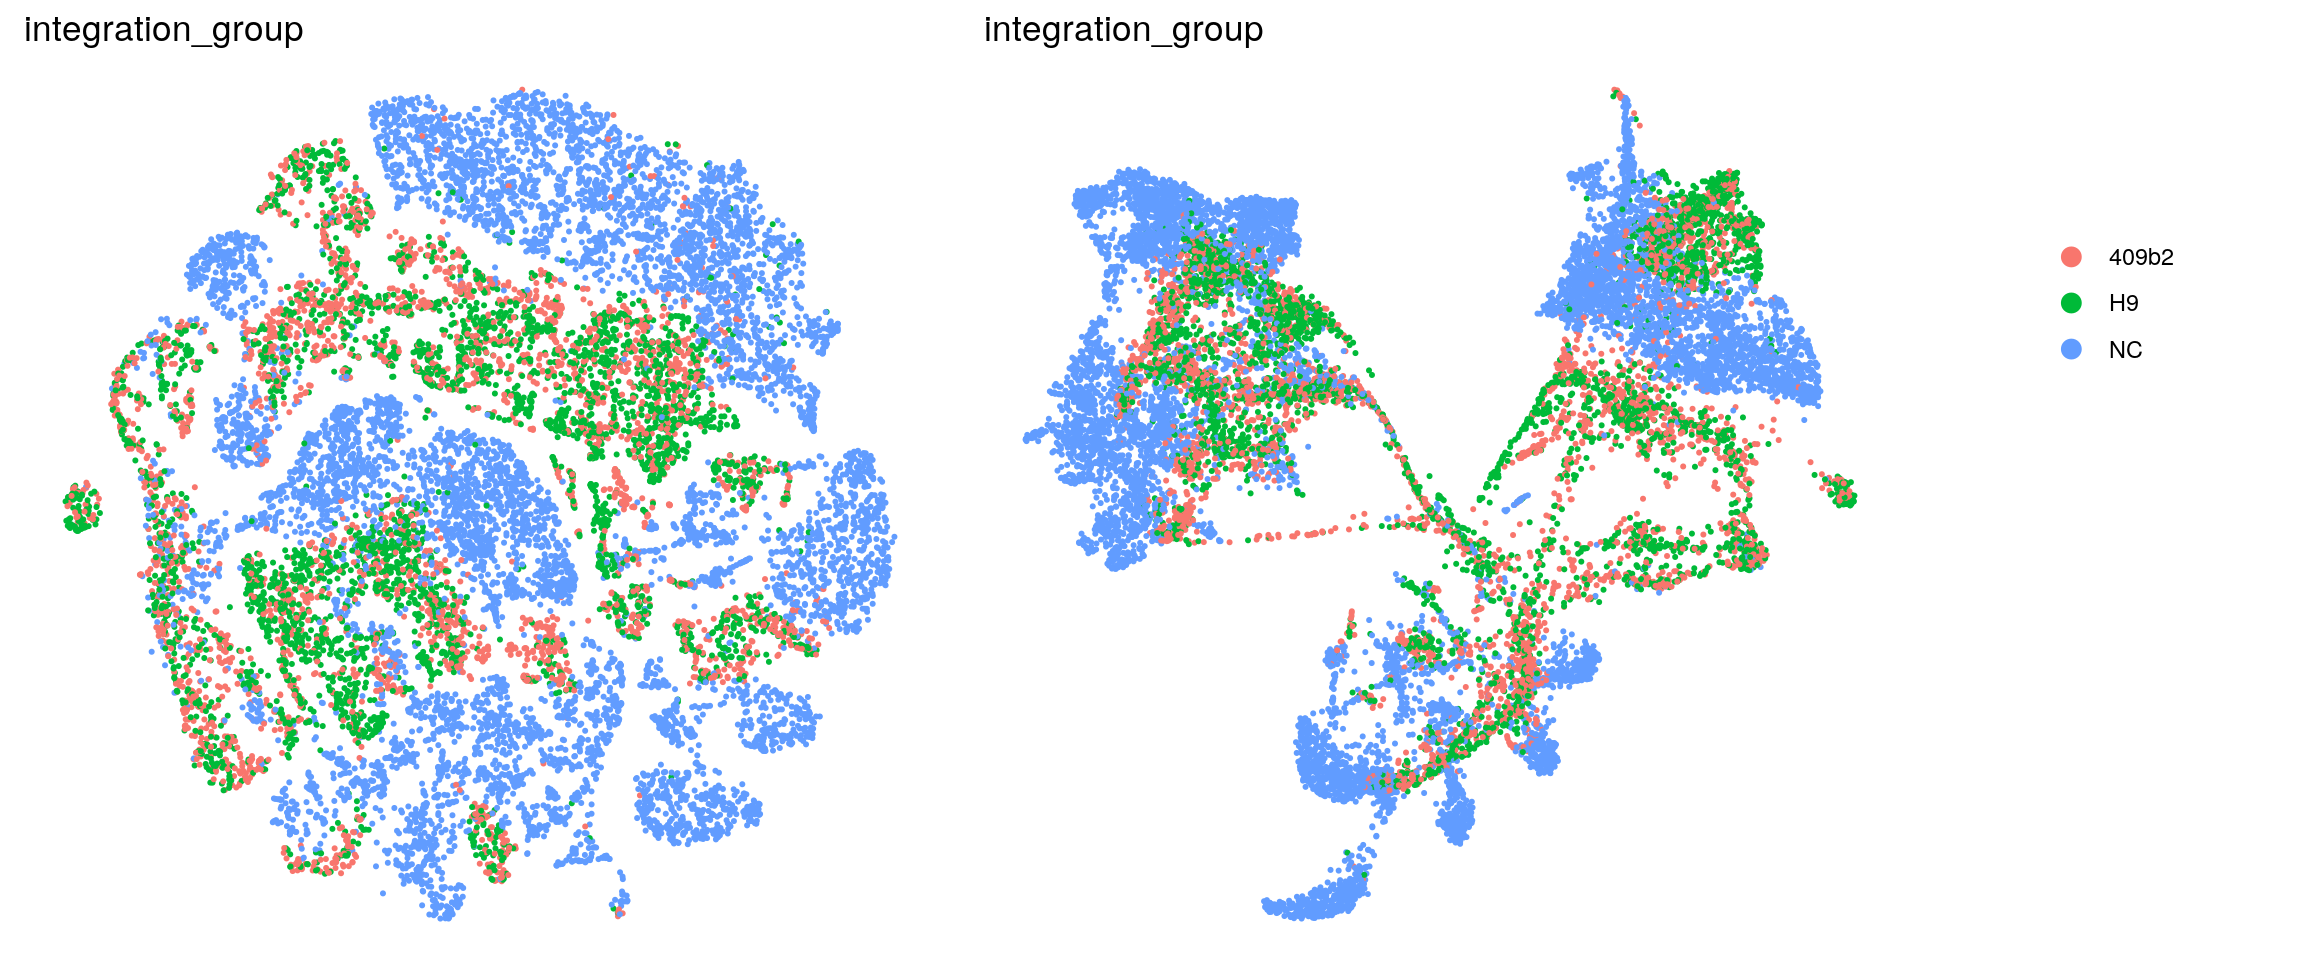
In the manuscript, we want to highlight the timeline of our samples and the organoid samples with shades of two different colors.
so$dataset <- ifelse(so$integration_group != "NC", "organoid", "iCoMoNSC")
cs <- sample(colnames(so), 15e3)
.plot_dr <- function(so, dr, id)
DimPlot(so, cells = cs, group.by = id, reduction = dr, pt.size = 0.4) +
guides(col = guide_legend(nrow = 11,
override.aes = list(size = 3, alpha = 1))) +
theme_void() + theme(aspect.ratio = 1)
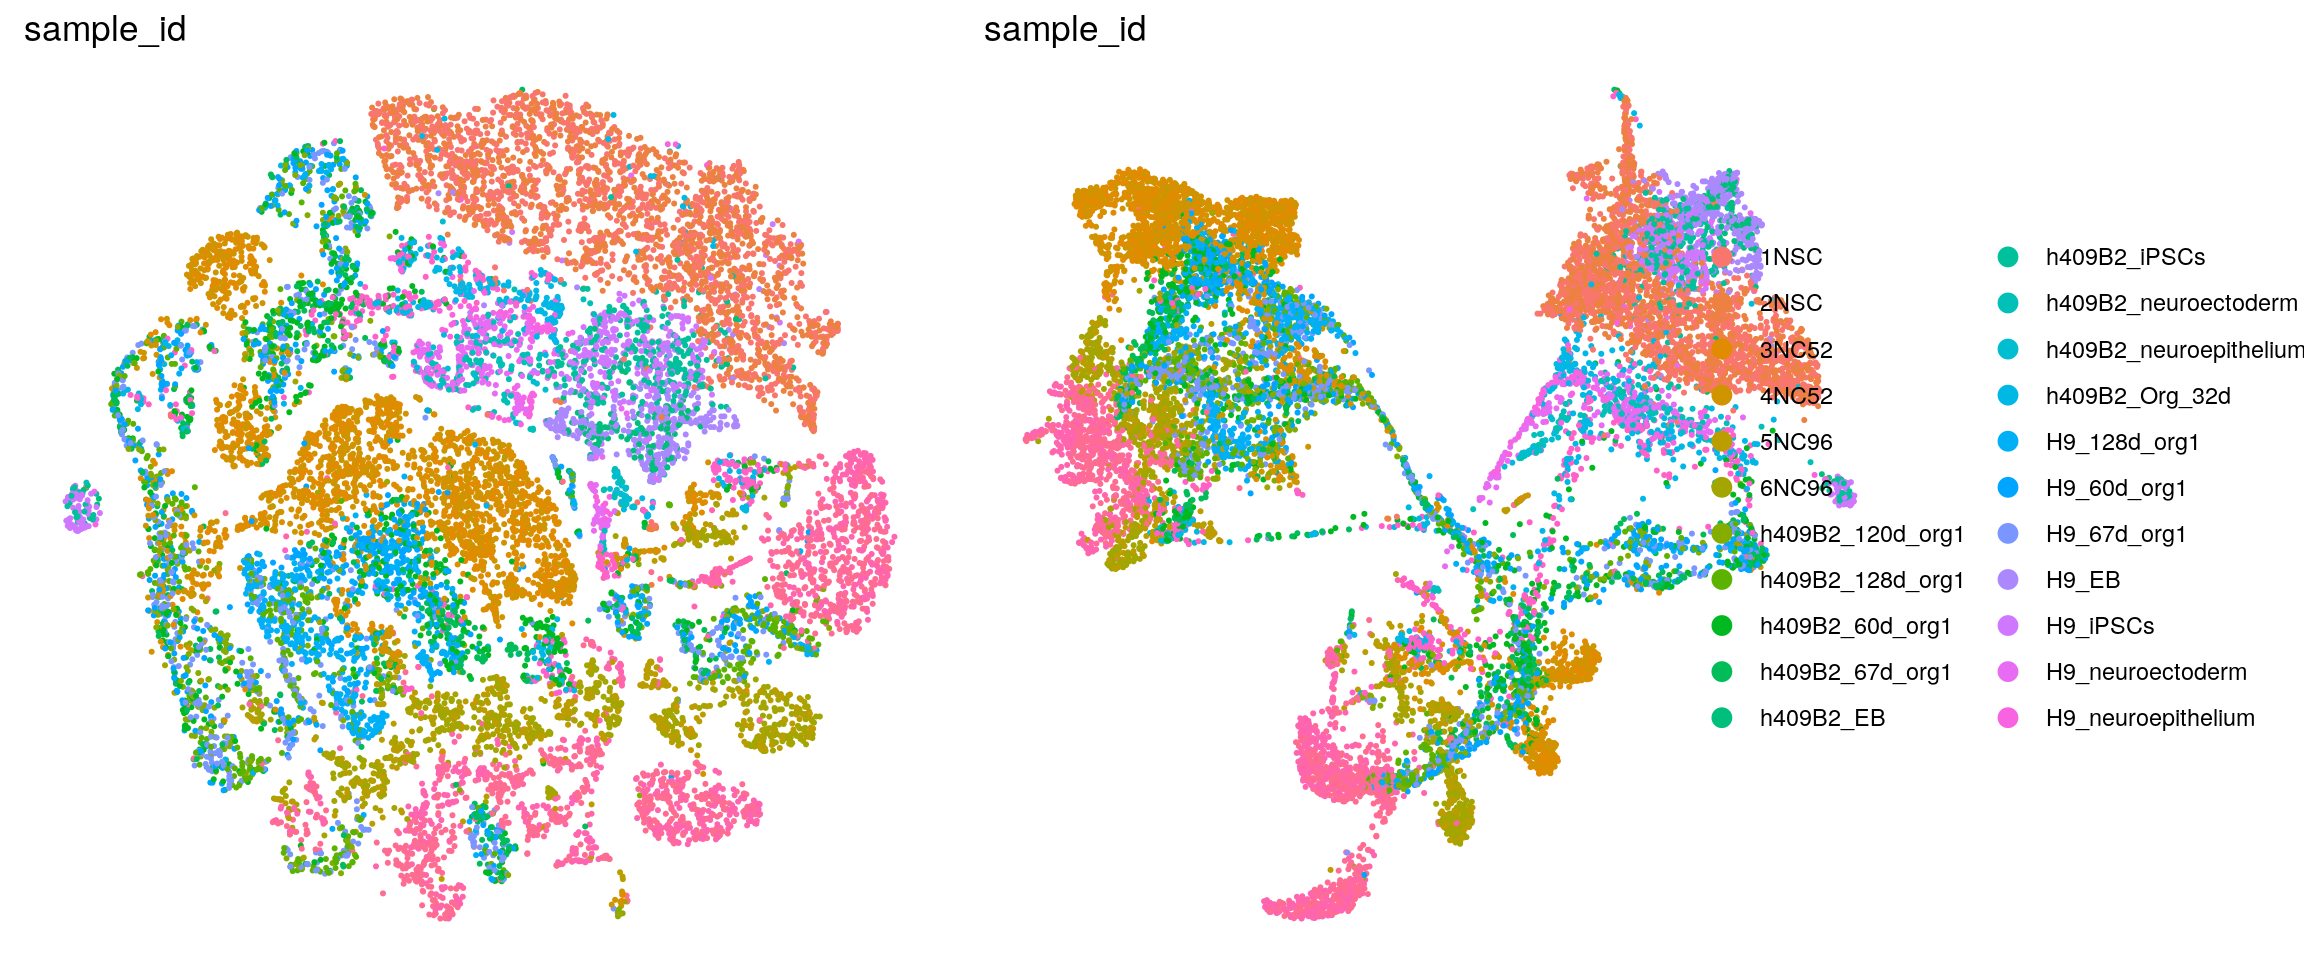
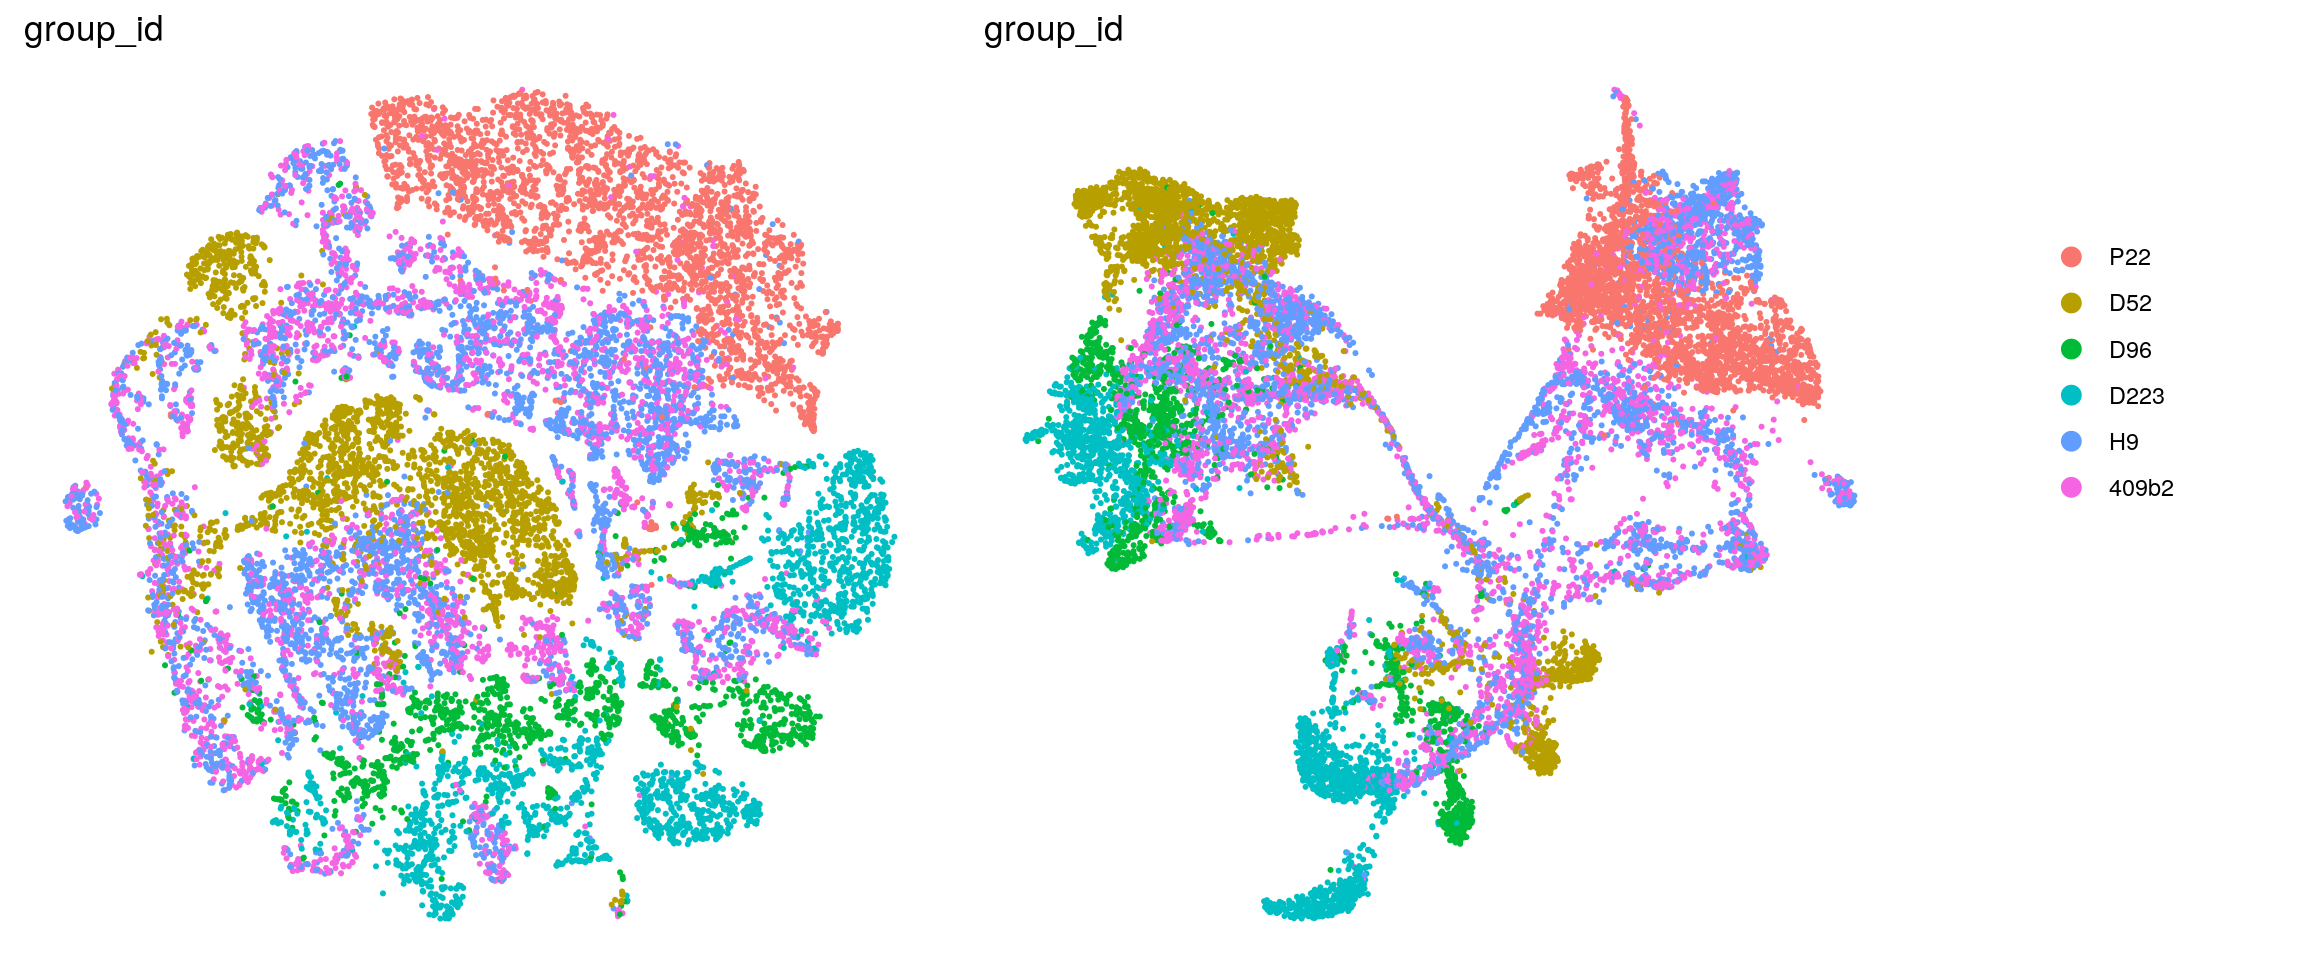
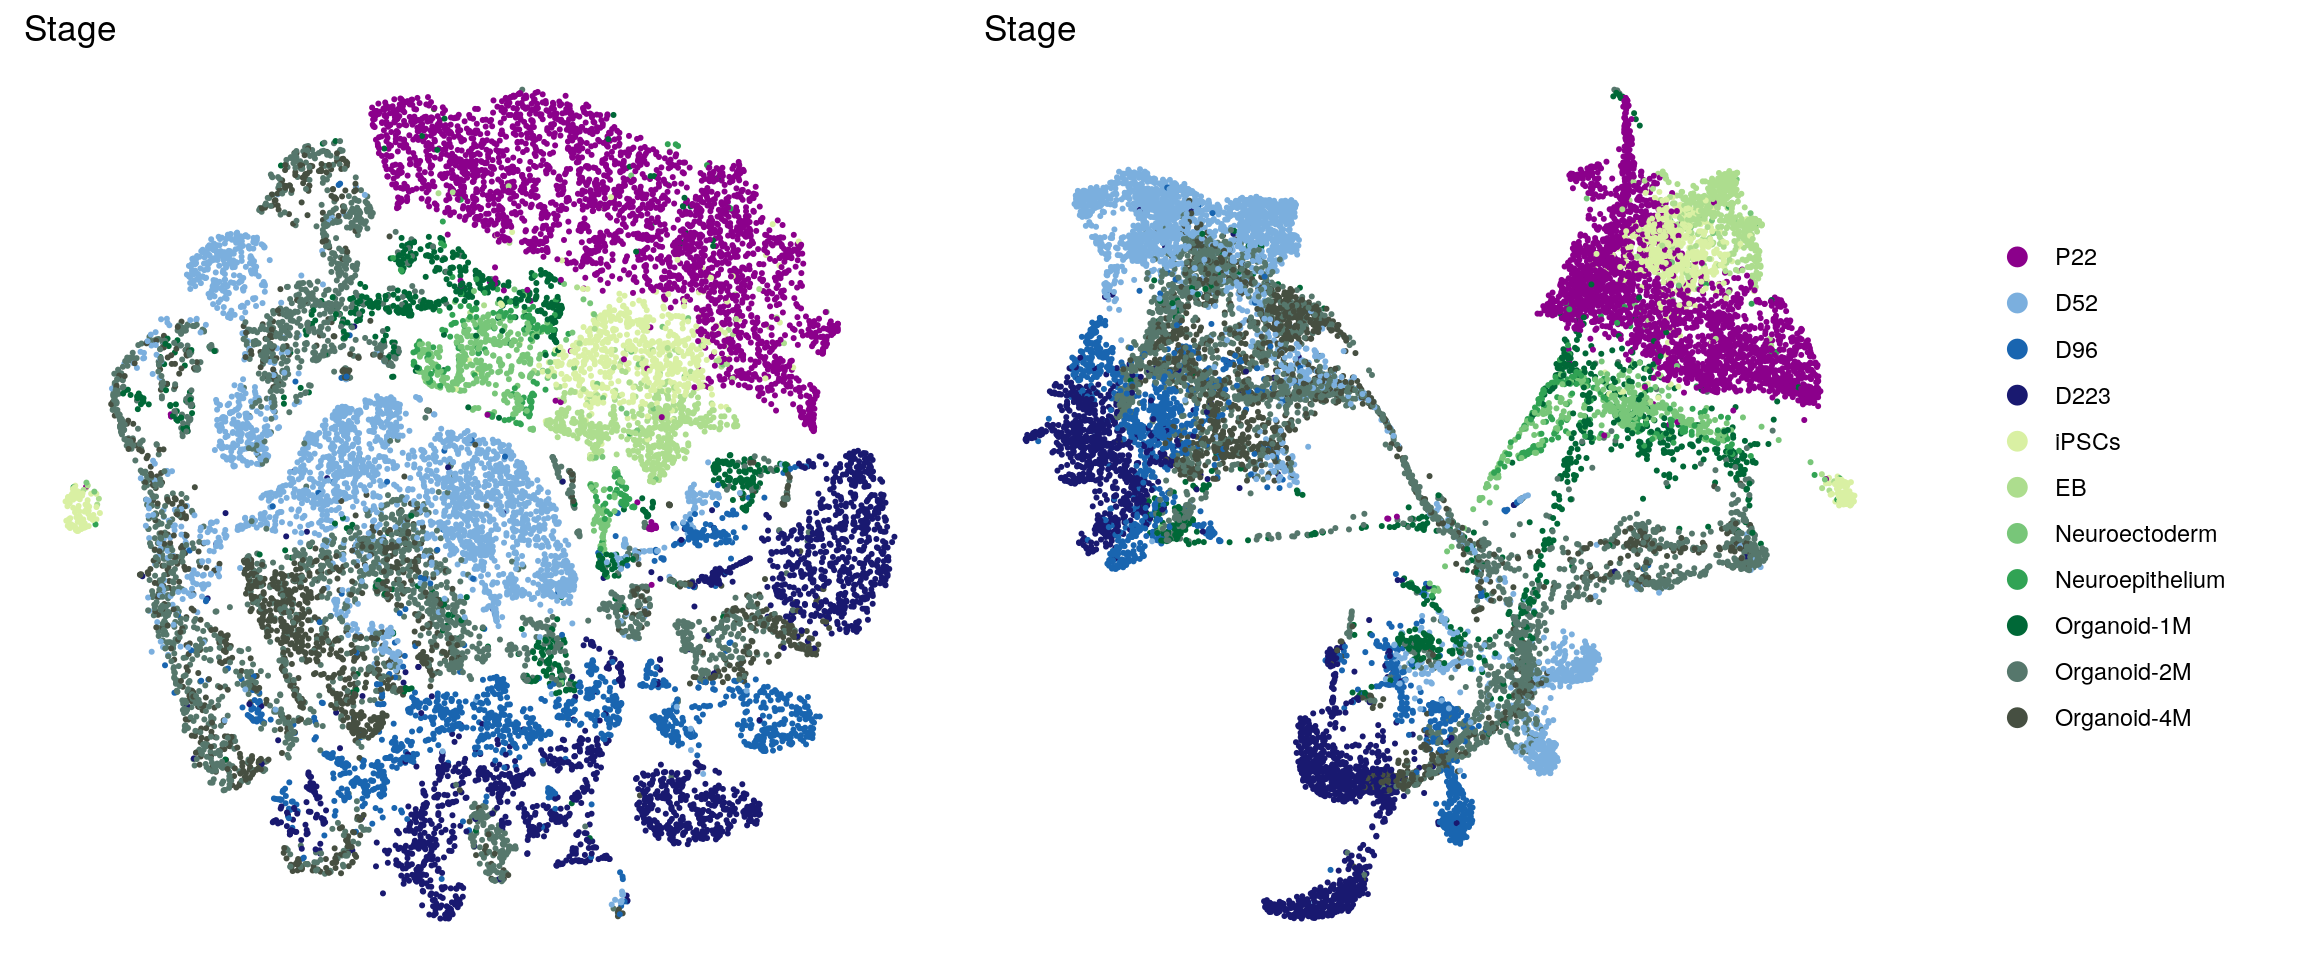
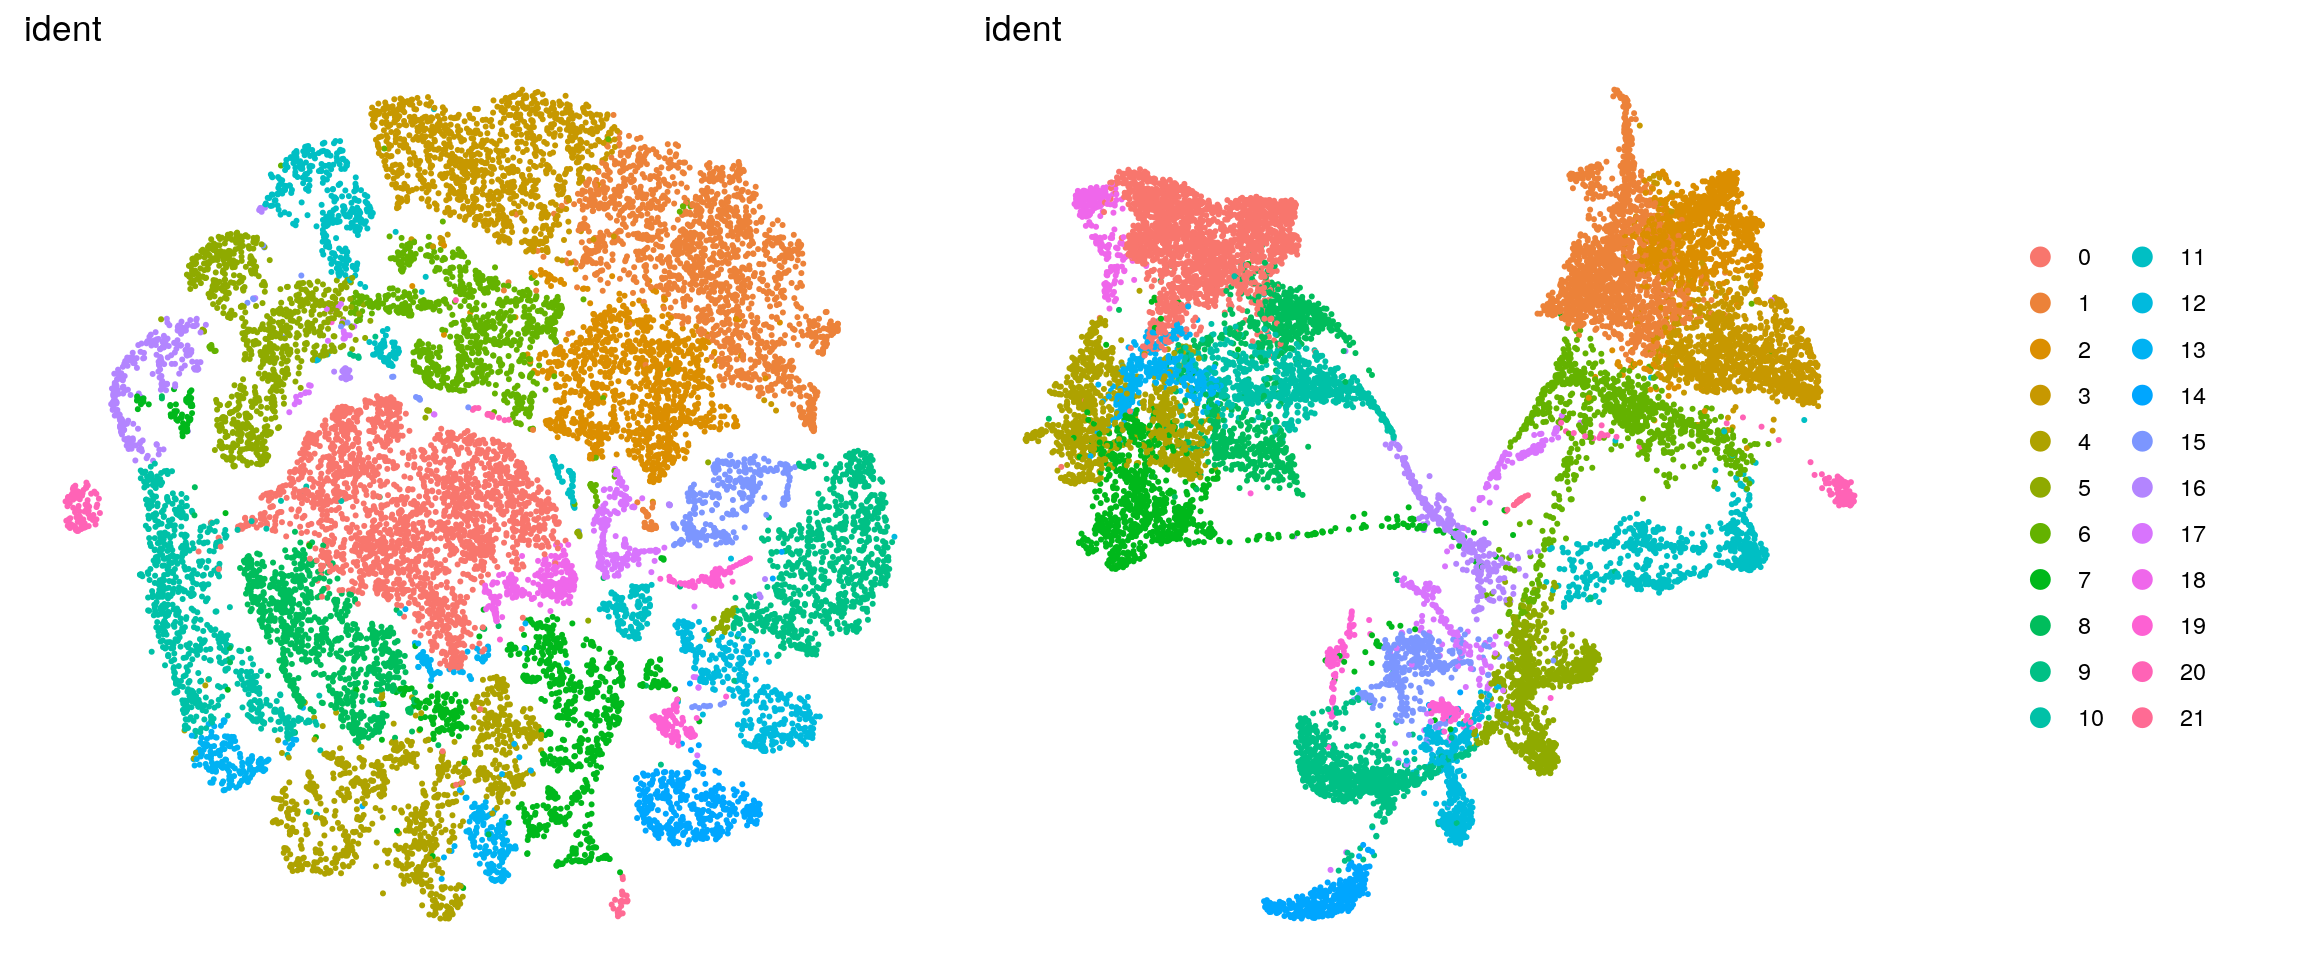
ids <- c("dataset", "integration_group", "sample_id", "group_id", "Stage",
"cl_FullLineage", "cl_LineComp", "PredCellType", "ident",
"cluster_id_before")
for (id in ids) {
cat("### ", id, "\n")
p1 <- .plot_dr(so, "tsne", id)
p2 <- .plot_dr(so, "umap", id)
if (id == "dataset"){
p1 <- p1 + scale_color_manual(values = c("#1965B0",
brewer.pal(n = 6, name = "YlGn")[5]))
p2 <- p2 + scale_color_manual(values = c("#1965B0",
brewer.pal(n = 6, name = "YlGn")[5]))
} else if(id == "Stage") {
p1 <- p1 + scale_color_manual(values = c("darkmagenta", "#7BAFDE", "#1965B0", "midnightblue",
brewer.pal(n = 6, name = "YlGn")[-1], "#56776c", "#464f41"))
p2 <- p2 + scale_color_manual(values = c("darkmagenta", "#7BAFDE", "#1965B0", "midnightblue",
brewer.pal(n = 6, name = "YlGn")[-1], "#56776c", "#464f41"))
}
lgd <- get_legend(p1)
p1 <- p1 + theme(legend.position = "none")
p2 <- p2 + theme(legend.position = "none")
ps <- plot_grid(plotlist = list(p1, p2), nrow = 1)
p <- plot_grid(ps, lgd, nrow = 1, rel_widths = c(1, 0.2))
print(p)
cat("\n\n")
}
Heatmap
We also want to include a heatmap with the contribution of each of the two datasets to each cluster.
sce$dataset <- ifelse(sce$integration_group != "iCoMoNSC", "organoid", "iCoMoNSC")
(n_cells <- table(sce$cluster_id, sce$dataset))
     iCoMoNSC organoid
  0      9355     3811
  1      9548      648
  2       241     6857
  3      6838      172
  4      5809      956
  5      2992     2861
  6        73     5595
  7      4028     1551
  8       732     4694
  9      4260      976
  10     1170     3672
  11      139     3506
  12     1644     1008
  13      209     2308
  14     2358        7
  15     1245     1043
  16      227     1693
  17      292     1134
  18     1410        7
  19      959      168
  20       12      749
  21      169       82
fqs <- prop.table(n_cells, margin = 2)
mat <- round(as.matrix(unclass(fqs))*100, 1)
colfunc <- colorRampPalette(c("ghostwhite", "deepskyblue4"))
Heatmap(mat,
col = colfunc(10),
name = "Percentage\nof cells",
cluster_rows = FALSE,
cluster_columns = FALSE,
row_names_side = "left",
row_title = "cluster ID",
column_title = "cell origin",
column_title_side = "bottom",
rect_gp = gpar(col = "white"),
cell_fun = function(i, j, x, y, width, height, fill)
grid.text(mat[j, i], x = x, y = y,
gp = gpar(col = "black", fontsize = 10)))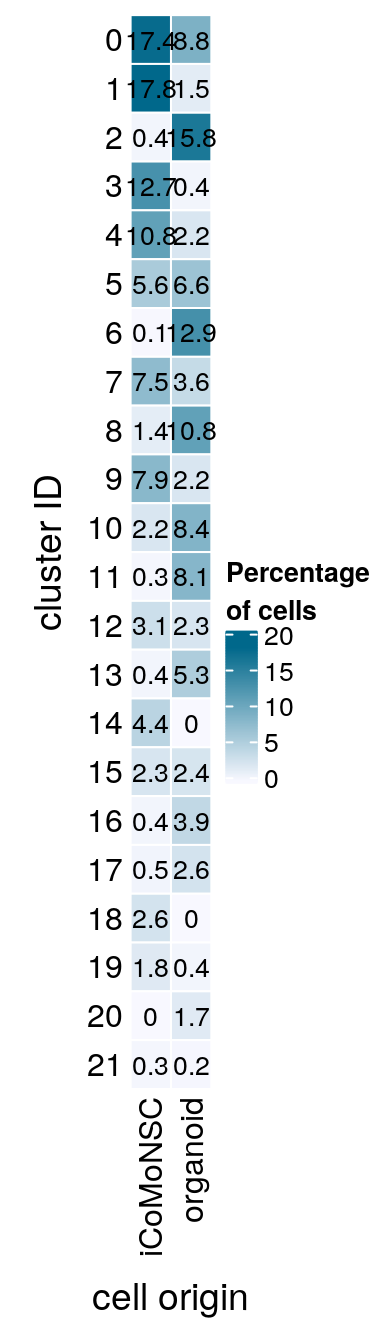
(n_cells <- table(sce$dataset, sce$cluster_id))
              0    1    2    3    4    5    6    7    8    9   10   11   12
  iCoMoNSC 9355 9548  241 6838 5809 2992   73 4028  732 4260 1170  139 1644
  organoid 3811  648 6857  172  956 2861 5595 1551 4694  976 3672 3506 1008

             13   14   15   16   17   18   19   20   21
  iCoMoNSC  209 2358 1245  227  292 1410  959   12  169
  organoid 2308    7 1043 1693 1134    7  168  749   82
fqs <- prop.table(n_cells, margin = 2)
mat <- round(as.matrix(unclass(fqs))*100, 1)
Heatmap(mat,
col = colfunc(10),
name = "Percentage\nof cells",
cluster_rows = FALSE,
cluster_columns = FALSE,
row_names_side = "left",
row_title = "cell origin",
column_title = "cluster ID",
column_title_side = "bottom",
rect_gp = gpar(col = "white"),
cell_fun = function(i, j, x, y, width, height, fill)
grid.text(mat[j, i], x = x, y = y,
gp = gpar(col = "black", fontsize = 10)))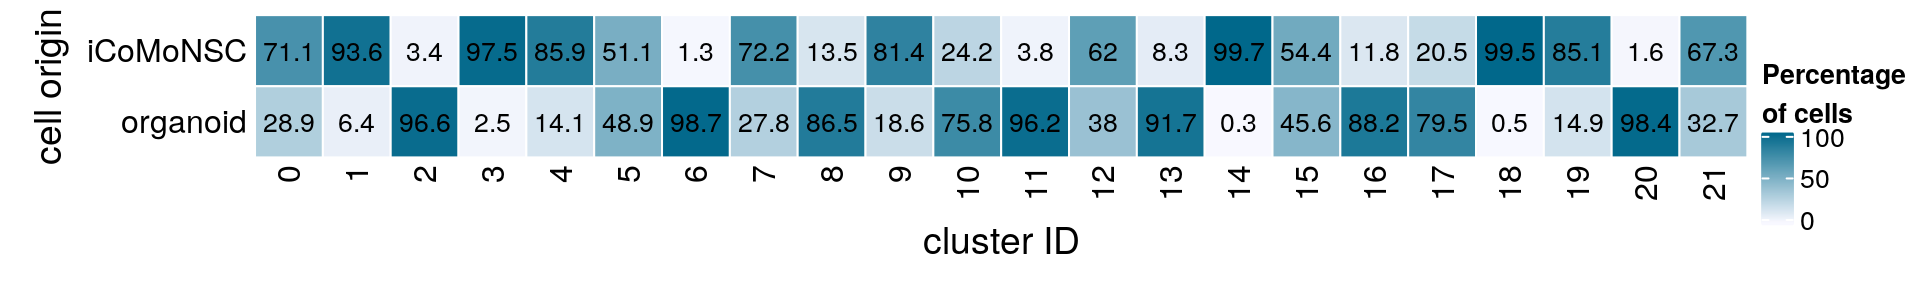
Explore data integration with CellMixS
We use the CellMixS Bioconductor R package to evaluate the data integration and potential batch effects. We test how well the two datasets are mixing or if there are batch effects with the Cellspecific Mixing Score (CMS), a test for batch effects within k-nearest neighbouring cells. A high cms score refers to good mixing, while a low score indicates batch-specific bias. The test considers differences in the number of cells from each batch.
sce$dataset %>% table.
iCoMoNSC organoid
53710 43498 ## using PCA based on integrated and scaled data
sce <- cms(sce, k = 500, group = "dataset", dim_red = "PCA",
n_dim = 10, unbalanced = FALSE,
BPPARAM = MulticoreParam(workers = 15))
head(colData(sce)[,c("cms_smooth", "cms")])DataFrame with 6 rows and 2 columns
cms_smooth cms
<numeric> <numeric>
time_line_AAACCCAAGGTTATAG-1.1NSC 0.1282384 6.30595e-01
time_line_AAACCCACATTGACCA-1.1NSC 0.0540260 4.76095e-03
time_line_AAACCCAGTAGCGCCT-1.1NSC 0.0475450 4.95100e-01
time_line_AAACCCAGTATTTCTC-1.1NSC 0.0559921 1.29355e-03
time_line_AAACCCAGTTACACTG-1.1NSC 0.1581564 1.06845e-01
time_line_AAACGAAAGACAGCGT-1.1NSC 0.1586432 3.86460e-10## cms histogram
visHist(sce)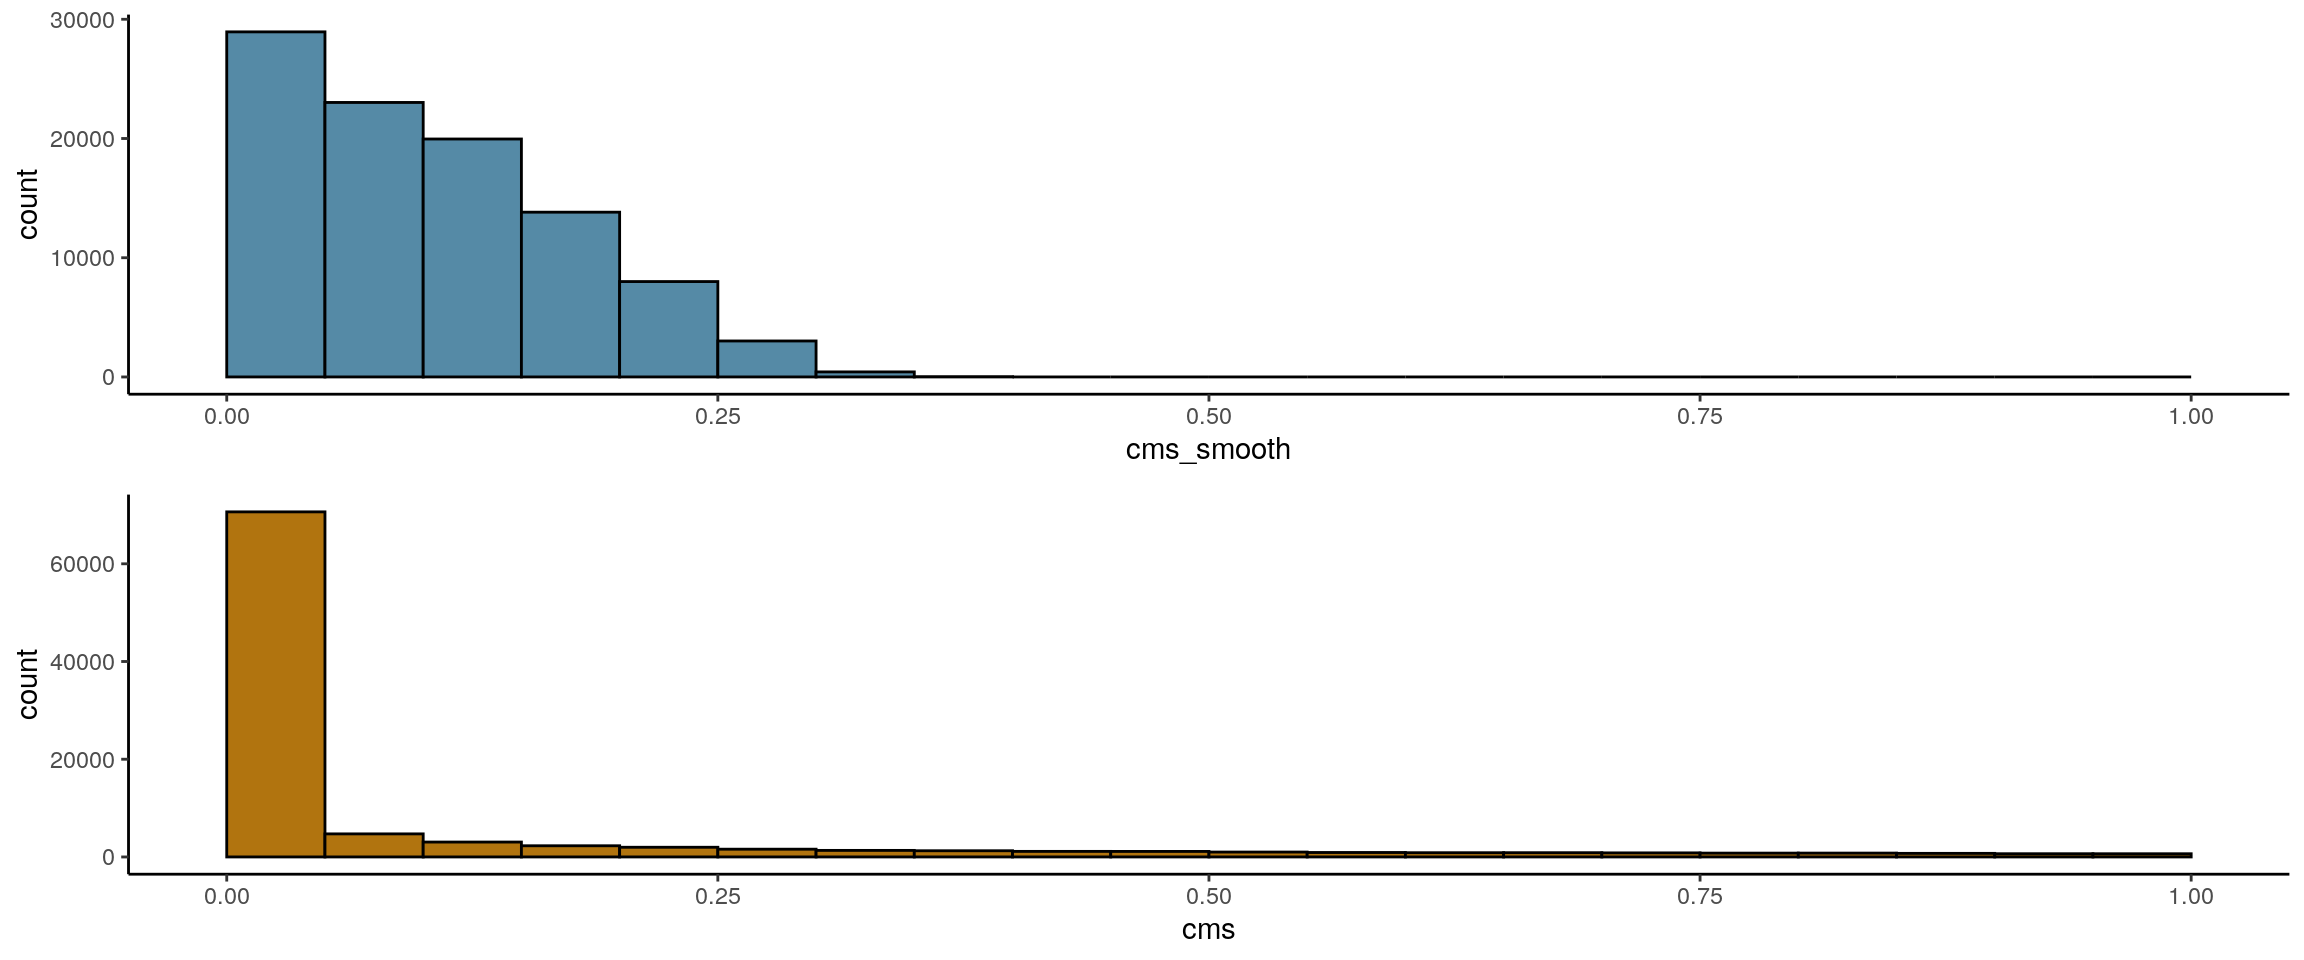
p1 <- visMetric(sce, metric_var = "cms_smooth", dim_red = "UMAP") +
  theme_void() + theme(aspect.ratio = 1)
p2 <- visMetric(sce, metric_var = "cms", dim_red = "UMAP") +
  theme_void() + theme(aspect.ratio = 1)
plot_grid(p1, p2)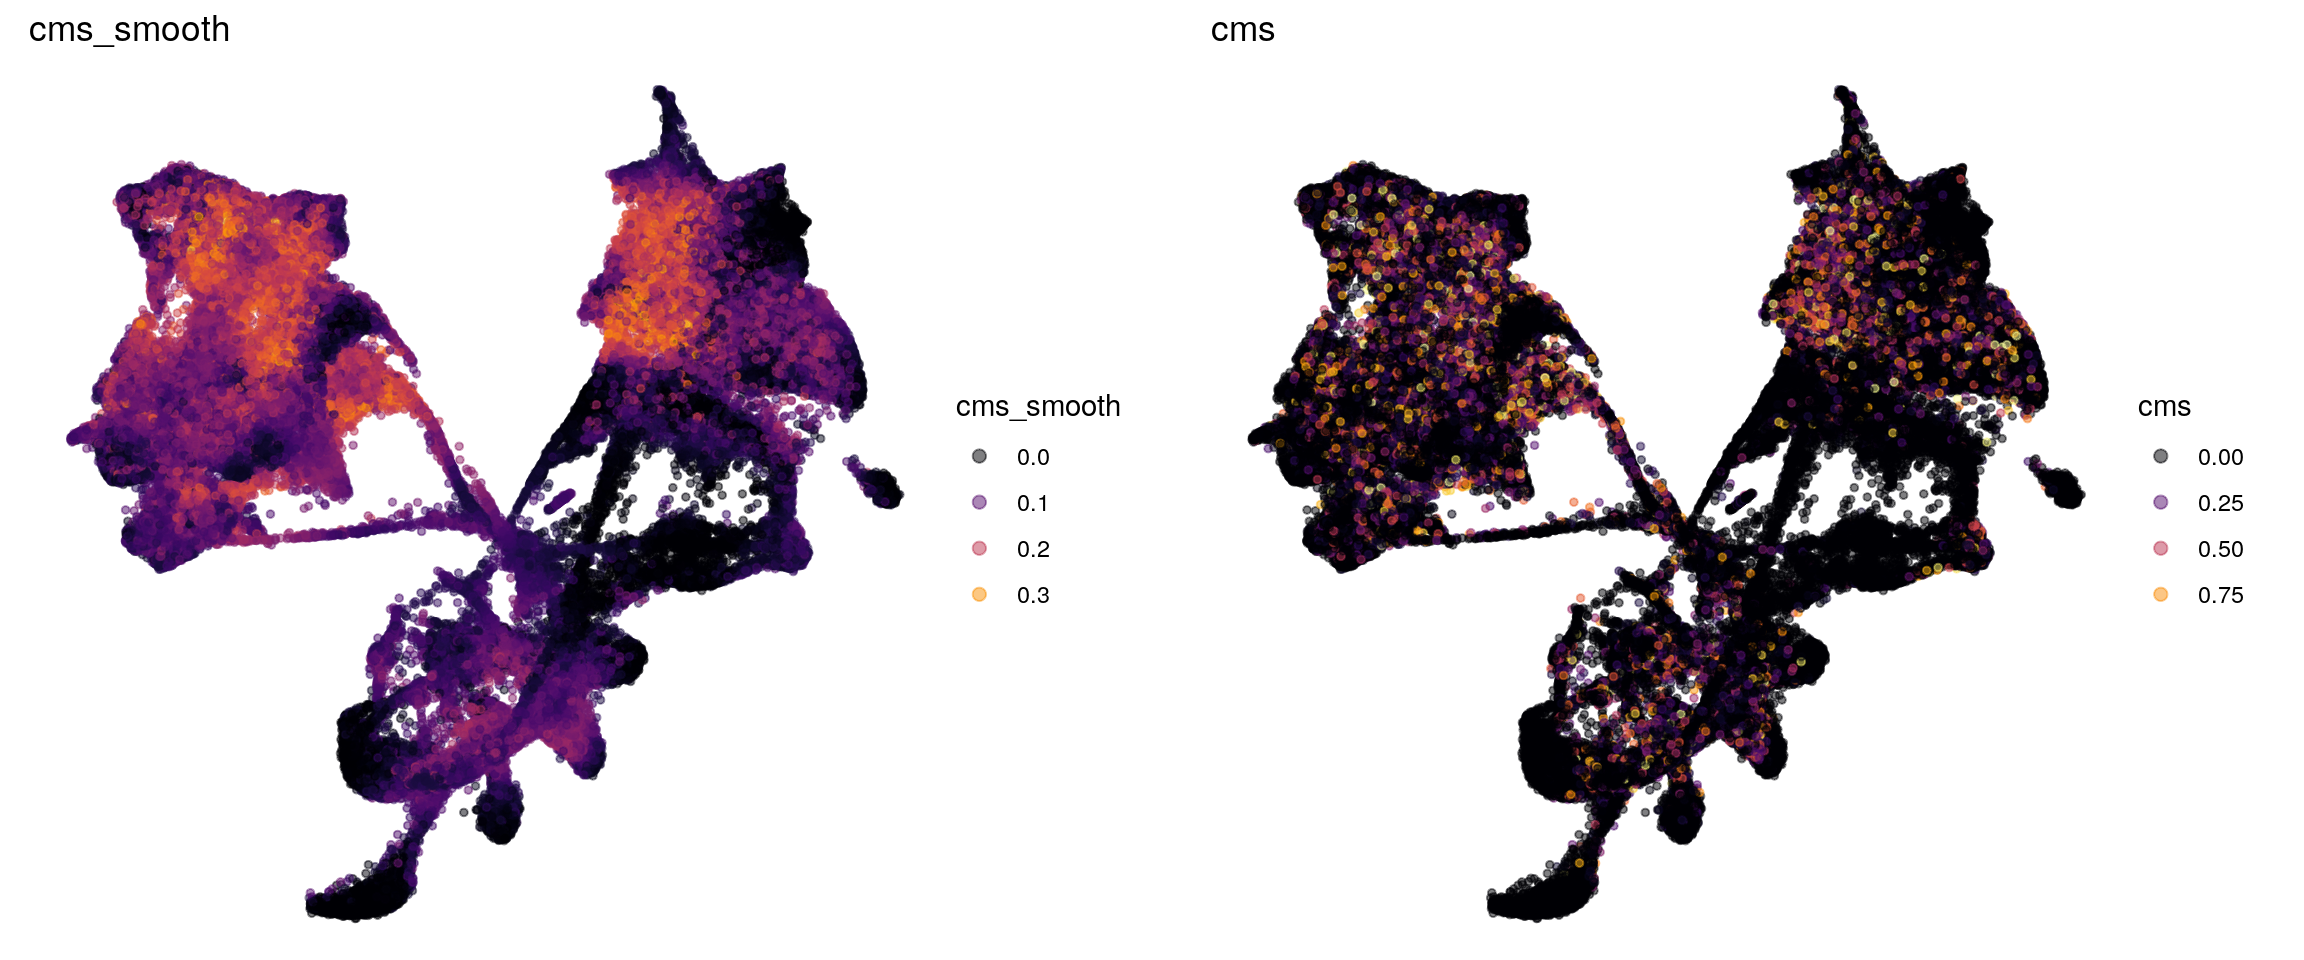
## score distribution per cluster
p1 <- visCluster(sce, metric_var = "cms", cluster_var = "cluster_id") +
  scale_fill_hue() +
  scale_y_discrete(limits = rev(unique(sort(sce$cluster_id))))
p2 <- visCluster(sce, metric_var = "cms_smooth", cluster_var = "cluster_id") +
  scale_fill_hue() +
  scale_y_discrete(limits = rev(unique(sort(sce$cluster_id))))
plot_grid(p1, p2)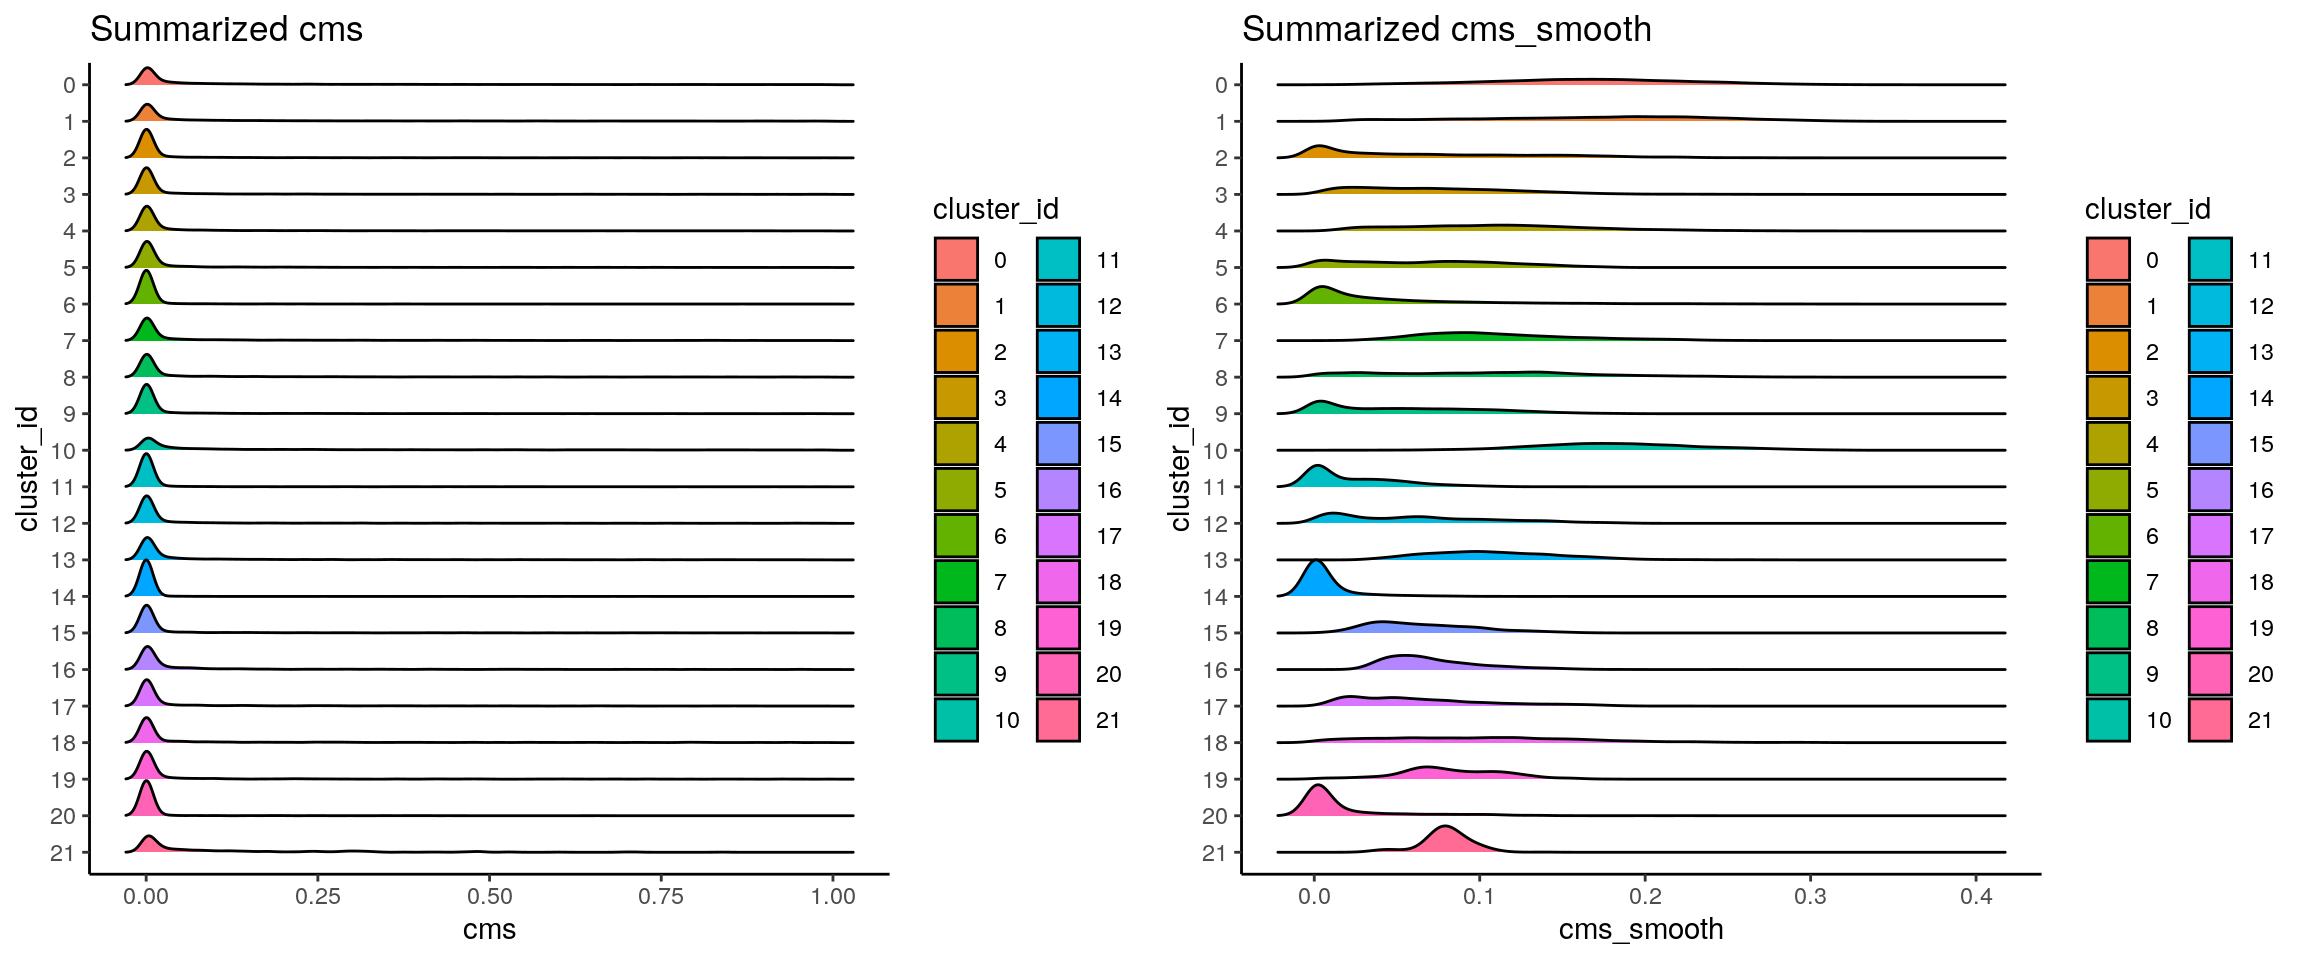
sessionInfo()R version 4.0.5 (2021-03-31)
Platform: x86_64-pc-linux-gnu (64-bit)
Running under: Ubuntu 18.04.5 LTS
Matrix products: default
BLAS: /usr/local/R/R-4.0.5/lib/libRblas.so
LAPACK: /usr/local/R/R-4.0.5/lib/libRlapack.so
locale:
[1] LC_CTYPE=en_US.UTF-8 LC_NUMERIC=C
[3] LC_TIME=en_US.UTF-8 LC_COLLATE=en_US.UTF-8
[5] LC_MONETARY=en_US.UTF-8 LC_MESSAGES=en_US.UTF-8
[7] LC_PAPER=en_US.UTF-8 LC_NAME=C
[9] LC_ADDRESS=C LC_TELEPHONE=C
[11] LC_MEASUREMENT=en_US.UTF-8 LC_IDENTIFICATION=C
attached base packages:
[1] parallel stats4 grid stats graphics grDevices utils
[8] datasets methods base
other attached packages:
[1] BiocParallel_1.22.0 CellMixS_1.4.2
[3] kSamples_1.2-9 SuppDists_1.1-9.5
[5] SingleCellExperiment_1.10.1 SummarizedExperiment_1.18.1
[7] DelayedArray_0.14.0 matrixStats_0.56.0
[9] Biobase_2.48.0 GenomicRanges_1.40.0
[11] GenomeInfoDb_1.24.2 IRanges_2.22.2
[13] S4Vectors_0.26.1 BiocGenerics_0.34.0
[15] SeuratObject_4.0.1 Seurat_4.0.1
[17] RColorBrewer_1.1-2 muscat_1.2.1
[19] dplyr_1.0.2 ggplot2_3.3.2
[21] cowplot_1.0.0 ComplexHeatmap_2.4.2
[23] workflowr_1.6.2
loaded via a namespace (and not attached):
[1] reticulate_1.16 tidyselect_1.1.0
[3] lme4_1.1-23 RSQLite_2.2.0
[5] AnnotationDbi_1.50.1 htmlwidgets_1.5.1
[7] Rtsne_0.15 munsell_0.5.0
[9] codetools_0.2-16 ica_1.0-2
[11] statmod_1.4.34 future_1.17.0
[13] miniUI_0.1.1.1 withr_2.4.1
[15] colorspace_1.4-1 knitr_1.29
[17] ROCR_1.0-11 tensor_1.5
[19] listenv_0.8.0 labeling_0.3
[21] git2r_0.27.1 GenomeInfoDbData_1.2.3
[23] polyclip_1.10-0 farver_2.0.3
[25] bit64_0.9-7 glmmTMB_1.0.2.1
[27] rprojroot_1.3-2 vctrs_0.3.4
[29] generics_0.0.2 xfun_0.15
[31] R6_2.4.1 doParallel_1.0.15
[33] ggbeeswarm_0.6.0 clue_0.3-57
[35] rsvd_1.0.3 locfit_1.5-9.4
[37] bitops_1.0-6 spatstat.utils_2.1-0
[39] cachem_1.0.4 promises_1.1.1
[41] scales_1.1.1 beeswarm_0.2.3
[43] gtable_0.3.0 globals_0.12.5
[45] goftest_1.2-2 rlang_0.4.10
[47] genefilter_1.70.0 GlobalOptions_0.1.2
[49] splines_4.0.5 TMB_1.7.16
[51] lazyeval_0.2.2 spatstat.geom_2.1-0
[53] abind_1.4-5 yaml_2.2.1
[55] reshape2_1.4.4 backports_1.1.9
[57] httpuv_1.5.4 tools_4.0.5
[59] ellipsis_0.3.1 gplots_3.0.4
[61] spatstat.core_2.1-2 ggridges_0.5.2
[63] Rcpp_1.0.5 plyr_1.8.6
[65] progress_1.2.2 zlibbioc_1.34.0
[67] purrr_0.3.4 RCurl_1.98-1.3
[69] prettyunits_1.1.1 rpart_4.1-15
[71] deldir_0.2-10 pbapply_1.4-2
[73] GetoptLong_1.0.1 viridis_0.5.1
[75] zoo_1.8-8 ggrepel_0.8.2
[77] cluster_2.1.0 colorRamps_2.3
[79] fs_1.5.0 variancePartition_1.18.2
[81] magrittr_1.5 data.table_1.12.8
[83] scattermore_0.7 lmerTest_3.1-2
[85] circlize_0.4.10 lmtest_0.9-37
[87] RANN_2.6.1 whisker_0.4
[89] fitdistrplus_1.1-1 hms_0.5.3
[91] patchwork_1.0.1 mime_0.9
[93] evaluate_0.14 xtable_1.8-4
[95] pbkrtest_0.4-8.6 XML_3.99-0.4
[97] gridExtra_2.3 shape_1.4.4
[99] compiler_4.0.5 scater_1.16.2
[101] tibble_3.0.3 KernSmooth_2.23-17
[103] crayon_1.3.4 minqa_1.2.4
[105] htmltools_0.5.0 mgcv_1.8-31
[107] later_1.1.0.1 tidyr_1.1.0
[109] geneplotter_1.66.0 DBI_1.1.0
[111] MASS_7.3-51.6 rappdirs_0.3.1
[113] boot_1.3-25 Matrix_1.3-3
[115] gdata_2.18.0 igraph_1.2.5
[117] pkgconfig_2.0.3 numDeriv_2016.8-1.1
[119] spatstat.sparse_2.0-0 plotly_4.9.2.1
[121] foreach_1.5.0 annotate_1.66.0
[123] vipor_0.4.5 blme_1.0-4
[125] XVector_0.28.0 stringr_1.4.0
[127] digest_0.6.25 sctransform_0.3.2
[129] RcppAnnoy_0.0.18 spatstat.data_2.1-0
[131] rmarkdown_2.3 leiden_0.3.3
[133] uwot_0.1.10 edgeR_3.30.3
[135] DelayedMatrixStats_1.10.1 shiny_1.5.0
[137] gtools_3.8.2 rjson_0.2.20
[139] nloptr_1.2.2.2 lifecycle_1.0.0
[141] nlme_3.1-148 jsonlite_1.7.2
[143] BiocNeighbors_1.6.0 viridisLite_0.3.0
[145] limma_3.44.3 pillar_1.4.6
[147] lattice_0.20-41 fastmap_1.0.1
[149] httr_1.4.2 survival_3.2-3
[151] glue_1.4.2 png_0.1-7
[153] iterators_1.0.12 bit_1.1-15.2
[155] stringi_1.4.6 blob_1.2.1
[157] DESeq2_1.28.1 BiocSingular_1.4.0
[159] caTools_1.18.0 memoise_2.0.0
[161] irlba_2.3.3 future.apply_1.6.0