Clustering of TDP-HA experiment and the D96 samples
Katharina Hembach
28/01/2021
Last updated: 2021-03-31
Checks: 7 0
Knit directory: neural_scRNAseq/
This reproducible R Markdown analysis was created with workflowr (version 1.6.2). The Checks tab describes the reproducibility checks that were applied when the results were created. The Past versions tab lists the development history.
Great! Since the R Markdown file has been committed to the Git repository, you know the exact version of the code that produced these results.
Great job! The global environment was empty. Objects defined in the global environment can affect the analysis in your R Markdown file in unknown ways. For reproduciblity it's best to always run the code in an empty environment.
The command set.seed(20200522) was run prior to running the code in the R Markdown file. Setting a seed ensures that any results that rely on randomness, e.g. subsampling or permutations, are reproducible.
Great job! Recording the operating system, R version, and package versions is critical for reproducibility.
Nice! There were no cached chunks for this analysis, so you can be confident that you successfully produced the results during this run.
Great job! Using relative paths to the files within your workflowr project makes it easier to run your code on other machines.
Great! You are using Git for version control. Tracking code development and connecting the code version to the results is critical for reproducibility.
The results in this page were generated with repository version f7b27e3. See the Past versions tab to see a history of the changes made to the R Markdown and HTML files.
Note that you need to be careful to ensure that all relevant files for the analysis have been committed to Git prior to generating the results (you can use wflow_publish or wflow_git_commit). workflowr only checks the R Markdown file, but you know if there are other scripts or data files that it depends on. Below is the status of the Git repository when the results were generated:
Ignored files:
    Ignored:    .DS_Store
    Ignored:    .Rhistory
    Ignored:    .Rproj.user/
    Ignored:    ._.DS_Store
    Ignored:    ._Filtered.pdf
    Ignored:    ._Rplots.pdf
    Ignored:    ._Unfiltered.pdf
    Ignored:    .__workflowr.yml
    Ignored:    ._coverage.pdf
    Ignored:    ._coverage_sashimi.pdf
    Ignored:    ._coverage_sashimi.png
    Ignored:    ._neural_scRNAseq.Rproj
    Ignored:    ._pbDS_cell_level.pdf
    Ignored:    ._pbDS_top_expr_umap.pdf
    Ignored:    ._pbDS_upset.pdf
    Ignored:    ._sashimi.pdf
    Ignored:    ._stmn2.pdf
    Ignored:    ._tdp.pdf
    Ignored:    analysis/.DS_Store
    Ignored:    analysis/.Rhistory
    Ignored:    analysis/._.DS_Store
    Ignored:    analysis/._01-preprocessing.Rmd
    Ignored:    analysis/._01-preprocessing.html
    Ignored:    analysis/._02.1-SampleQC.Rmd
    Ignored:    analysis/._03-filtering.Rmd
    Ignored:    analysis/._04-clustering.Rmd
    Ignored:    analysis/._04-clustering.knit.md
    Ignored:    analysis/._04.1-cell_cycle.Rmd
    Ignored:    analysis/._05-annotation.Rmd
    Ignored:    analysis/._Lam-0-NSC_no_integration.Rmd
    Ignored:    analysis/._Lam-01-NSC_integration.Rmd
    Ignored:    analysis/._Lam-02-NSC_annotation.Rmd
    Ignored:    analysis/._NSC-1-clustering.Rmd
    Ignored:    analysis/._NSC-2-annotation.Rmd
    Ignored:    analysis/.__site.yml
    Ignored:    analysis/._additional_filtering.Rmd
    Ignored:    analysis/._additional_filtering_clustering.Rmd
    Ignored:    analysis/._index.Rmd
    Ignored:    analysis/._organoid-01-1-qualtiy-control.Rmd
    Ignored:    analysis/._organoid-01-clustering.Rmd
    Ignored:    analysis/._organoid-02-integration.Rmd
    Ignored:    analysis/._organoid-03-cluster_analysis.Rmd
    Ignored:    analysis/._organoid-04-group_integration.Rmd
    Ignored:    analysis/._organoid-04-stage_integration.Rmd
    Ignored:    analysis/._organoid-05-group_integration_cluster_analysis.Rmd
    Ignored:    analysis/._organoid-05-stage_integration_cluster_analysis.Rmd
    Ignored:    analysis/._organoid-06-1-prepare-sce.Rmd
    Ignored:    analysis/._organoid-06-conos-analysis-Seurat.Rmd
    Ignored:    analysis/._organoid-06-conos-analysis-function.Rmd
    Ignored:    analysis/._organoid-06-conos-analysis.Rmd
    Ignored:    analysis/._organoid-06-group-integration-conos-analysis.Rmd
    Ignored:    analysis/._organoid-07-conos-visualization.Rmd
    Ignored:    analysis/._organoid-07-group-integration-conos-visualization.Rmd
    Ignored:    analysis/._organoid-08-conos-comparison.Rmd
    Ignored:    analysis/._organoid-0x-sample_integration.Rmd
    Ignored:    analysis/01-preprocessing_cache/
    Ignored:    analysis/02-1-SampleQC_cache/
    Ignored:    analysis/02-quality_control_cache/
    Ignored:    analysis/02.1-SampleQC_cache/
    Ignored:    analysis/03-filtering_cache/
    Ignored:    analysis/04-clustering_cache/
    Ignored:    analysis/04.1-cell_cycle_cache/
    Ignored:    analysis/05-annotation_cache/
    Ignored:    analysis/06-clustering-all-timepoints_cache/
    Ignored:    analysis/07-cluster-analysis-all-timepoints_cache/
    Ignored:    analysis/Lam-01-NSC_integration_cache/
    Ignored:    analysis/Lam-02-NSC_annotation_cache/
    Ignored:    analysis/NSC-1-clustering_cache/
    Ignored:    analysis/NSC-2-annotation_cache/
    Ignored:    analysis/TDP-01-preprocessing_cache/
    Ignored:    analysis/TDP-02-quality_control_cache/
    Ignored:    analysis/TDP-03-filtering_cache/
    Ignored:    analysis/TDP-04-clustering_cache/
    Ignored:    analysis/TDP-05-00-filtering-plasmid-QC_cache/
    Ignored:    analysis/TDP-05-plasmid_expression_cache/
    Ignored:    analysis/TDP-06-cluster_analysis_cache/
    Ignored:    analysis/TDP-07-01-STMN2_expression_cache/
    Ignored:    analysis/TDP-07-cluster_12_cache/
    Ignored:    analysis/TDP-08-01-HA-D96-expression-changes_cache/
    Ignored:    analysis/TDP-08-clustering-timeline-HA_cache/
    Ignored:    analysis/additional_filtering_cache/
    Ignored:    analysis/additional_filtering_clustering_cache/
    Ignored:    analysis/organoid-01-1-qualtiy-control_cache/
    Ignored:    analysis/organoid-01-clustering_cache/
    Ignored:    analysis/organoid-02-integration_cache/
    Ignored:    analysis/organoid-03-cluster_analysis_cache/
    Ignored:    analysis/organoid-04-group_integration_cache/
    Ignored:    analysis/organoid-04-stage_integration_cache/
    Ignored:    analysis/organoid-05-group_integration_cluster_analysis_cache/
    Ignored:    analysis/organoid-05-stage_integration_cluster_analysis_cache/
    Ignored:    analysis/organoid-06-conos-analysis_cache/
    Ignored:    analysis/organoid-06-conos-analysis_test_cache/
    Ignored:    analysis/organoid-06-group-integration-conos-analysis_cache/
    Ignored:    analysis/organoid-07-conos-visualization_cache/
    Ignored:    analysis/organoid-07-group-integration-conos-visualization_cache/
    Ignored:    analysis/organoid-08-conos-comparison_cache/
    Ignored:    analysis/organoid-0x-sample_integration_cache/
    Ignored:    analysis/sample5_QC_cache/
    Ignored:    analysis/timepoints-01-organoid-integration_cache/
    Ignored:    data/.DS_Store
    Ignored:    data/._.DS_Store
    Ignored:    data/._.smbdeleteAAA17ed8b4b
    Ignored:    data/._Lam_figure2_markers.R
    Ignored:    data/._Reactive_astrocytes_markers.xlsx
    Ignored:    data/._known_NSC_markers.R
    Ignored:    data/._known_cell_type_markers.R
    Ignored:    data/._metadata.csv
    Ignored:    data/._virus_cell_tropism_markers.R
    Ignored:    data/._~$Reactive_astrocytes_markers.xlsx
    Ignored:    data/data_sushi/
    Ignored:    data/filtered_feature_matrices/
    Ignored:    output/.DS_Store
    Ignored:    output/._.DS_Store
    Ignored:    output/._NSC_cluster2_marker_genes.txt
    Ignored:    output/._TDP-06-no_integration_cluster12_marker_genes.txt
    Ignored:    output/._TDP-06-no_integration_cluster13_marker_genes.txt
    Ignored:    output/._organoid_integration_cluster1_marker_genes.txt
    Ignored:    output/Lam-01-clustering.rds
    Ignored:    output/NSC_1_clustering.rds
    Ignored:    output/NSC_cluster1_marker_genes.txt
    Ignored:    output/NSC_cluster2_marker_genes.txt
    Ignored:    output/NSC_cluster3_marker_genes.txt
    Ignored:    output/NSC_cluster4_marker_genes.txt
    Ignored:    output/NSC_cluster5_marker_genes.txt
    Ignored:    output/NSC_cluster6_marker_genes.txt
    Ignored:    output/NSC_cluster7_marker_genes.txt
    Ignored:    output/TDP-06-no_integration_cluster0_marker_genes.txt
    Ignored:    output/TDP-06-no_integration_cluster10_marker_genes.txt
    Ignored:    output/TDP-06-no_integration_cluster11_marker_genes.txt
    Ignored:    output/TDP-06-no_integration_cluster12_marker_genes.txt
    Ignored:    output/TDP-06-no_integration_cluster13_marker_genes.txt
    Ignored:    output/TDP-06-no_integration_cluster14_marker_genes.txt
    Ignored:    output/TDP-06-no_integration_cluster15_marker_genes.txt
    Ignored:    output/TDP-06-no_integration_cluster16_marker_genes.txt
    Ignored:    output/TDP-06-no_integration_cluster17_marker_genes.txt
    Ignored:    output/TDP-06-no_integration_cluster1_marker_genes.txt
    Ignored:    output/TDP-06-no_integration_cluster2_marker_genes.txt
    Ignored:    output/TDP-06-no_integration_cluster3_marker_genes.txt
    Ignored:    output/TDP-06-no_integration_cluster4_marker_genes.txt
    Ignored:    output/TDP-06-no_integration_cluster5_marker_genes.txt
    Ignored:    output/TDP-06-no_integration_cluster6_marker_genes.txt
    Ignored:    output/TDP-06-no_integration_cluster7_marker_genes.txt
    Ignored:    output/TDP-06-no_integration_cluster8_marker_genes.txt
    Ignored:    output/TDP-06-no_integration_cluster9_marker_genes.txt
    Ignored:    output/TDP-06_scran_markers.rds
    Ignored:    output/additional_filtering.rds
    Ignored:    output/conos/
    Ignored:    output/conos_organoid-06-conos-analysis.rds
    Ignored:    output/conos_organoid-06-group-integration-conos-analysis.rds
    Ignored:    output/figures/
    Ignored:    output/organoid_integration_cluster10_marker_genes.txt
    Ignored:    output/organoid_integration_cluster11_marker_genes.txt
    Ignored:    output/organoid_integration_cluster12_marker_genes.txt
    Ignored:    output/organoid_integration_cluster13_marker_genes.txt
    Ignored:    output/organoid_integration_cluster14_marker_genes.txt
    Ignored:    output/organoid_integration_cluster15_marker_genes.txt
    Ignored:    output/organoid_integration_cluster16_marker_genes.txt
    Ignored:    output/organoid_integration_cluster17_marker_genes.txt
    Ignored:    output/organoid_integration_cluster1_marker_genes.txt
    Ignored:    output/organoid_integration_cluster2_marker_genes.txt
    Ignored:    output/organoid_integration_cluster3_marker_genes.txt
    Ignored:    output/organoid_integration_cluster4_marker_genes.txt
    Ignored:    output/organoid_integration_cluster5_marker_genes.txt
    Ignored:    output/organoid_integration_cluster6_marker_genes.txt
    Ignored:    output/organoid_integration_cluster7_marker_genes.txt
    Ignored:    output/organoid_integration_cluster8_marker_genes.txt
    Ignored:    output/organoid_integration_cluster9_marker_genes.txt
    Ignored:    output/res_TDP-08-01-muscat.rds
    Ignored:    output/sce_01_preprocessing.rds
    Ignored:    output/sce_02_quality_control.rds
    Ignored:    output/sce_03_filtering.rds
    Ignored:    output/sce_03_filtering_all_genes.rds
    Ignored:    output/sce_06-1-prepare-sce.rds
    Ignored:    output/sce_TDP-08-01-muscat.rds
    Ignored:    output/sce_TDP_01_preprocessing.rds
    Ignored:    output/sce_TDP_02_quality_control.rds
    Ignored:    output/sce_TDP_03_filtering.rds
    Ignored:    output/sce_TDP_03_filtering_all_genes.rds
    Ignored:    output/sce_organoid-01-clustering.rds
    Ignored:    output/sce_preprocessing.rds
    Ignored:    output/so_04-group_integration.rds
    Ignored:    output/so_04-stage_integration.rds
    Ignored:    output/so_04_1_cell_cycle.rds
    Ignored:    output/so_04_clustering.rds
    Ignored:    output/so_06-clustering_all_timepoints.rds
    Ignored:    output/so_08-00_clustering_HA_D96.rds
    Ignored:    output/so_08-clustering_timeline_HA.rds
    Ignored:    output/so_0x-sample_integration.rds
    Ignored:    output/so_TDP-06-cluster-analysis.rds
    Ignored:    output/so_TDP_04_clustering.rds
    Ignored:    output/so_TDP_05_plasmid_expression.rds
    Ignored:    output/so_additional_filtering_clustering.rds
    Ignored:    output/so_integrated_organoid-02-integration.rds
    Ignored:    output/so_merged_organoid-02-integration.rds
    Ignored:    output/so_organoid-01-clustering.rds
    Ignored:    output/so_sample_organoid-01-clustering.rds
    Ignored:    output/tbl_TDP-08-01-muscat.rds
    Ignored:    scripts/.DS_Store
    Ignored:    scripts/._.DS_Store
    Ignored:    scripts/._bu_Rcode.R
    Ignored:    scripts/._plasmid_expression.sh

Untracked files:
    Untracked:  Filtered.pdf
    Untracked:  Rplots.pdf
    Untracked:  Unfiltered
    Untracked:  Unfiltered.pdf
    Untracked:  analysis/Lam-0-NSC_no_integration.Rmd
    Untracked:  analysis/TDP-07-01-STMN2_expression copy.Rmd
    Untracked:  analysis/additional_filtering.Rmd
    Untracked:  analysis/additional_filtering_clustering.Rmd
    Untracked:  analysis/organoid-01-1-qualtiy-control.Rmd
    Untracked:  analysis/organoid-06-conos-analysis-Seurat.Rmd
    Untracked:  analysis/organoid-06-conos-analysis-function.Rmd
    Untracked:  analysis/organoid-07-conos-visualization.Rmd
    Untracked:  analysis/organoid-07-group-integration-conos-visualization.Rmd
    Untracked:  analysis/organoid-08-conos-comparison.Rmd
    Untracked:  analysis/organoid-0x-sample_integration.Rmd
    Untracked:  analysis/sample5_QC.Rmd
    Untracked:  coverage.pdf
    Untracked:  coverage_sashimi.pdf
    Untracked:  coverage_sashimi.png
    Untracked:  data/Homo_sapiens.GRCh38.98.sorted.gtf
    Untracked:  data/Kanton_et_al/
    Untracked:  data/Lam_et_al/
    Untracked:  data/Sep2020/
    Untracked:  data/reference/
    Untracked:  data/virus_cell_tropism_markers.R
    Untracked:  data/~$Reactive_astrocytes_markers.xlsx
    Untracked:  pbDS_cell_level.pdf
    Untracked:  pbDS_heatmap.pdf
    Untracked:  pbDS_top_expr_umap.pdf
    Untracked:  pbDS_upset.pdf
    Untracked:  sashimi.pdf
    Untracked:  scripts/bu_Rcode.R
    Untracked:  scripts/bu_code.Rmd
    Untracked:  scripts/salmon-latest_linux_x86_64/
    Untracked:  stmn2.pdf
    Untracked:  tdp.pdf

Unstaged changes:
    Modified:   analysis/05-annotation.Rmd
    Modified:   analysis/Lam-02-NSC_annotation.Rmd
    Modified:   analysis/TDP-04-clustering.Rmd
    Modified:   analysis/TDP-06-cluster_analysis.Rmd
    Modified:   analysis/_site.yml
    Modified:   analysis/organoid-02-integration.Rmd
    Modified:   analysis/organoid-04-group_integration.Rmd
    Modified:   analysis/organoid-06-conos-analysis.Rmd
    Modified:   analysis/timepoints-01-organoid-integration.Rmd
Note that any generated files, e.g. HTML, png, CSS, etc., are not included in this status report because it is ok for generated content to have uncommitted changes.
These are the previous versions of the repository in which changes were made to the R Markdown (analysis/TDP-08-00-clustering-HA-D96.Rmd) and HTML (docs/TDP-08-00-clustering-HA-D96.html) files. If you've configured a remote Git repository (see ?wflow_git_remote), click on the hyperlinks in the table below to view the files as they were in that past version.
| File | Version | Author | Date | Message |
|---|---|---|---|---|
| Rmd | f7b27e3 | khembach | 2021-03-31 | use clustering from Figure 2B for DR plot |
| html | d888b55 | khembach | 2021-03-18 | Build site. |
| Rmd | 6c73bee | khembach | 2021-03-18 | highlight individual sample clustering in UMAP and heatmap |
| html | 1d6f57b | khembach | 2021-03-11 | Build site. |
| Rmd | 864cc2d | khembach | 2021-03-11 | DR with cells colored by individual clustering |
| html | d20fa77 | khembach | 2021-01-28 | Build site. |
| Rmd | e6766a6 | khembach | 2021-01-28 | cluster TDP experiment together with D96 samples |
Load packages
library(BiocParallel)
library(ggplot2)
library(dplyr)
library(cowplot)
library(ggplot2)
library(Seurat)
library(SingleCellExperiment)
library(future)
library(ComplexHeatmap)
library(RColorBrewer)
library(viridis)
Load data
## Seurat objects with normalized data
so_tdp <- readRDS(file.path("output", "so_TDP_05_plasmid_expression.rds"))
so_tdp$group_id <- "TDP"
# so_timeline <- readRDS(file.path("output", "so_06-clustering_all_timepoints.rds"))

so_d96 <- readRDS(file.path("output", "so_04_clustering.rds"))
## select only the D96 cells
so_d96 <- subset(so_d96, subset = group_id == "D96")
We merge the samples from the two data sets into a Seurat object.
## merge the two Seurat objects
so <- merge(so_tdp, y = so_d96, add.cell.ids = c("tdp_ha", "D96"),
            project = "neural_cultures", merge.data = TRUE)
so$group_id <- factor(so$group_id, levels = c("D96", "TDP"))
Variable features
so <- FindVariableFeatures(so, nfeatures = 2000,
    selection.method = "vst", verbose = FALSE)
so <- ScaleData(so, verbose = FALSE, vars.to.regress = c("sum",
                                                         "subsets_Mt_percent"))
Dimension reduction
We perform dimension reduction with t-SNE and UMAP based on PCA results.
so <- RunPCA(so, npcs = 30, verbose = FALSE)
so <- RunTSNE(so, reduction = "pca", dims = seq_len(20),
    seed.use = 1, do.fast = TRUE, verbose = FALSE)
so <- RunUMAP(so, reduction = "pca", dims = seq_len(20),
    seed.use = 1, verbose = FALSE)
Plot PCA results
# top genes that are associated with the first two PCs
VizDimLoadings(so, dims = 1:2, reduction = "pca")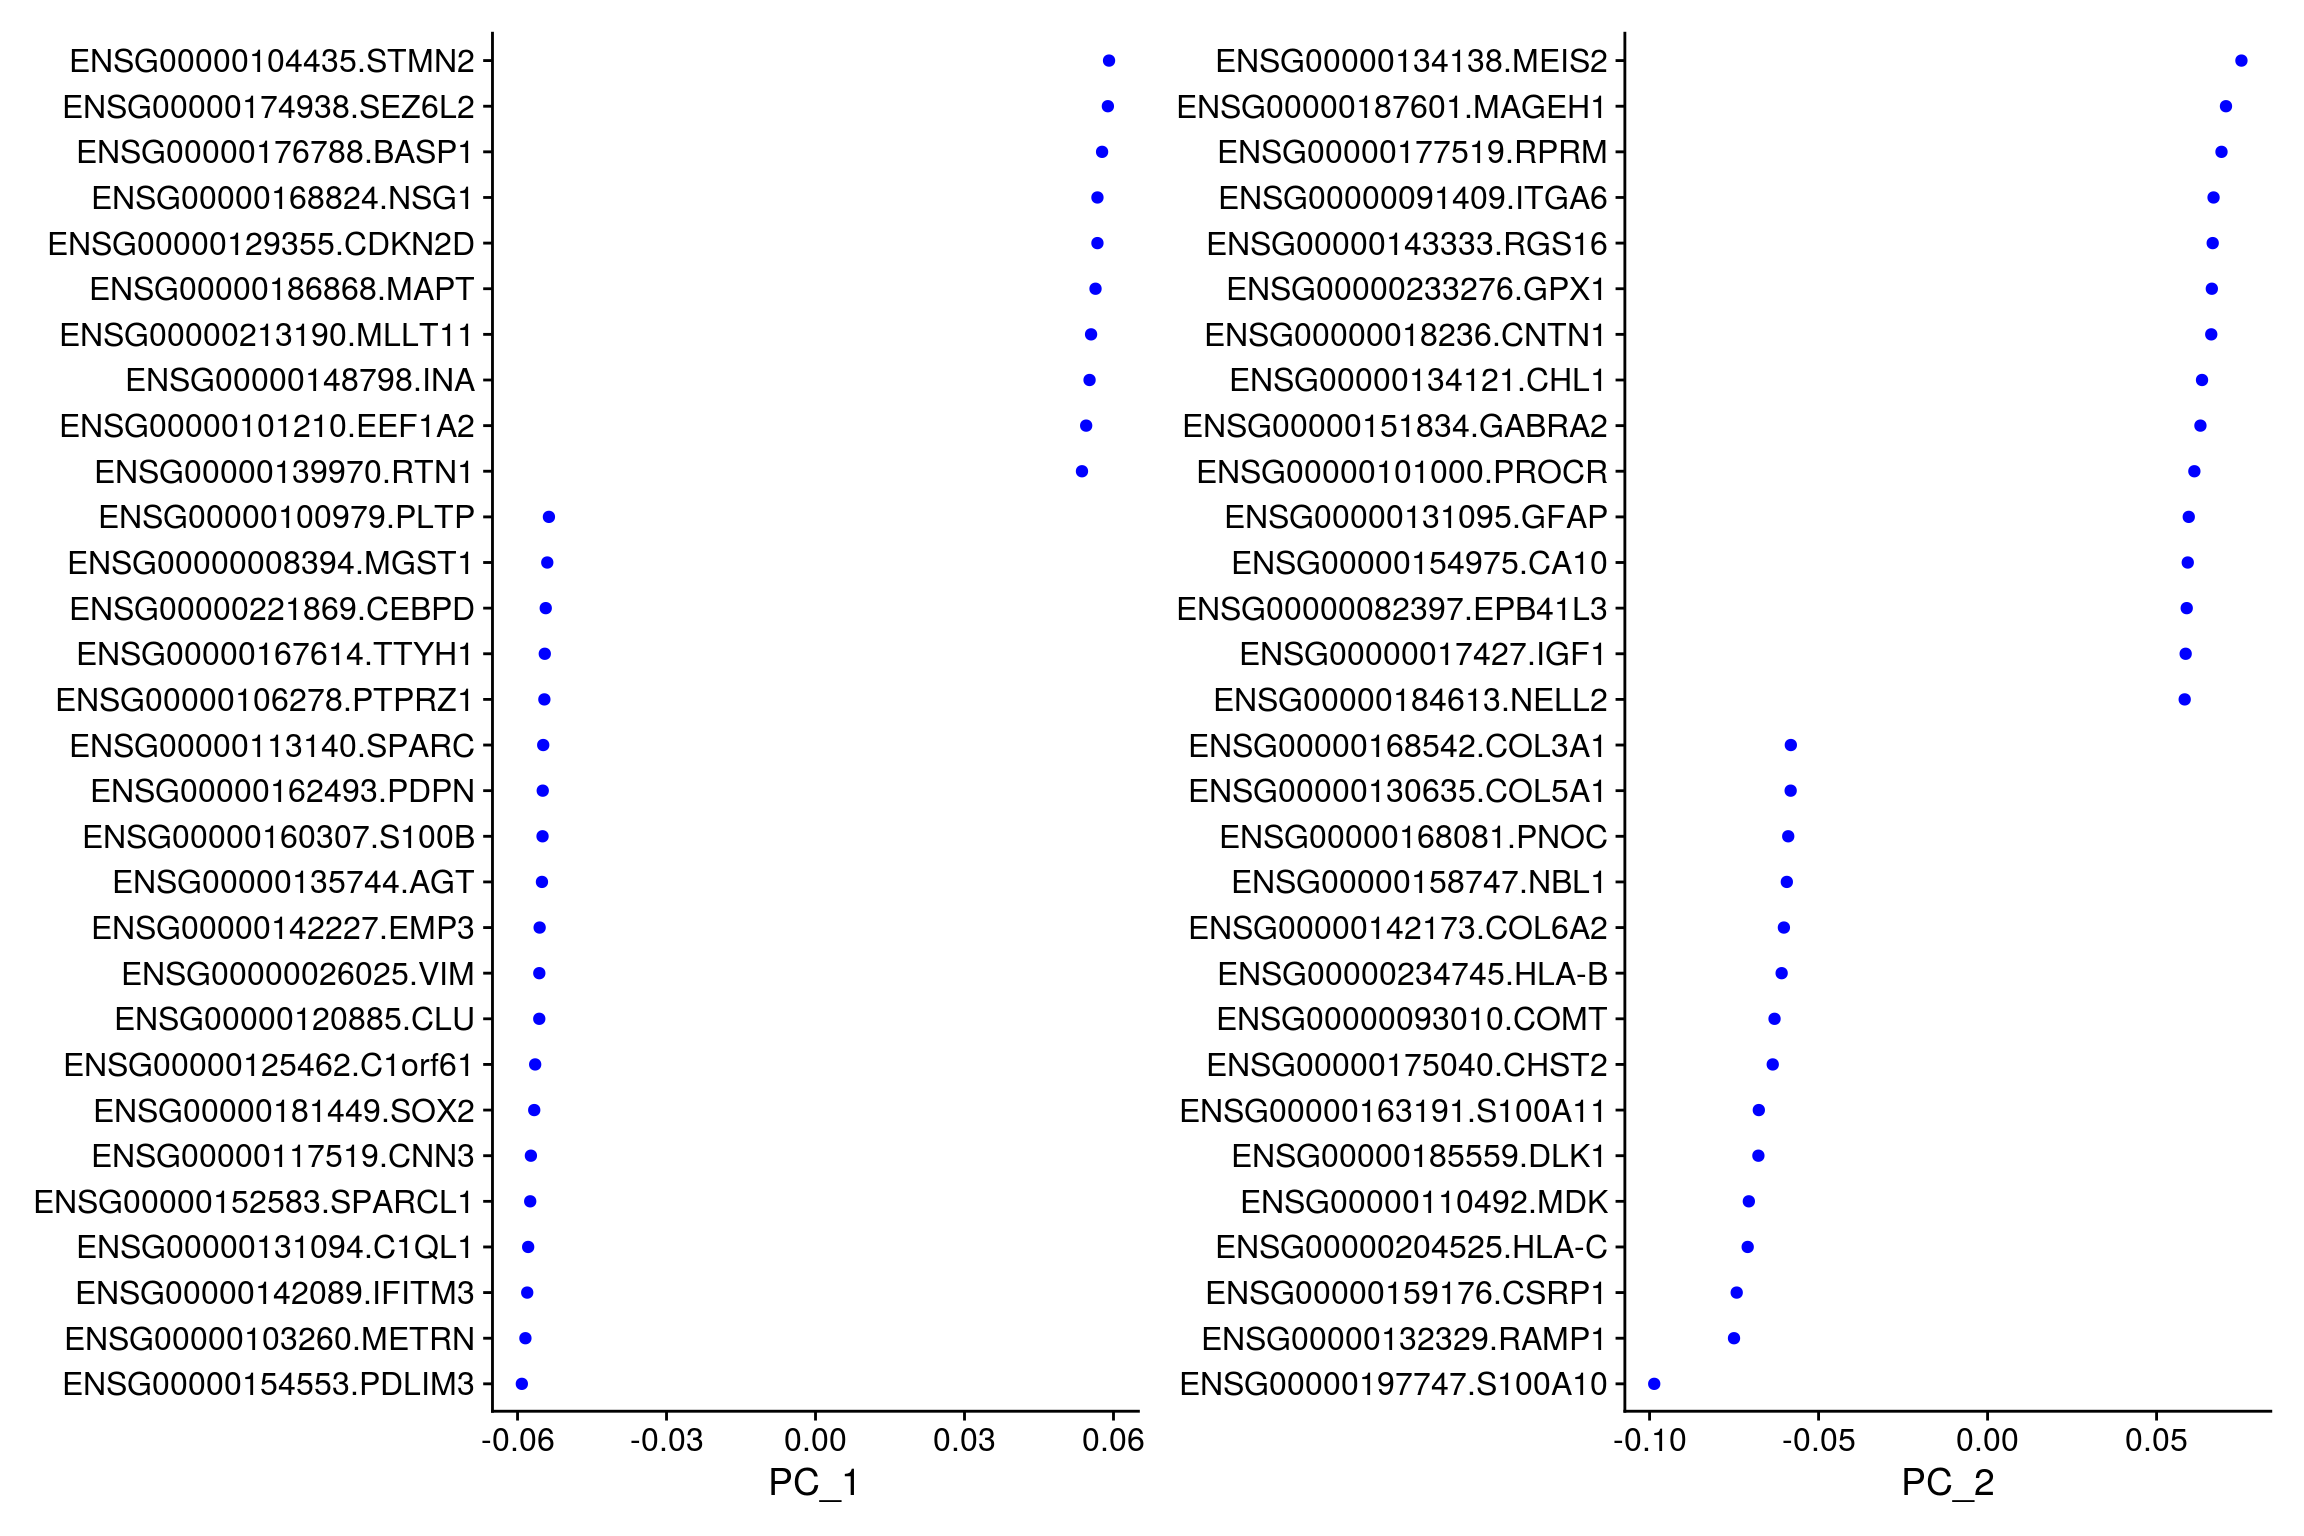
## PCA plot
DimPlot(so, reduction = "pca", group.by = "sample_id")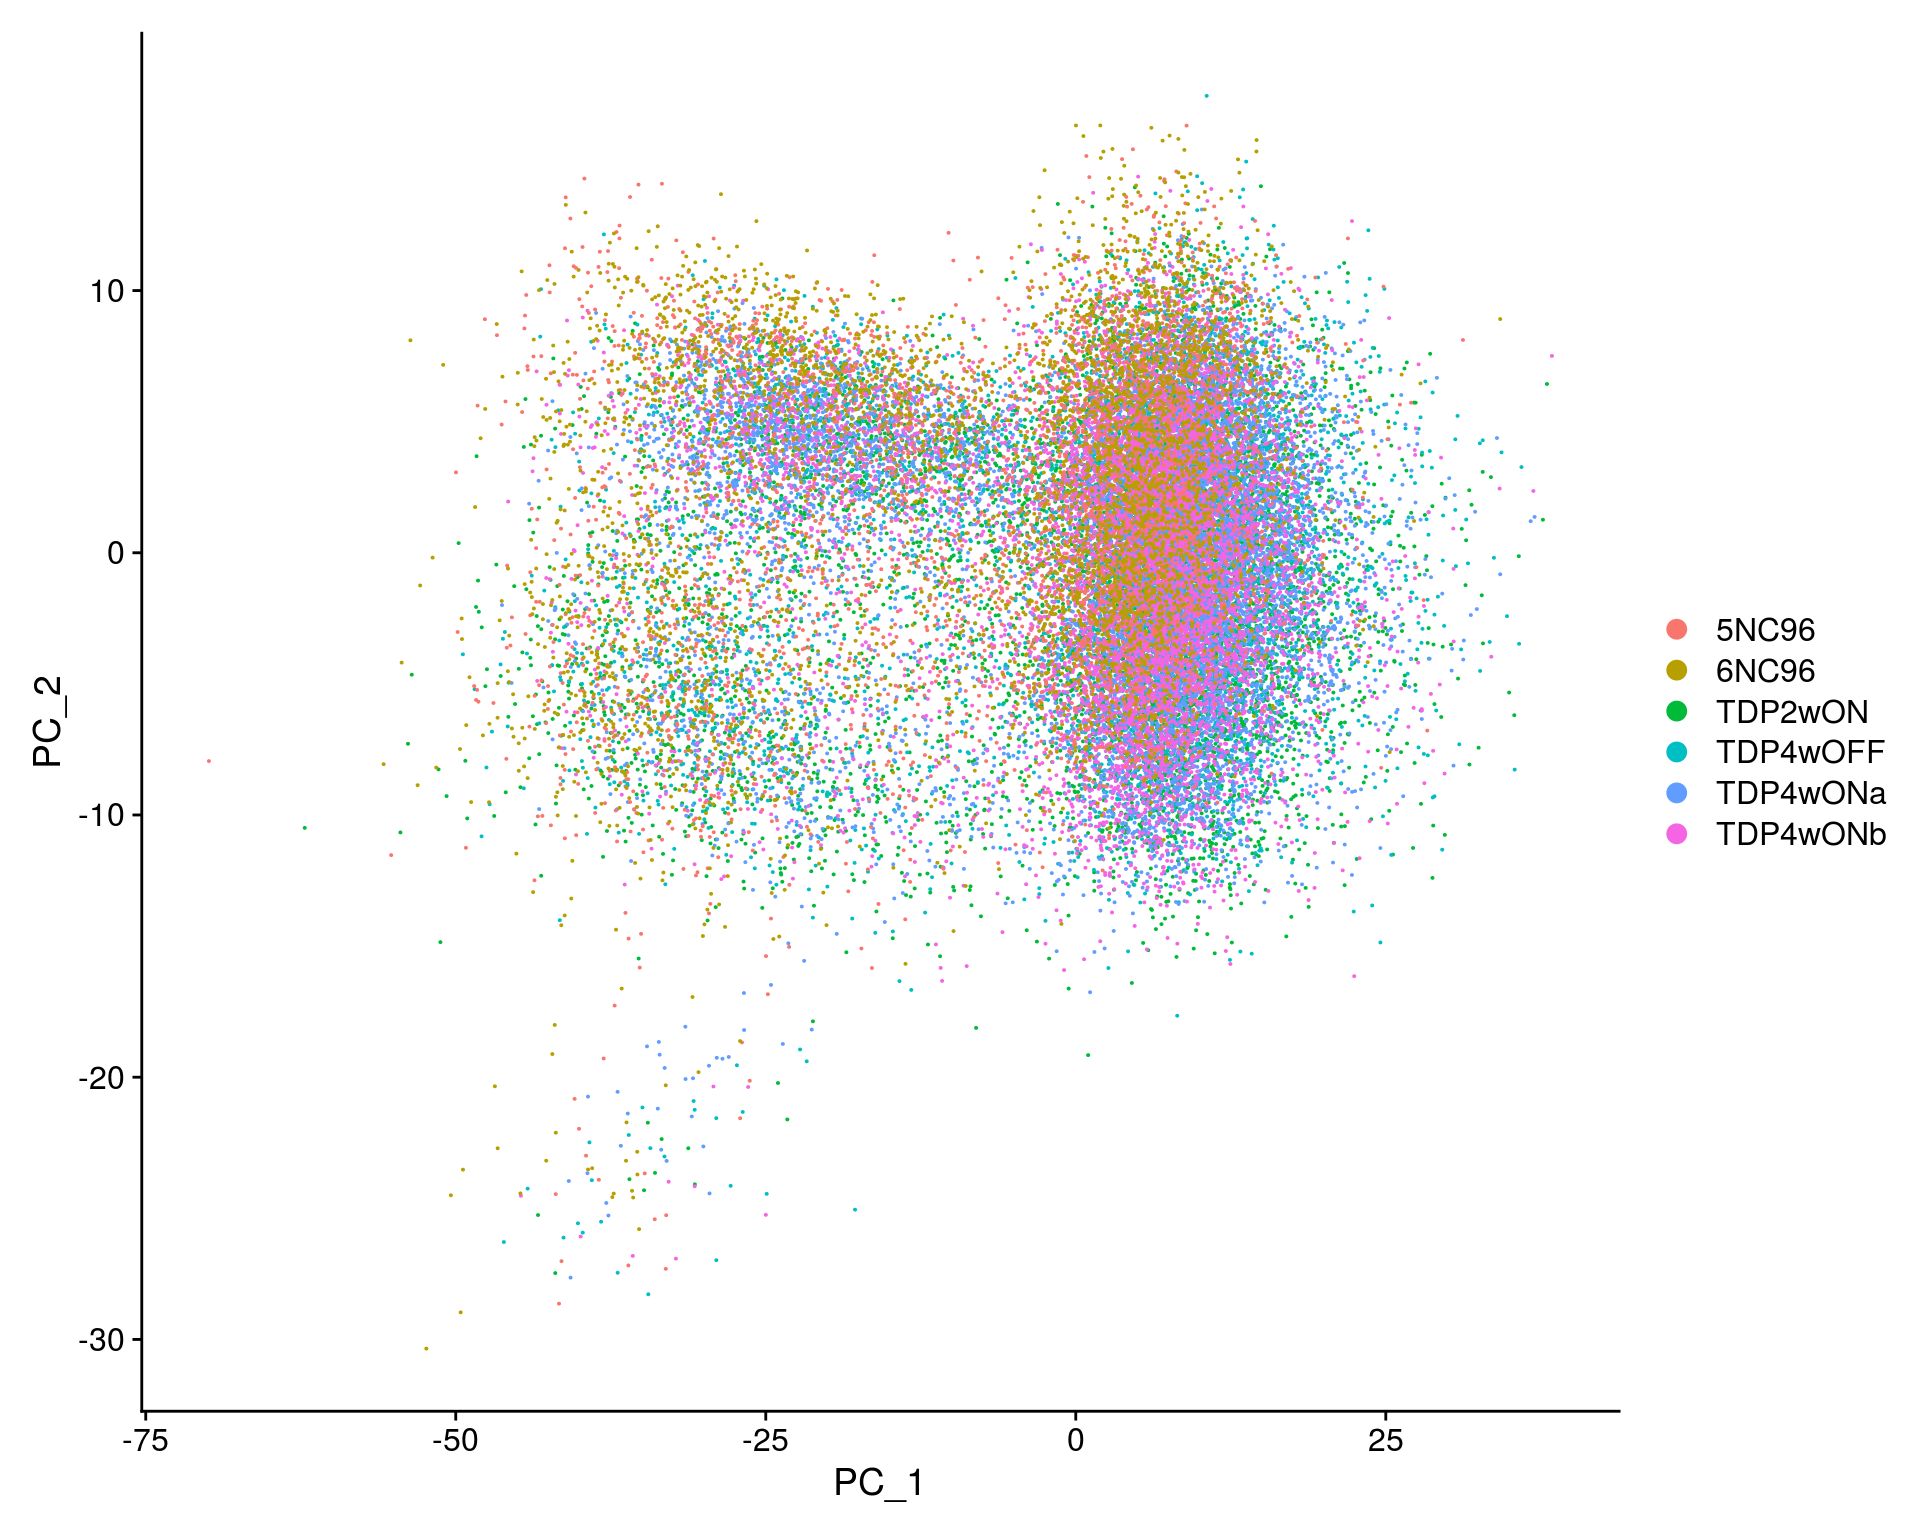
# elbow plot with the ranking of PCs based on the % of variance explained
ElbowPlot(so, ndims = 30)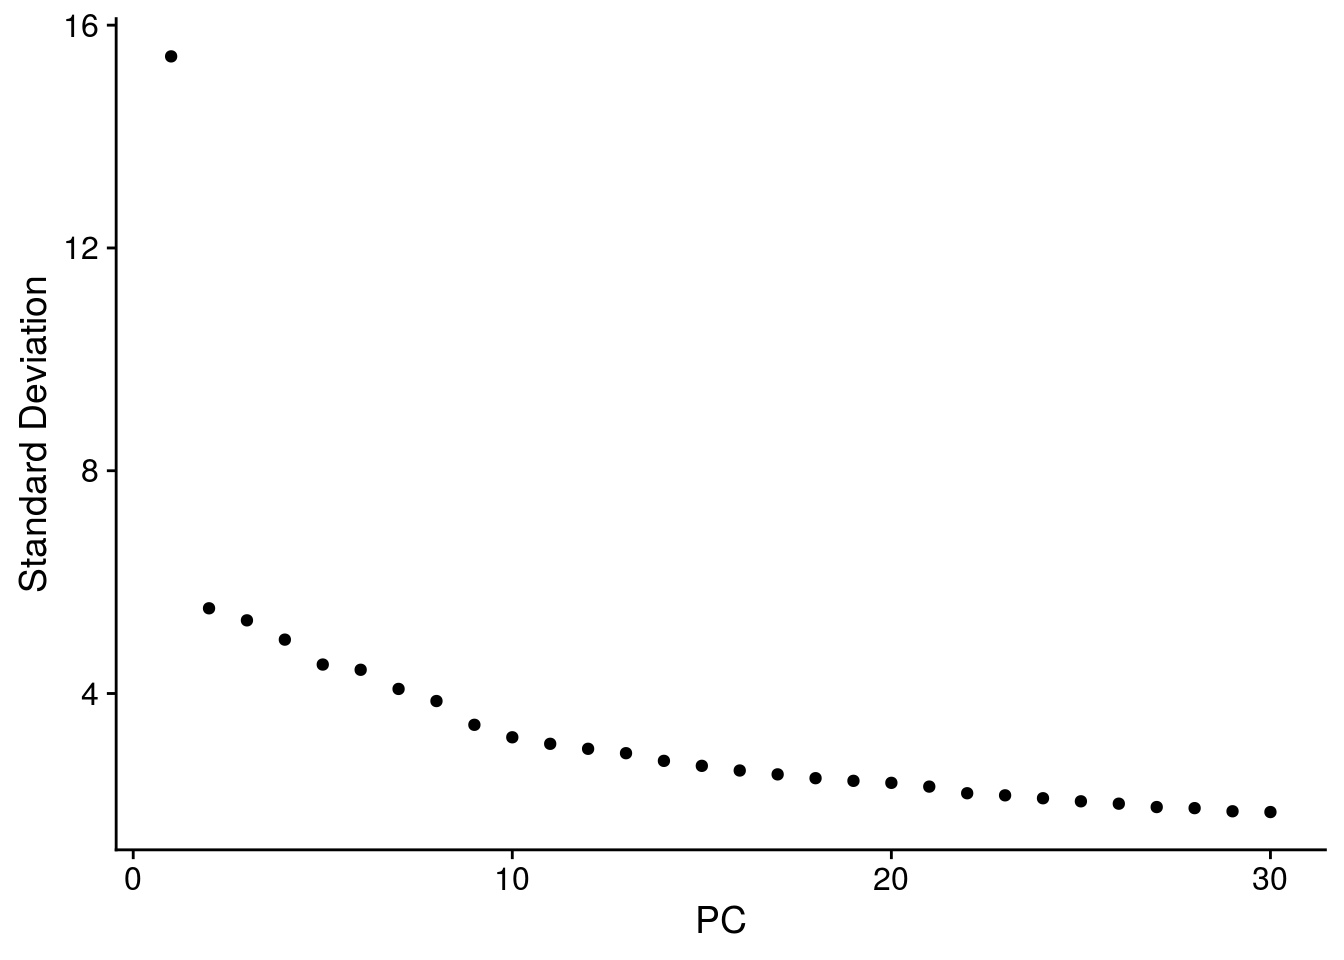
Clustering
We cluster the cells using the reduced PCA dimensions.
so <- FindNeighbors(so, reduction = "pca", dims = seq_len(20), verbose = FALSE)
for (res in c(0.2, 0.4, 0.8, 1))
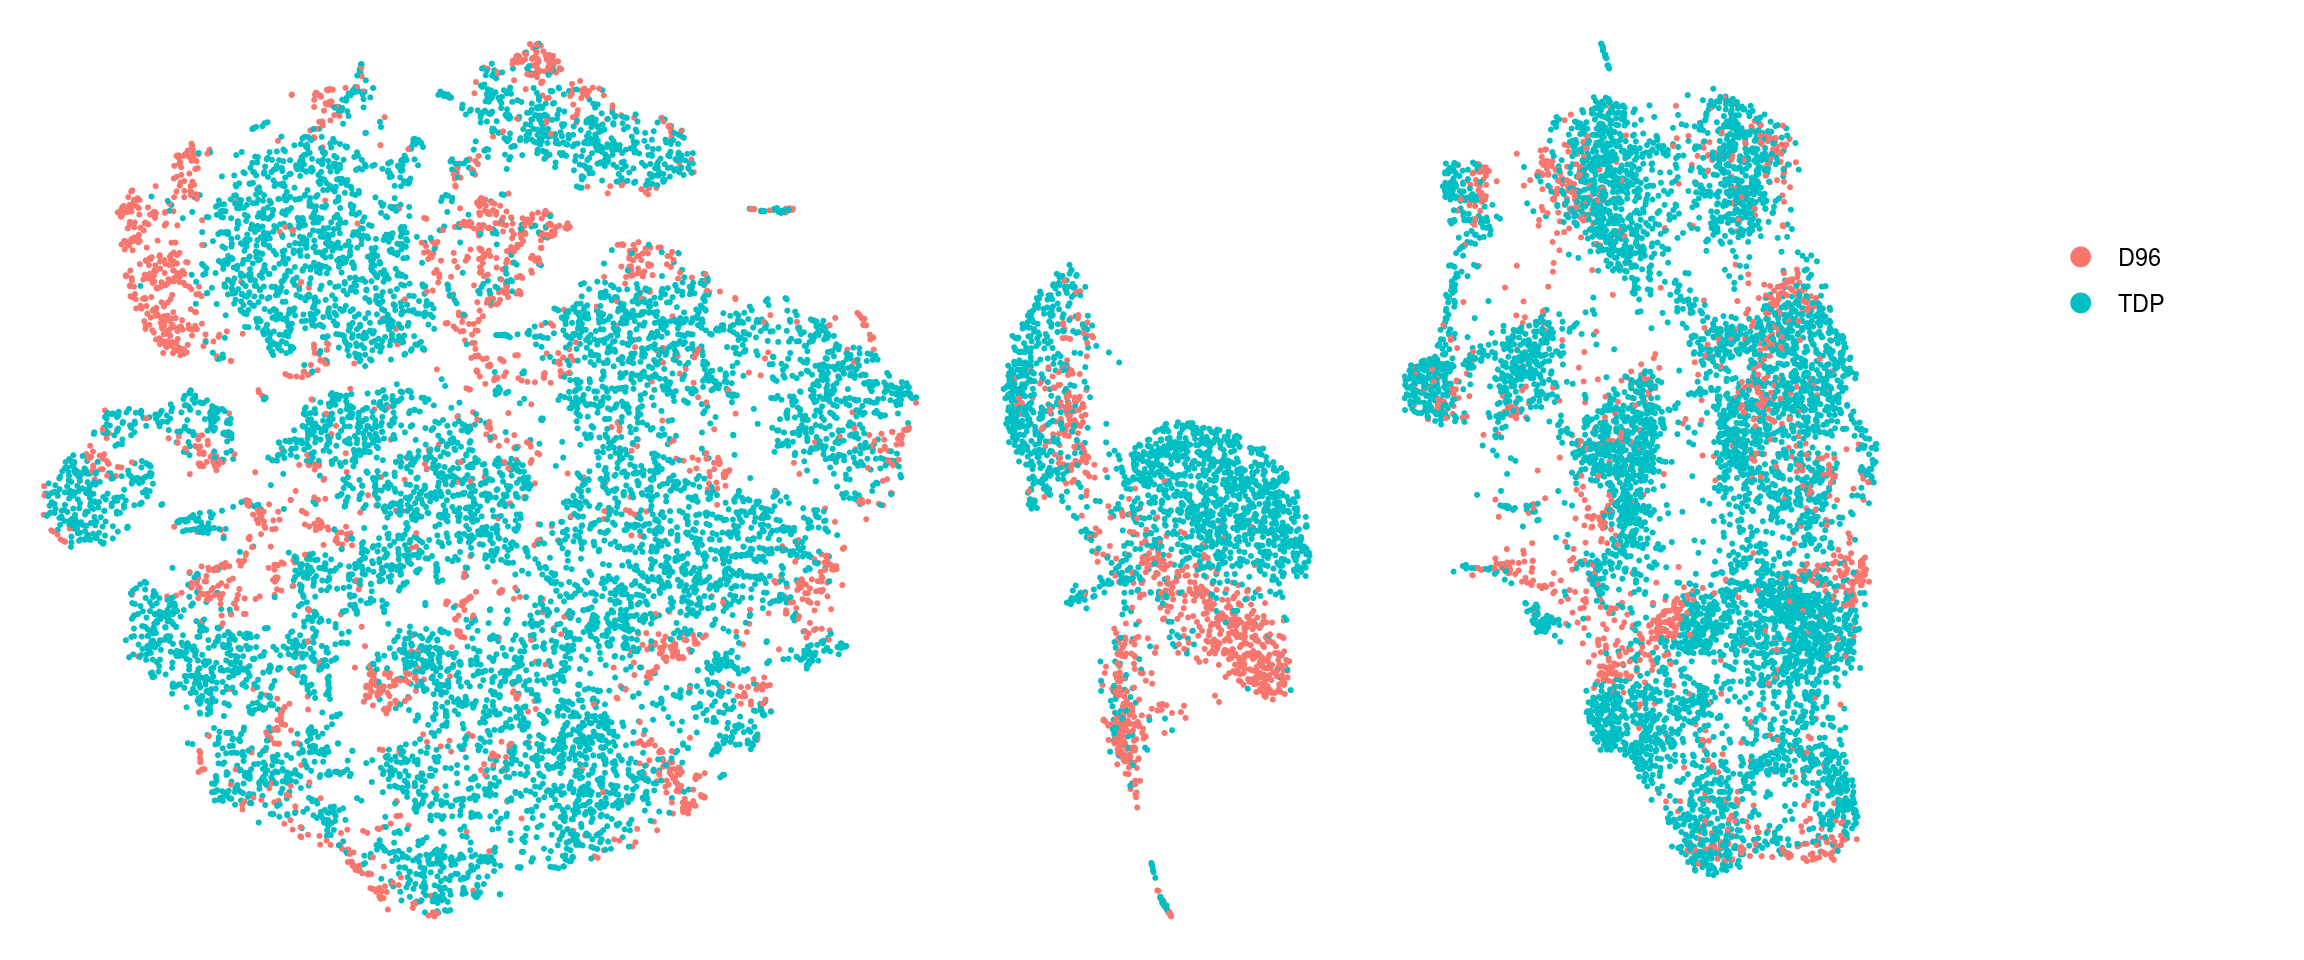
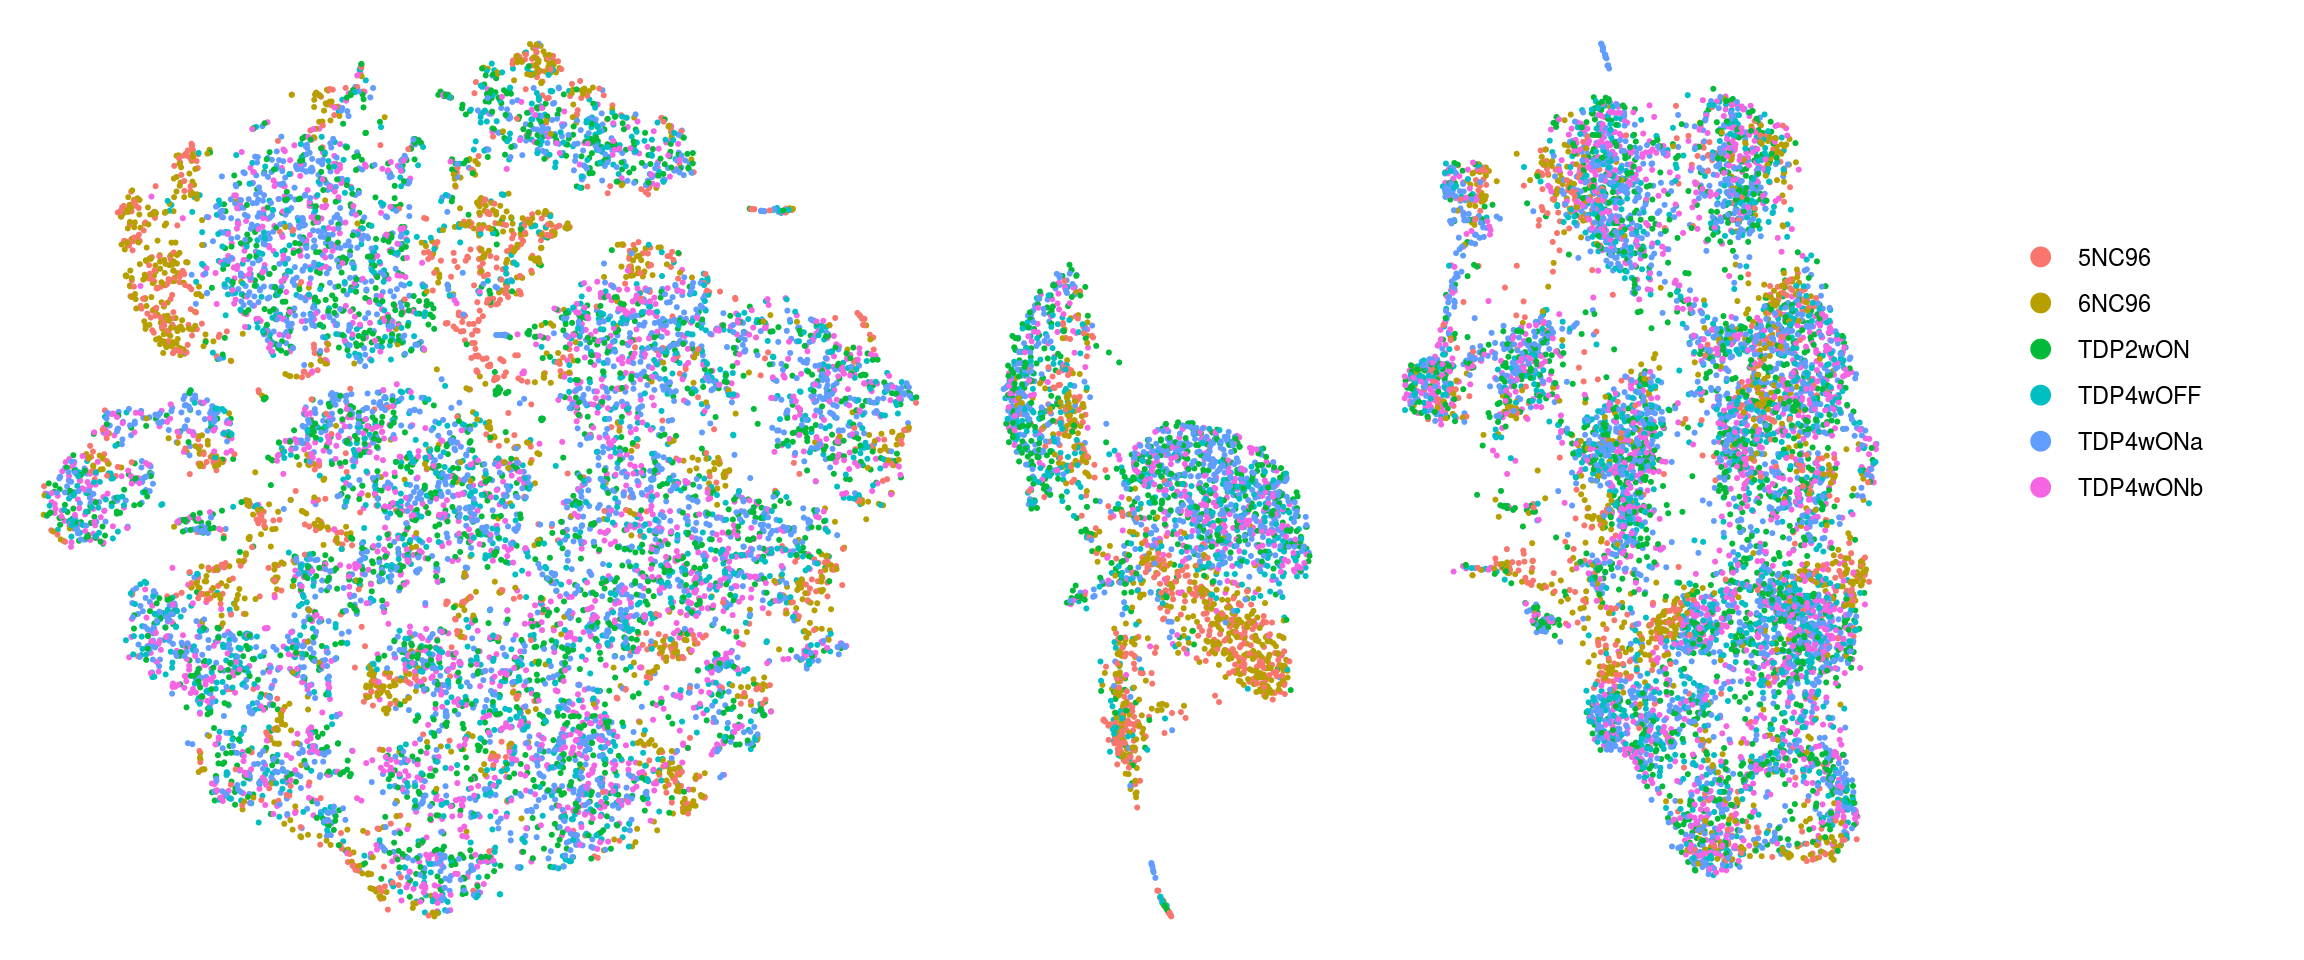
so <- FindClusters(so, resolution = res, random.seed = 1, verbose = FALSE)Dimension reduction plots
We plot the dimension reduction (DR) and color by sample, group and cluster ID
thm <- theme(aspect.ratio = 1, legend.position = "none")
ps <- lapply(c("sample_id", "group_id", "ident"), function(u) {
    p1 <- DimPlot(so, reduction = "tsne", group.by = u) + thm
    p2 <- DimPlot(so, reduction = "umap", group.by = u)
    lgd <- get_legend(p2)
    p2 <- p2 + thm
    list(p1, p2, lgd)
    plot_grid(p1, p2, lgd, nrow = 1,
        rel_widths = c(1, 1, 0.5))
})
plot_grid(plotlist = ps, ncol = 1)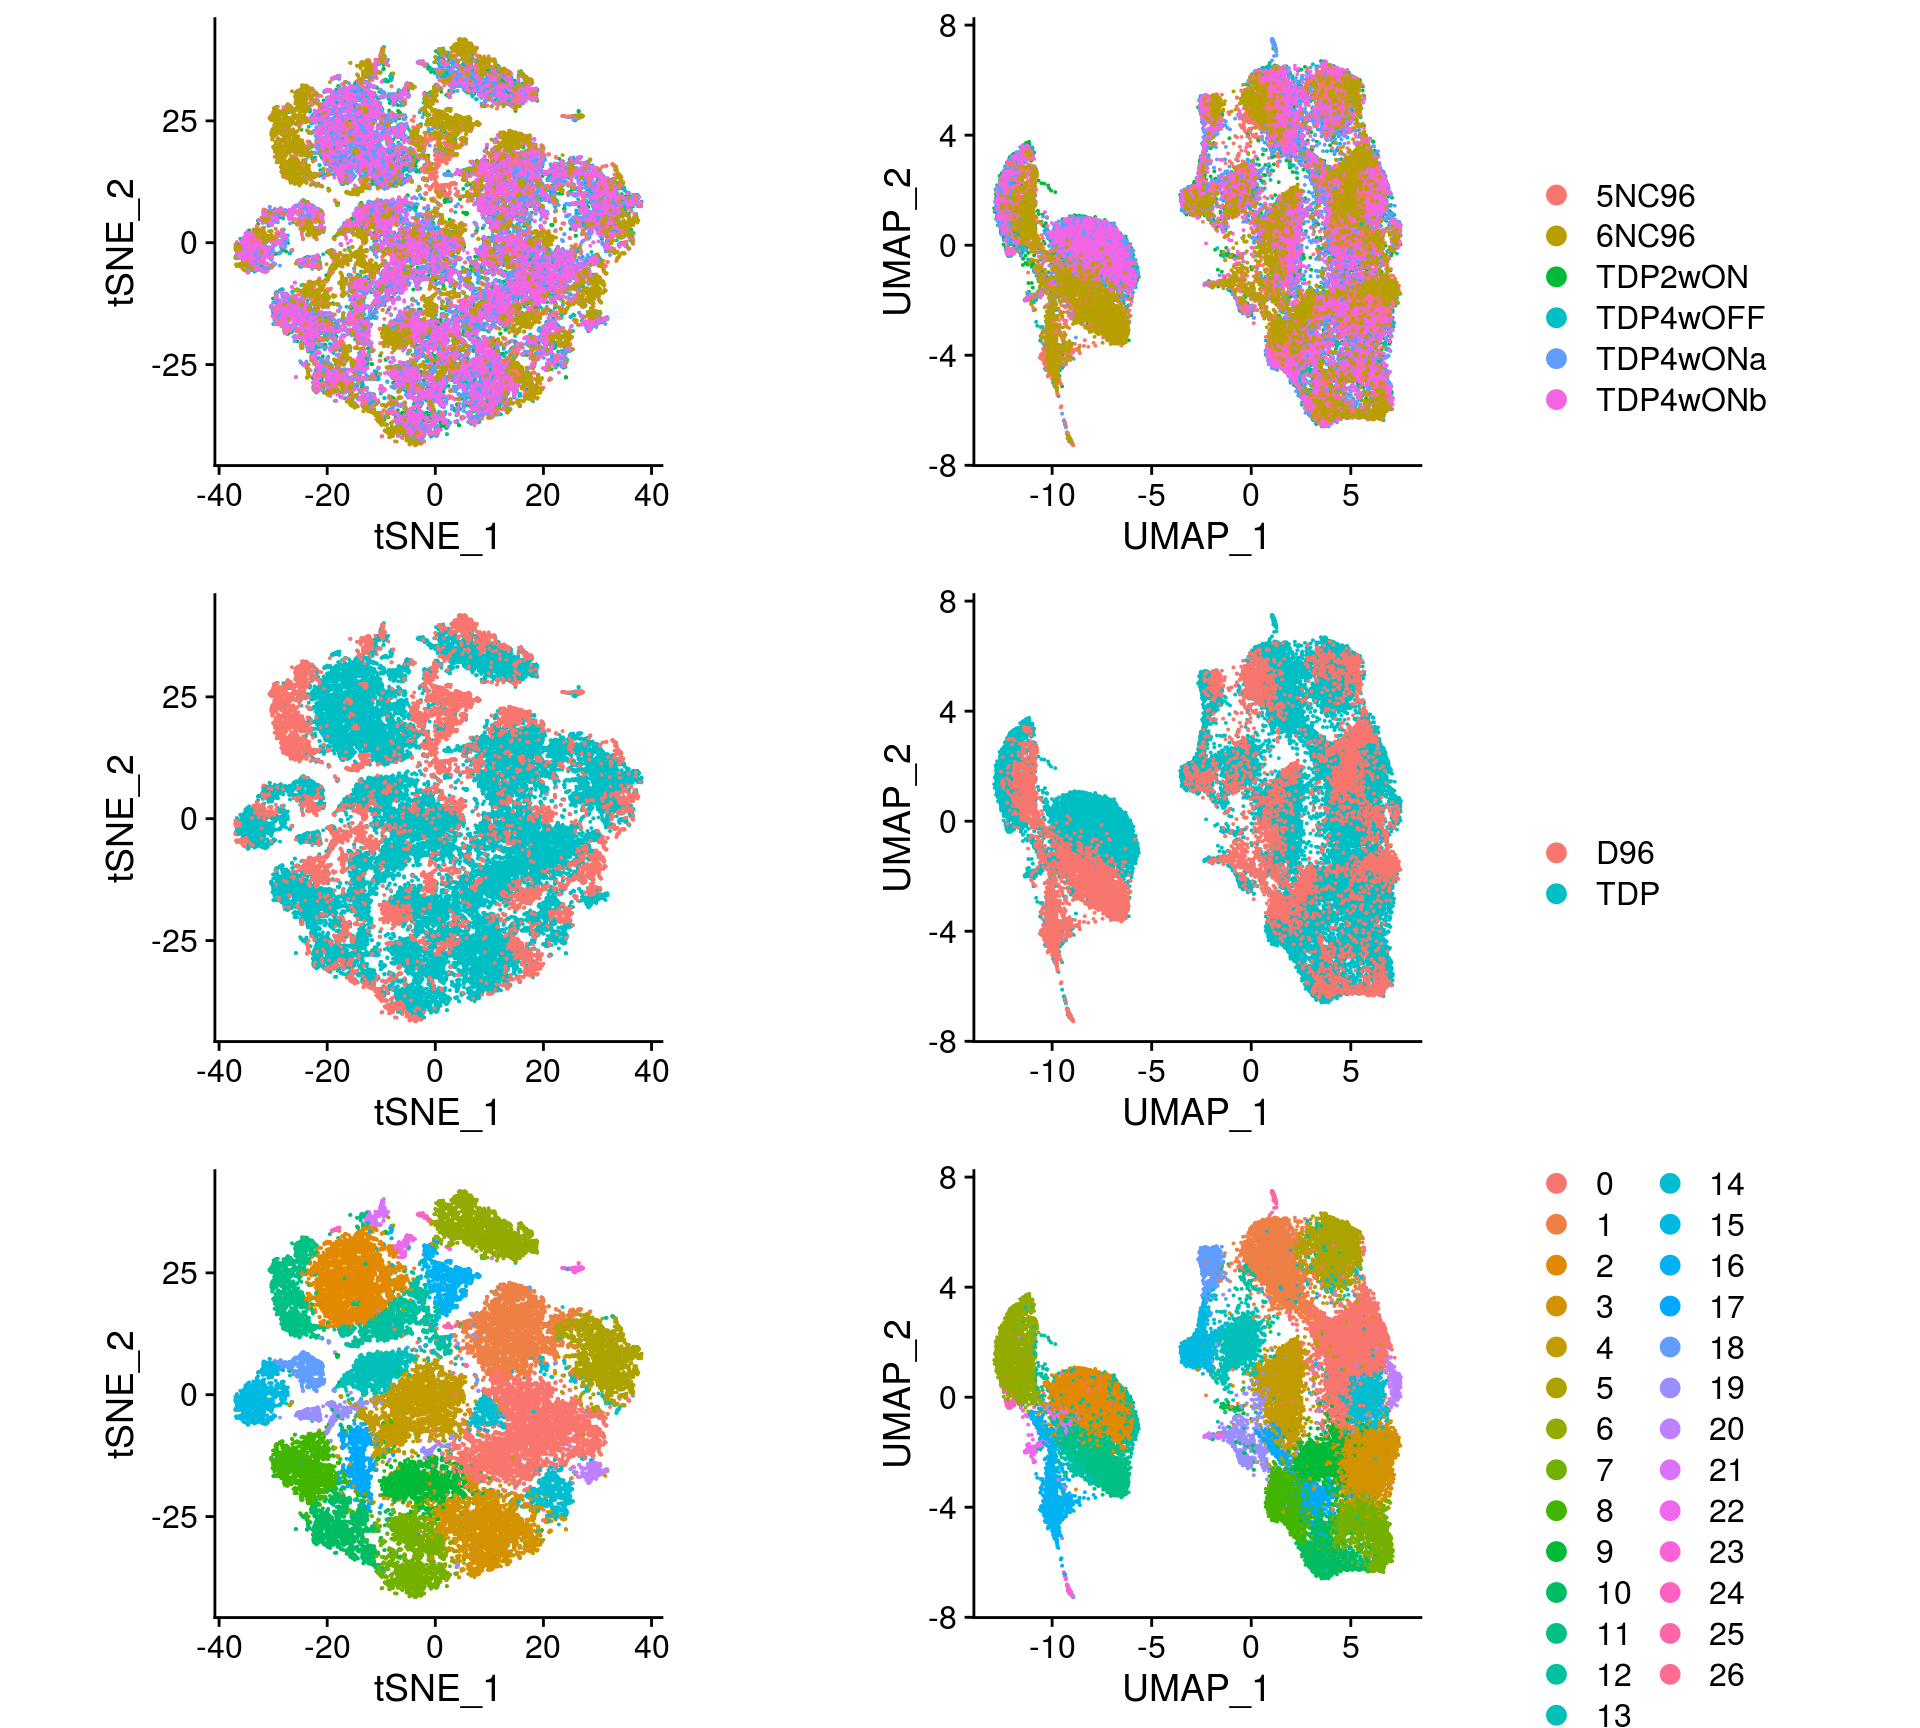
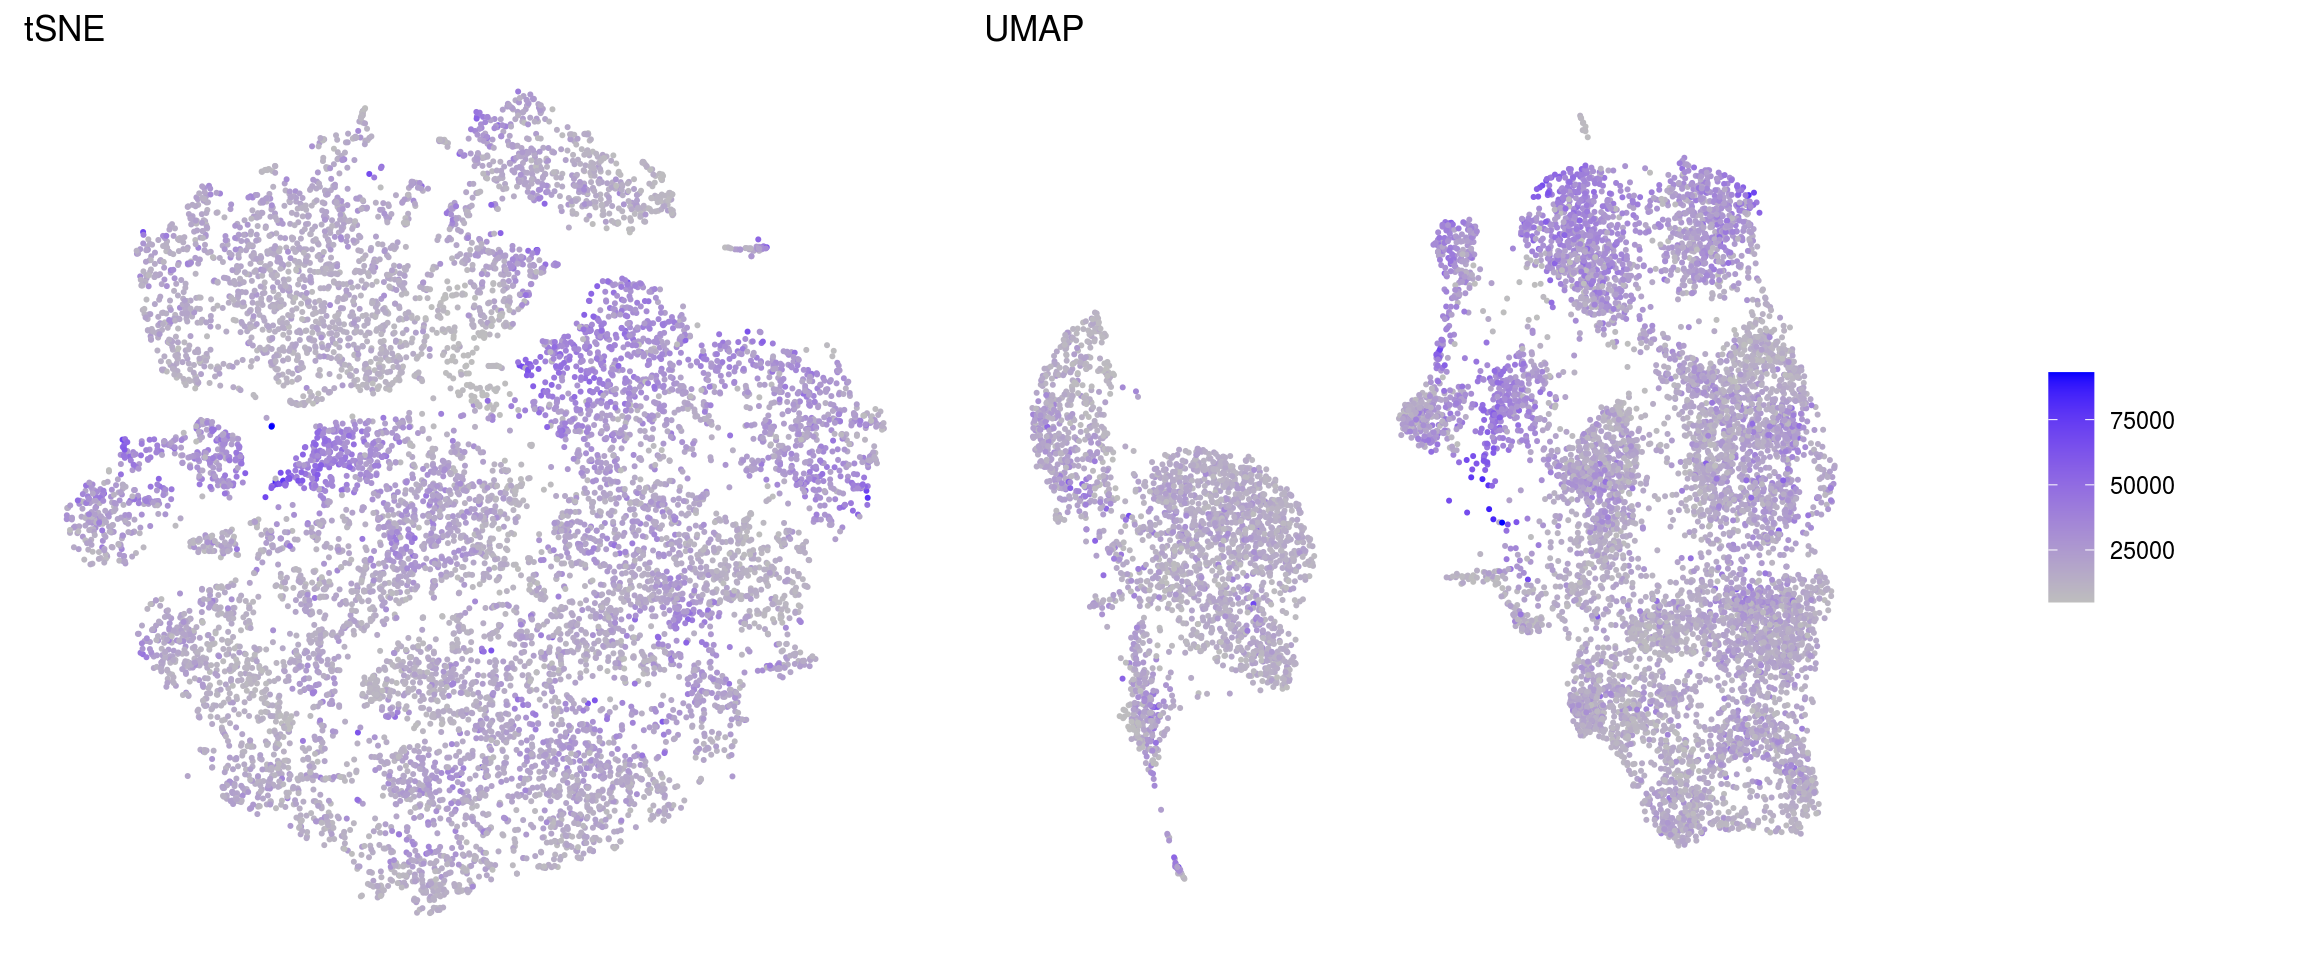
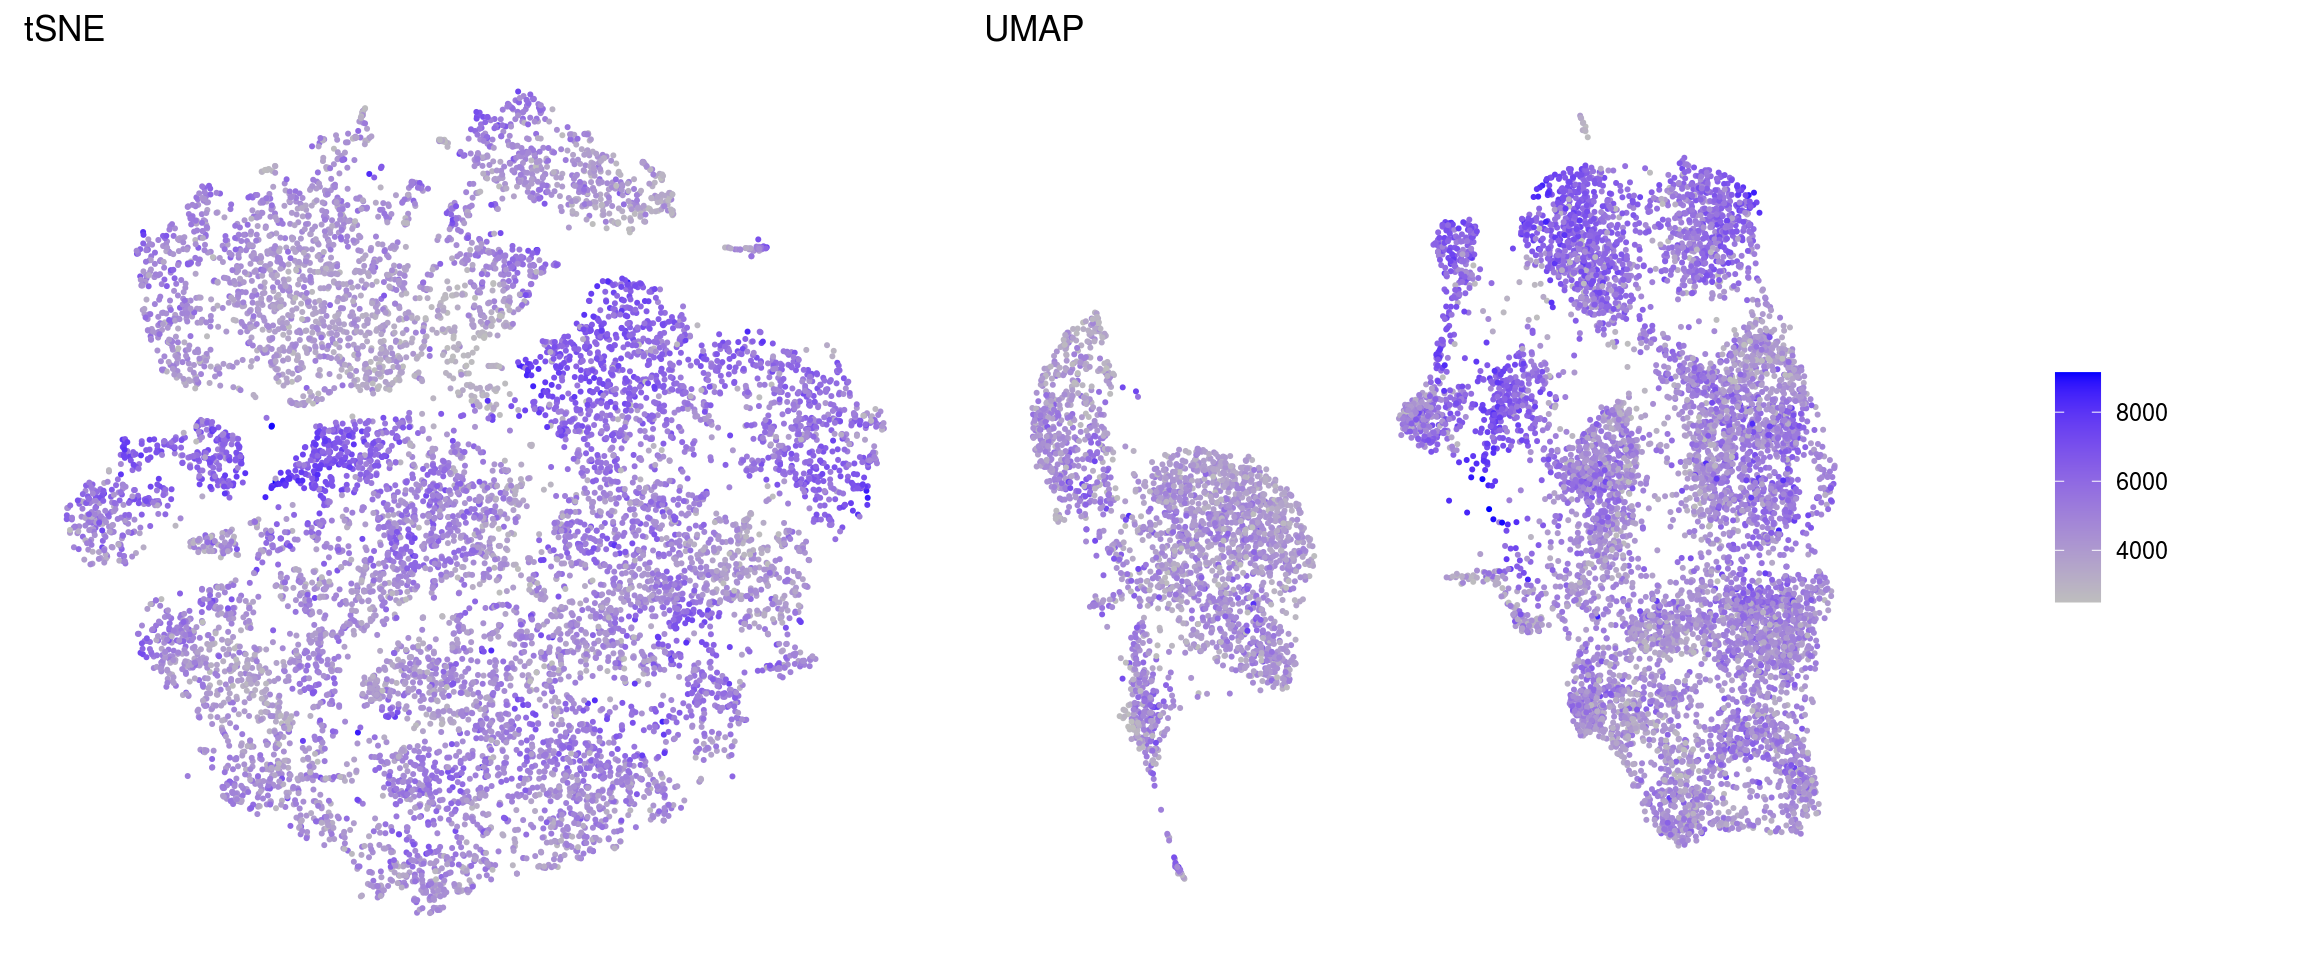
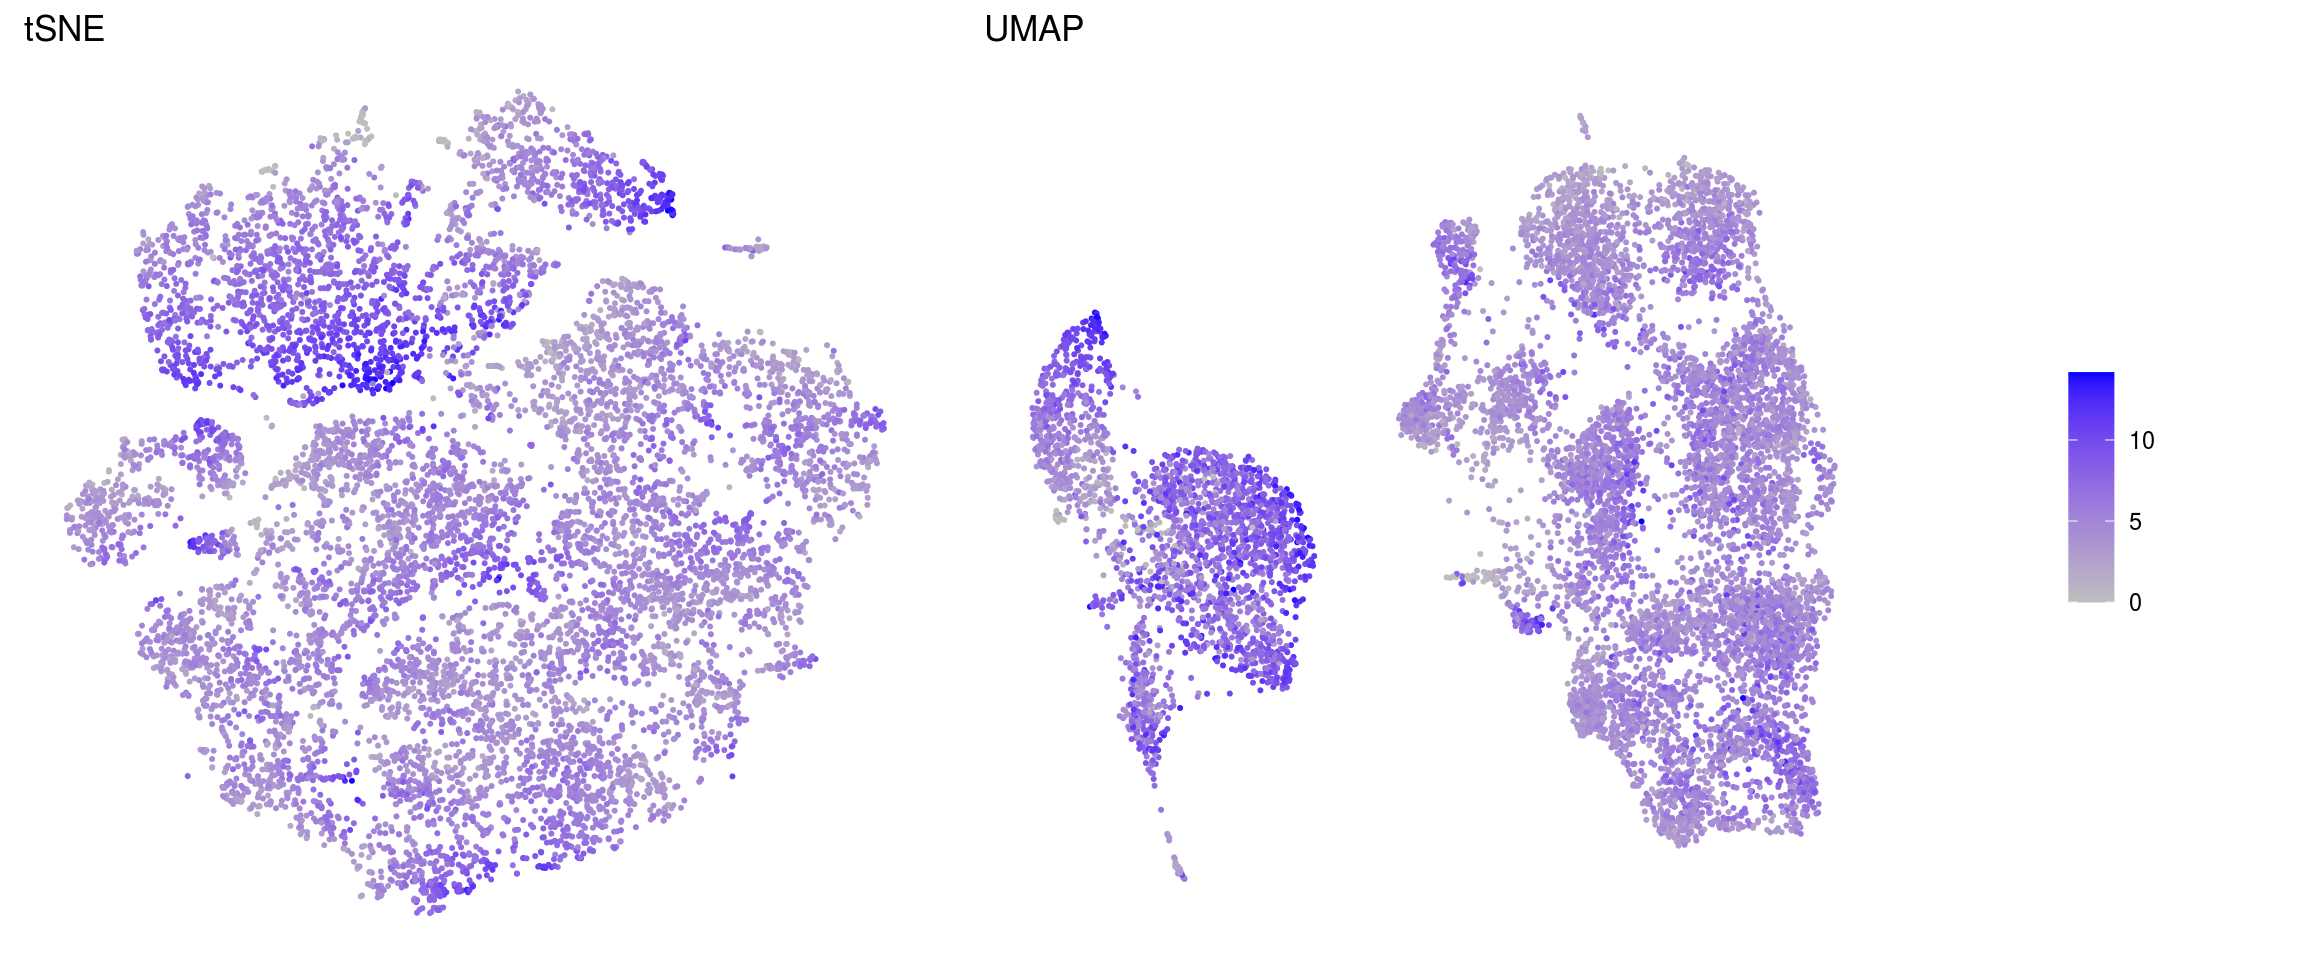
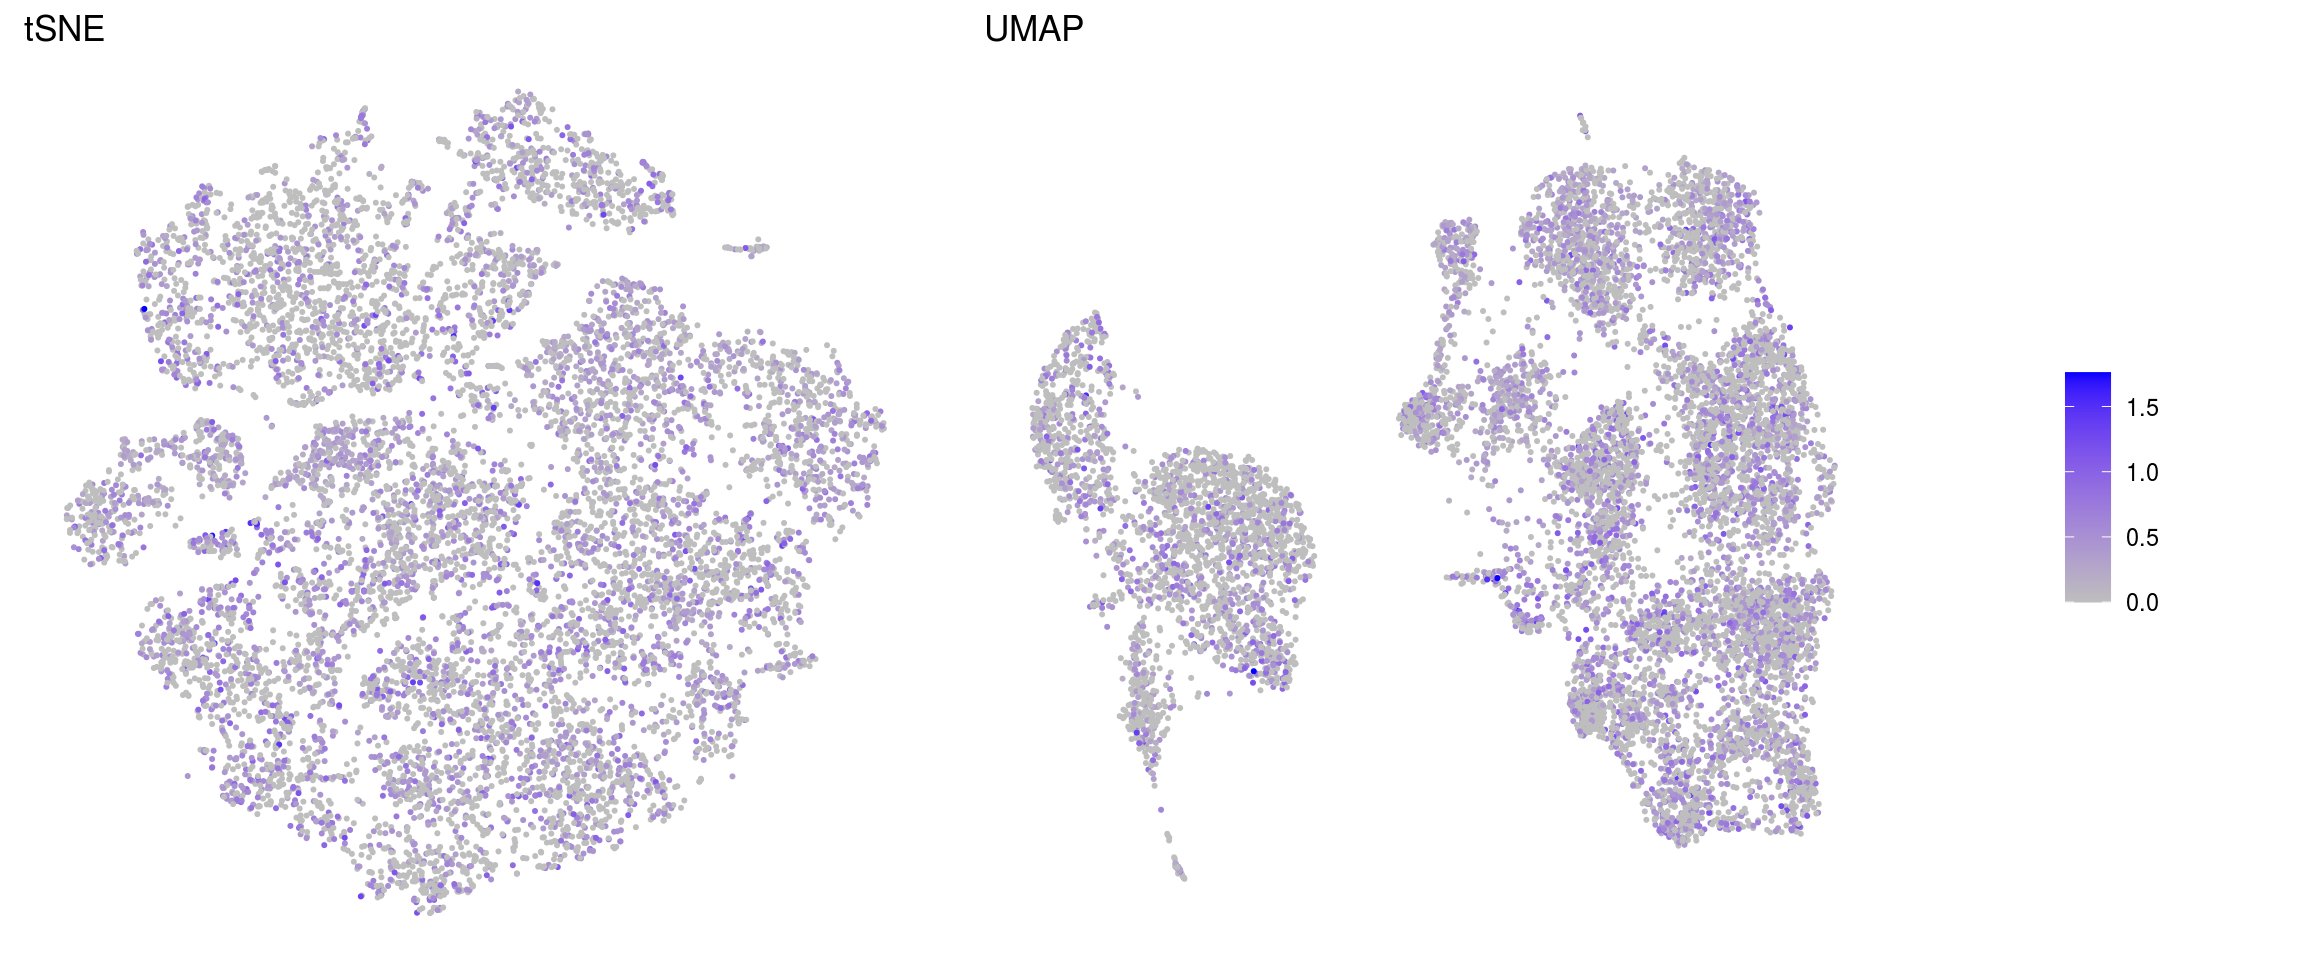
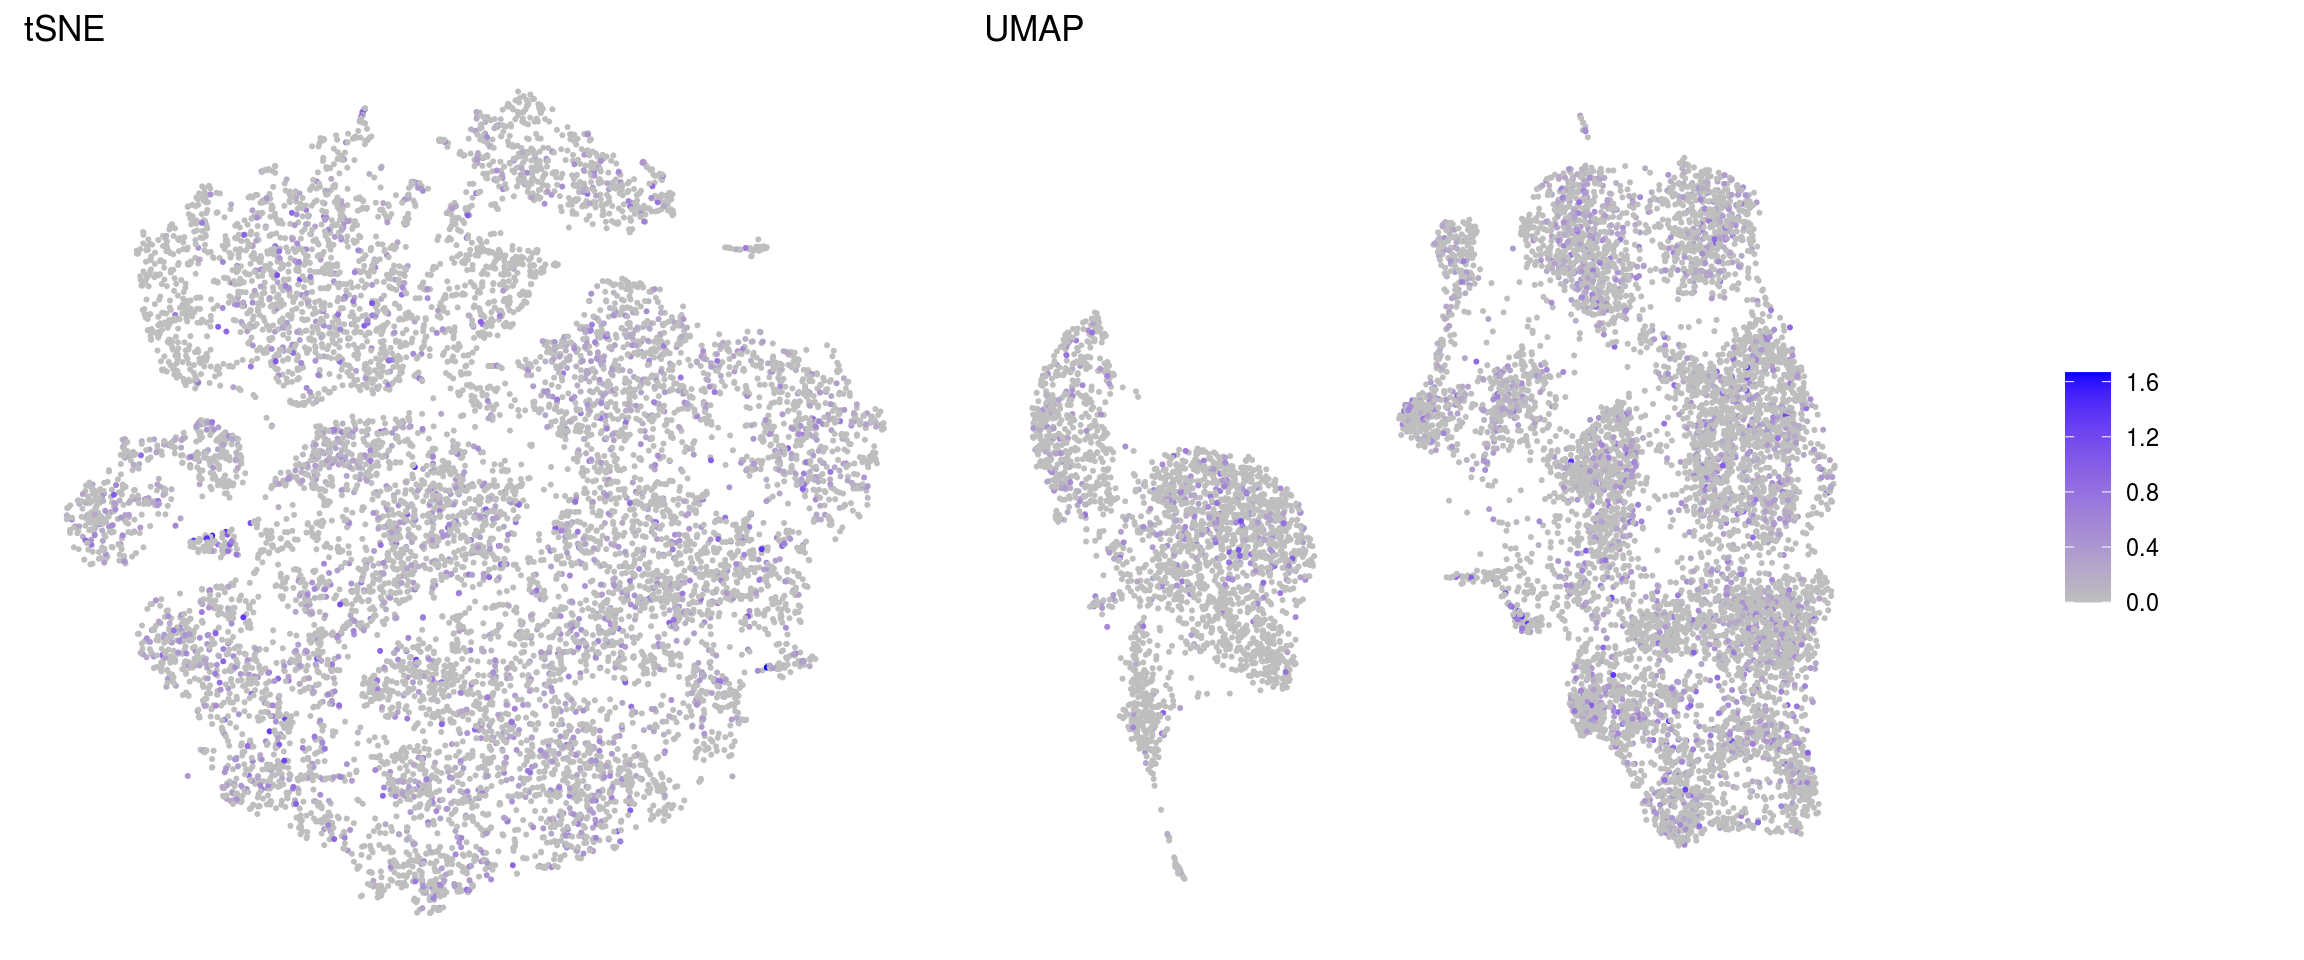
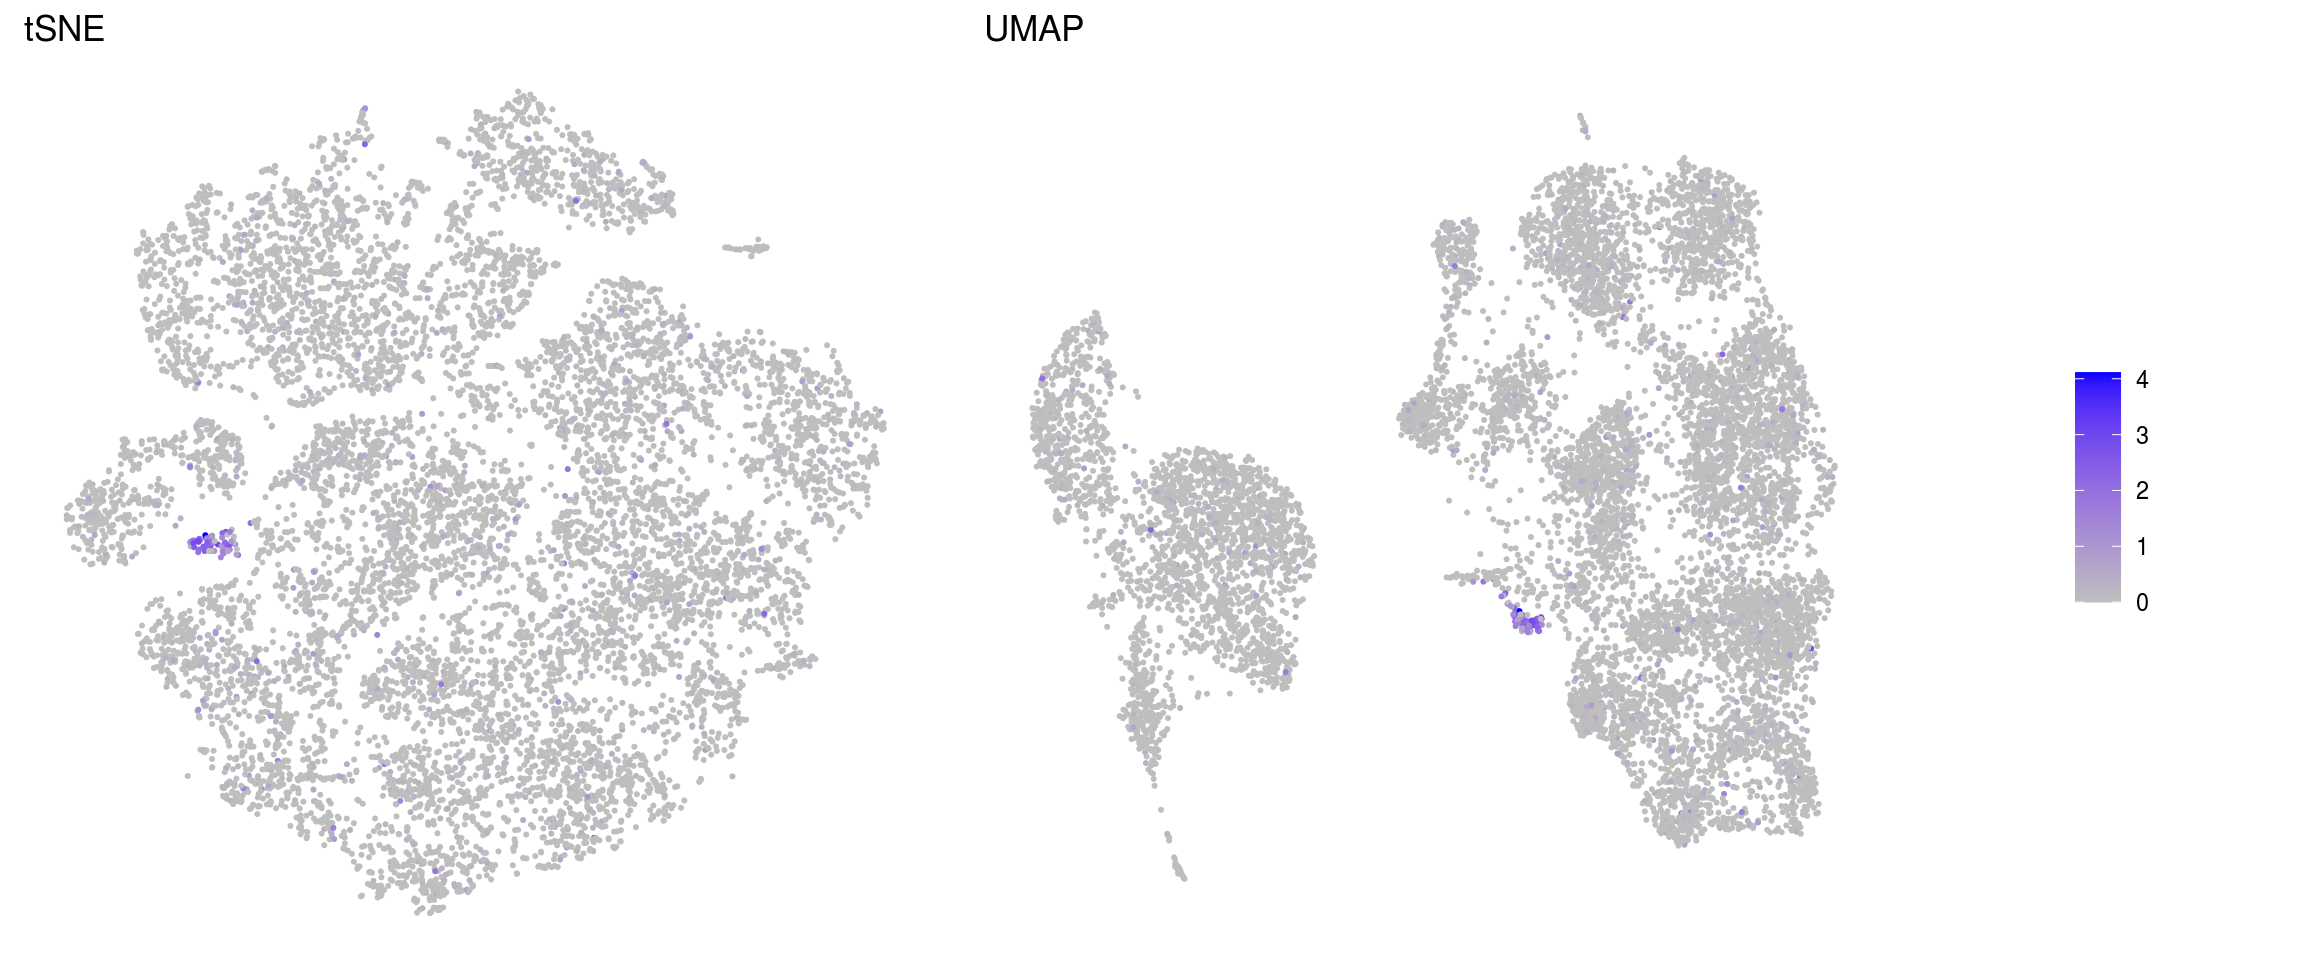
QC on DR plots
cs <- sample(colnames(so), 1e4) ## subsample cells
.plot_features <- function(so, dr, id) {
    FeaturePlot(so, cells = cs, features = id, reduction = dr, pt.size = 0.4,
                cols = c("grey", "blue")) +
        guides(col = guide_colourbar()) +
        theme_void() + theme(aspect.ratio = 1)
}
ids <- c("sum", "detected", "subsets_Mt_percent", "ENSG00000120948.TARDBP",
         "ENSG00000120948.TARDBP-alevin", "TDP43-HA")
for (id in ids) {
    cat("### ", id, "\n")
    p1 <- .plot_features(so, "tsne", id)
    lgd <- get_legend(p1)
    p1 <- p1 + theme(legend.position = "none") + ggtitle("tSNE")
    p2 <- .plot_features(so, "umap", id) + theme(legend.position = "none") +
      ggtitle("UMAP")
    ps <- plot_grid(plotlist = list(p1, p2), nrow = 1)
    p <- plot_grid(ps, lgd, nrow = 1, rel_widths = c(1, 0.2))
    print(p)
    cat("\n\n")
}
sum
detected
subsets_Mt_percent
ENSG00000120948.TARDBP
ENSG00000120948.TARDBP-alevin
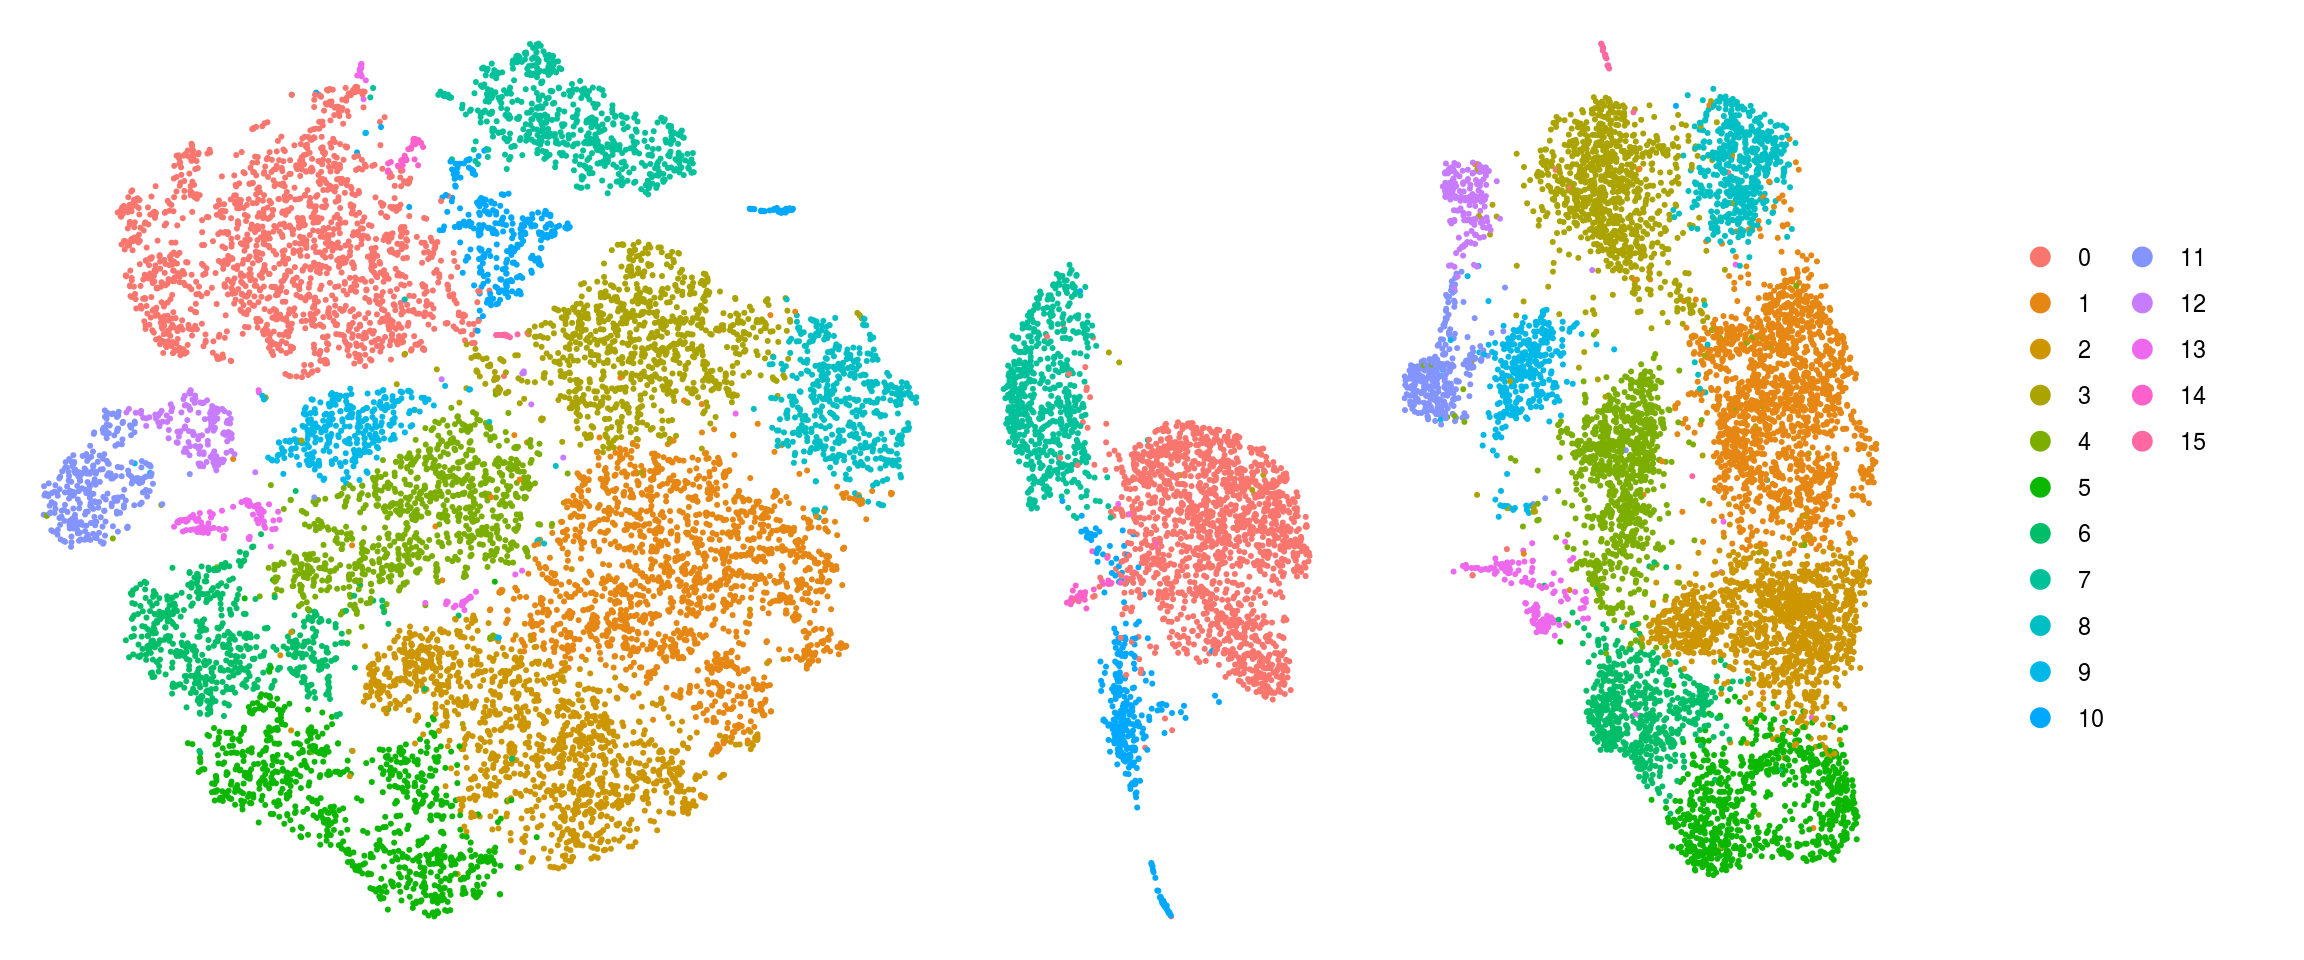
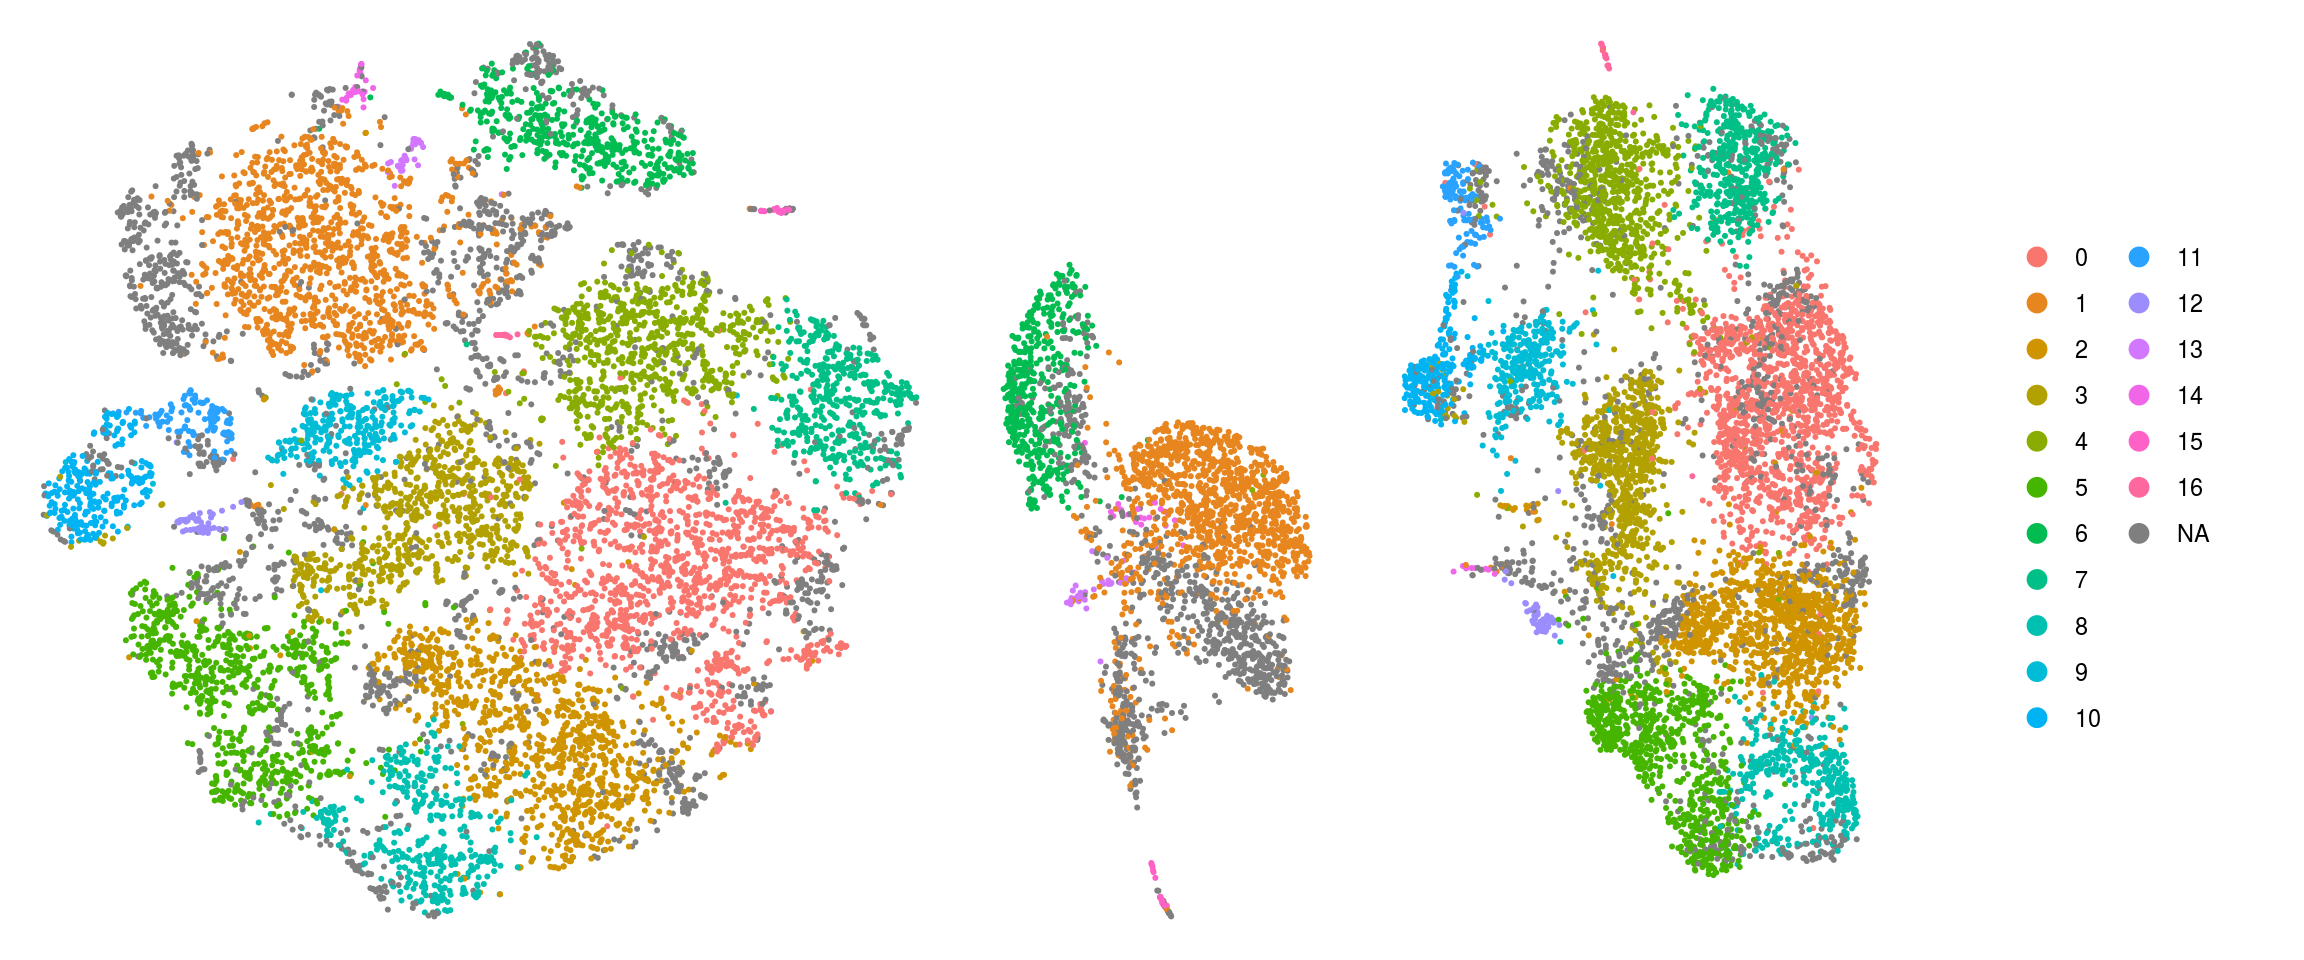
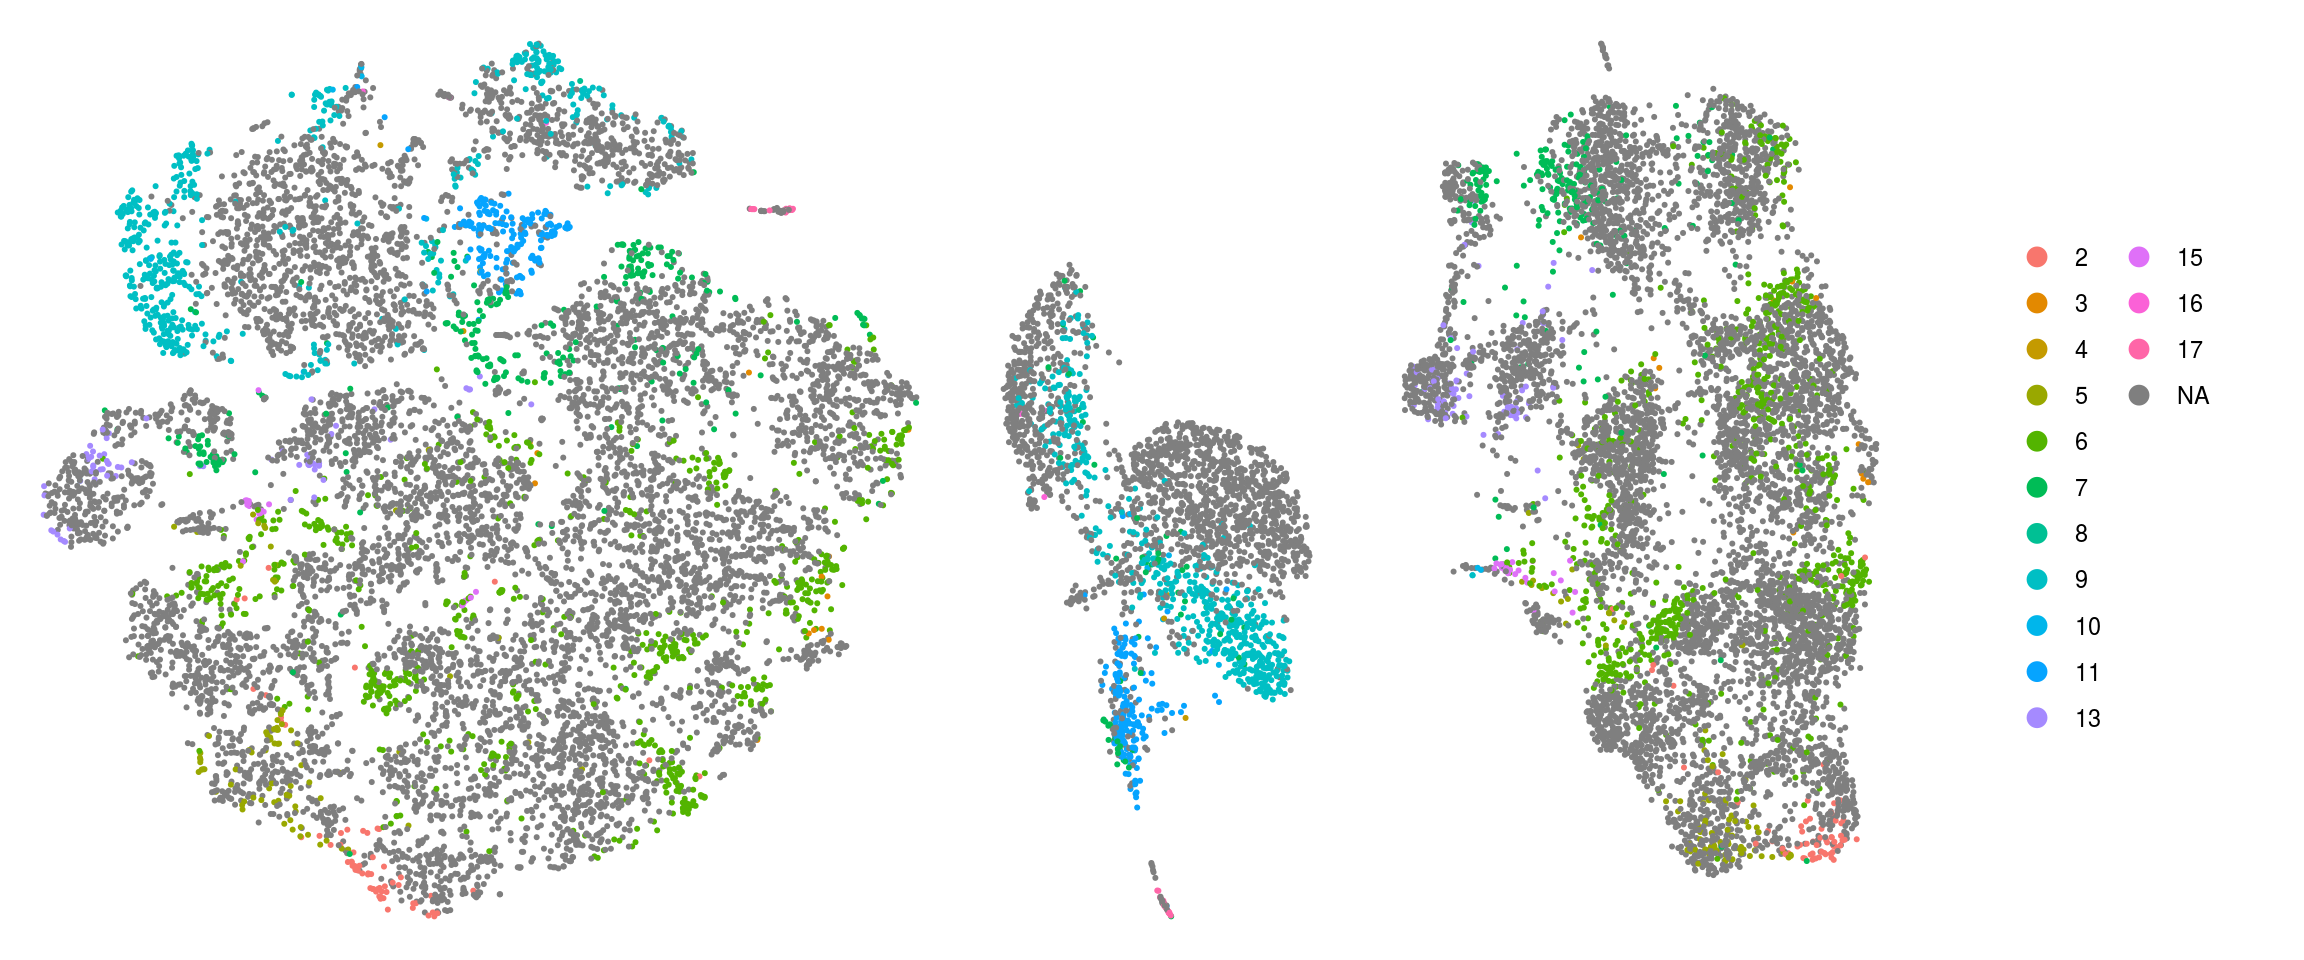
DR with cells colored by individial clustering
We show the cluster membership of the individual clustering in the combined UMAP.
## combined clustering so$RNA_snn_res.0.4
## individual clustering: we want to use the one from figure 2B
## --> so_06-clustering_all_timepoints.rds
## so_tdp$RNA_snn_res.0.4 (TDP-HA)
# we lost the individual clustering of the TDP-HA samples,
# and will add them to the so object
so$TDPHA_snn_res.0.4 <- NA
## iterate through each sample and add the corresponding cluster ids
for( s in unique(so_tdp$sample_id)){
  ind <- so$sample_id == s
  ind_tdp <- so_tdp$sample_id == s
  so$TDPHA_snn_res.0.4[ind] <- as.character(so_tdp$RNA_snn_res.0.4[ind_tdp][match(so$barcode[ind],
                                                      so_tdp$barcode[ind_tdp])])
}
so$TDPHA_snn_res.0.4 <- factor(so$TDPHA_snn_res.0.4,
                               levels = as.character(0:16))
so$integrated_snn_res.0.4  <- factor(so$integrated_snn_res.0.4,
                                     levels = as.character(0:16))

## we also add the individual clustering of the D96 samples
so_ind <- readRDS(file.path("output", "so_06-clustering_all_timepoints.rds"))
so$D96_snn_res.0.4 <- NA
## iterate through each sample and add the corresponding cluster ids
for( s in c("5NC96", "6NC96")){
  ind <- so$sample_id == s
  ind_d96 <- so_ind$sample_id == s
  so$D96_snn_res.0.4[ind] <- as.character(so_ind$RNA_snn_res.0.4[ind_d96][match(so$barcode[ind],
                                                      so_ind$barcode[ind_d96])])
}
so$D96_snn_res.0.4 <- factor(so$D96_snn_res.0.4,
                               levels = as.character(0:18)) %>% droplevels

cs <- sample(colnames(so), 1e4)
.plot_dr <- function(so, dr, id)
    DimPlot(so, cells = cs, group.by = id, reduction = dr, pt.size = 0.4) +
        guides(col = guide_legend(nrow = 11,
            override.aes = list(size = 3, alpha = 1))) +
        theme_void() + theme(aspect.ratio = 1)

ids <- c("group_id", "sample_id", "RNA_snn_res.0.4", "TDPHA_snn_res.0.4",
         "D96_snn_res.0.4")
for (id in ids) {
    cat("## ", id, "\n")
    p1 <- .plot_dr(so, "tsne", id)
    lgd <- get_legend(p1)
    p1 <- p1 + theme(legend.position = "none")
    p2 <- .plot_dr(so, "umap", id) + theme(legend.position = "none")
    ps <- plot_grid(plotlist = list(p1, p2), nrow = 1)
    p <- plot_grid(ps, lgd, nrow = 1, rel_widths = c(1, 0.2))
    print(p)
    cat("\n\n")
}
How are the individal clusters distributed in the combined clustering?
so$RNA_snn_res.0.4 %>% table.
0 1 2 3 4 5 6 7 8 9 10 11 12 13 14 15
6178 6176 4782 3671 3470 3203 2232 2229 1971 1295 1248 1142 675 538 142 51 so$D96_snn_res.0.4 %>% table.
0 2 3 4 5 6 7 8 9 10 11 12 13 15 16 17
1 301 78 19 266 3061 1042 9 2162 37 724 11 275 82 12 53 so$TDPHA_snn_res.0.4 %>% table.
0 1 2 3 4 5 6 7 8 9 10 11 12 13 14 15
5186 4670 3875 3044 2943 2914 1707 1699 1668 1130 939 501 224 137 101 78
16
54 ## D96
## check if cells from the same cluster are still in the same cluster
(n_clusters <- table(so$RNA_snn_res.0.4, so$D96_snn_res.0.4))
        0    2    3    4    5    6    7    8    9   10   11   12   13   15   16
  0     0    0    0   12    0    4  125    0 1614   15   21    1    0    0    6
  1     0    6   43    0    8 1001   16    0    0    0    0    0    0    0    0
  2     0   24    1    1   10  793    1    0    0    0    0    0    0    1    0
  3     0    0    3    0    0   51  583    0    0    0    0    0    7    0    0
  4     0    7   17    1   15  433   15    0    0    0    0    0    8    0    0
  5     0  252    5    0  201   65    2    0    0    0    0    0    0    1    0
  6     1    6    0    0    8  345    4    0    0    0    0    0    1    1    0
  7     0    0    0    0    0    0    9    9  480    0    1   10    0    0    5
  8     0    0    5    0    3  239   33    0    0    0    0    0    1    0    0
  9     0    0    0    1    3   10   23    0    0    0    0    0  110    0    0
  10    0    0    0    4    0    1   65    0   63    0  693    0    0    0    1
  11    0    1    0    0    0    3    6    0    0    0    0    0  143    1    0
  12    0    0    4    0    0    0  151    0    0    0    0    0    5    1    0
  13    0    5    0    0   18  116    8    0    2   22    4    0    0   77    0
  14    0    0    0    0    0    0    0    0    3    0    5    0    0    0    0
  15    0    0    0    0    0    0    1    0    0    0    0    0    0    0    0

       17
  0     0
  1     0
  2     0
  3     0
  4     0
  5     0
  6     0
  7     0
  8     0
  9     0
  10   53
  11    0
  12    0
  13    0
  14    0
  15    0
fqs <- prop.table(n_clusters, margin = 2)
mat <- as.matrix(unclass(fqs))
Heatmap(mat,
col = rev(brewer.pal(11, "RdGy")[-6]),
name = "Frequency",
cluster_rows = FALSE,
cluster_columns = FALSE,
row_names_side = "left",
row_title = "combined clusters",
column_title = "individual clusters",
column_title_side = "bottom",
rect_gp = gpar(col = "white"),
cell_fun = function(i, j, x, y, width, height, fill)
grid.text(round(mat[j, i] * 100, 2), x = x, y = y,
gp = gpar(col = "white", fontsize = 8)))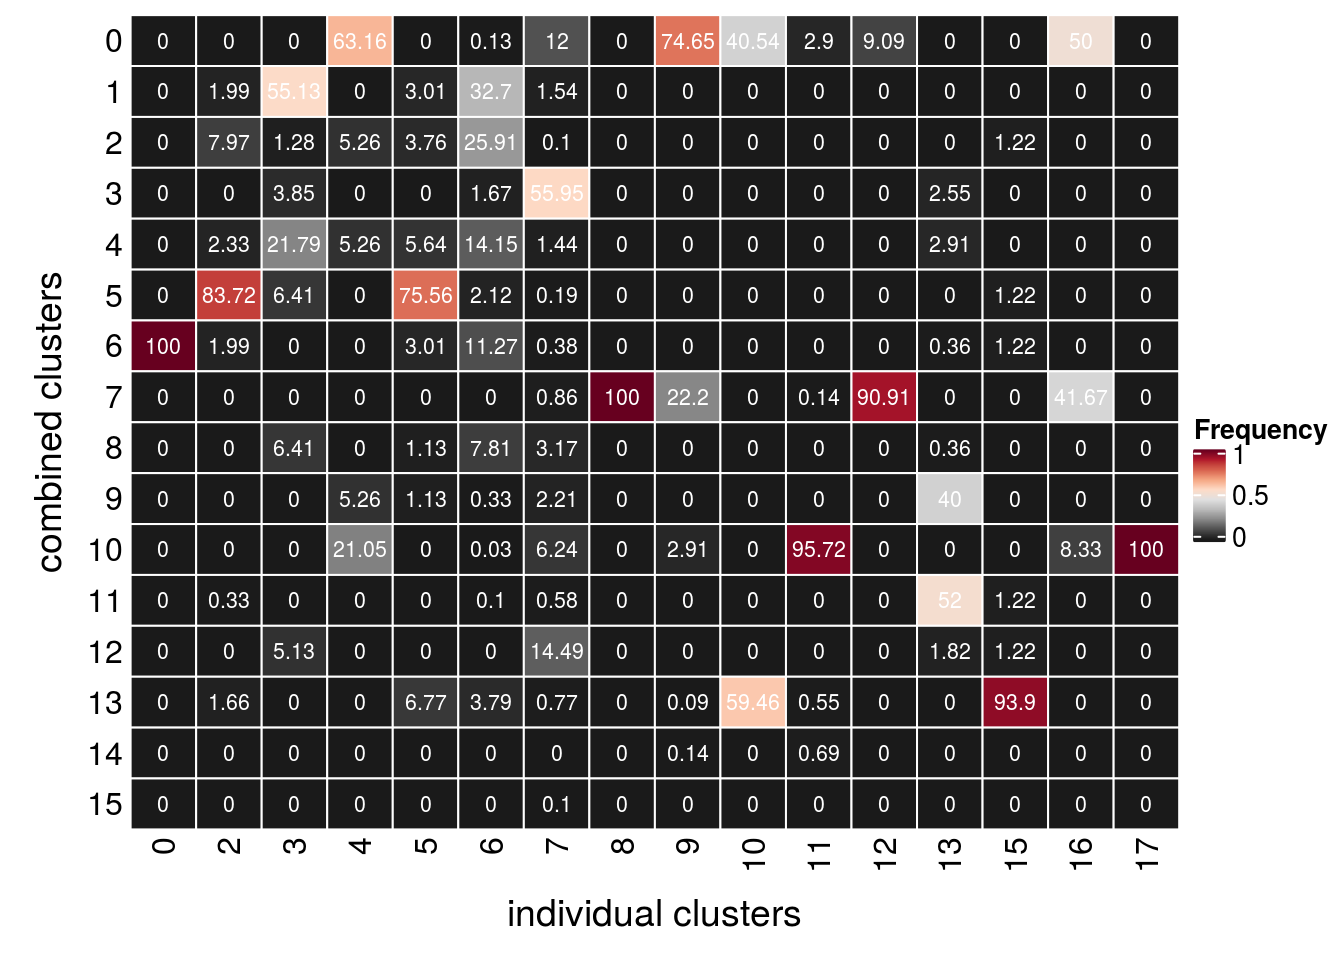
| Version | Author | Date |
|---|---|---|
| 1d6f57b | khembach | 2021-03-11 |
## which of the individual clusters contribute to each combined cluster?
(n_clusters <- table(so$D96_snn_res.0.4, so$RNA_snn_res.0.4))
        0    1    2    3    4    5    6    7    8    9   10   11   12   13   14
  0     0    0    0    0    0    0    1    0    0    0    0    0    0    0    0
  2     0    6   24    0    7  252    6    0    0    0    0    1    0    5    0
  3     0   43    1    3   17    5    0    0    5    0    0    0    4    0    0
  4    12    0    1    0    1    0    0    0    0    1    4    0    0    0    0
  5     0    8   10    0   15  201    8    0    3    3    0    0    0   18    0
  6     4 1001  793   51  433   65  345    0  239   10    1    3    0  116    0
  7   125   16    1  583   15    2    4    9   33   23   65    6  151    8    0
  8     0    0    0    0    0    0    0    9    0    0    0    0    0    0    0
  9  1614    0    0    0    0    0    0  480    0    0   63    0    0    2    3
  10   15    0    0    0    0    0    0    0    0    0    0    0    0   22    0
  11   21    0    0    0    0    0    0    1    0    0  693    0    0    4    5
  12    1    0    0    0    0    0    0   10    0    0    0    0    0    0    0
  13    0    0    0    7    8    0    1    0    1  110    0  143    5    0    0
  15    0    0    1    0    0    1    1    0    0    0    0    1    1   77    0
  16    6    0    0    0    0    0    0    5    0    0    1    0    0    0    0
  17    0    0    0    0    0    0    0    0    0    0   53    0    0    0    0

       15
  0     0
  2     0
  3     0
  4     0
  5     0
  6     0
  7     1
  8     0
  9     0
  10    0
  11    0
  12    0
  13    0
  15    0
  16    0
  17    0
fqs <- prop.table(n_clusters, margin = 2)
mat <- as.matrix(unclass(fqs))
Heatmap(mat,
col = rev(brewer.pal(11, "RdGy")[-6]),
name = "Frequency",
cluster_rows = FALSE,
cluster_columns = FALSE,
row_names_side = "left",
row_title = "individual clusters",
column_title = "combined clusters",
column_title_side = "bottom",
rect_gp = gpar(col = "white"),
cell_fun = function(i, j, x, y, width, height, fill)
grid.text(round(mat[j, i] * 100, 2), x = x, y = y,
gp = gpar(col = "white", fontsize = 8)))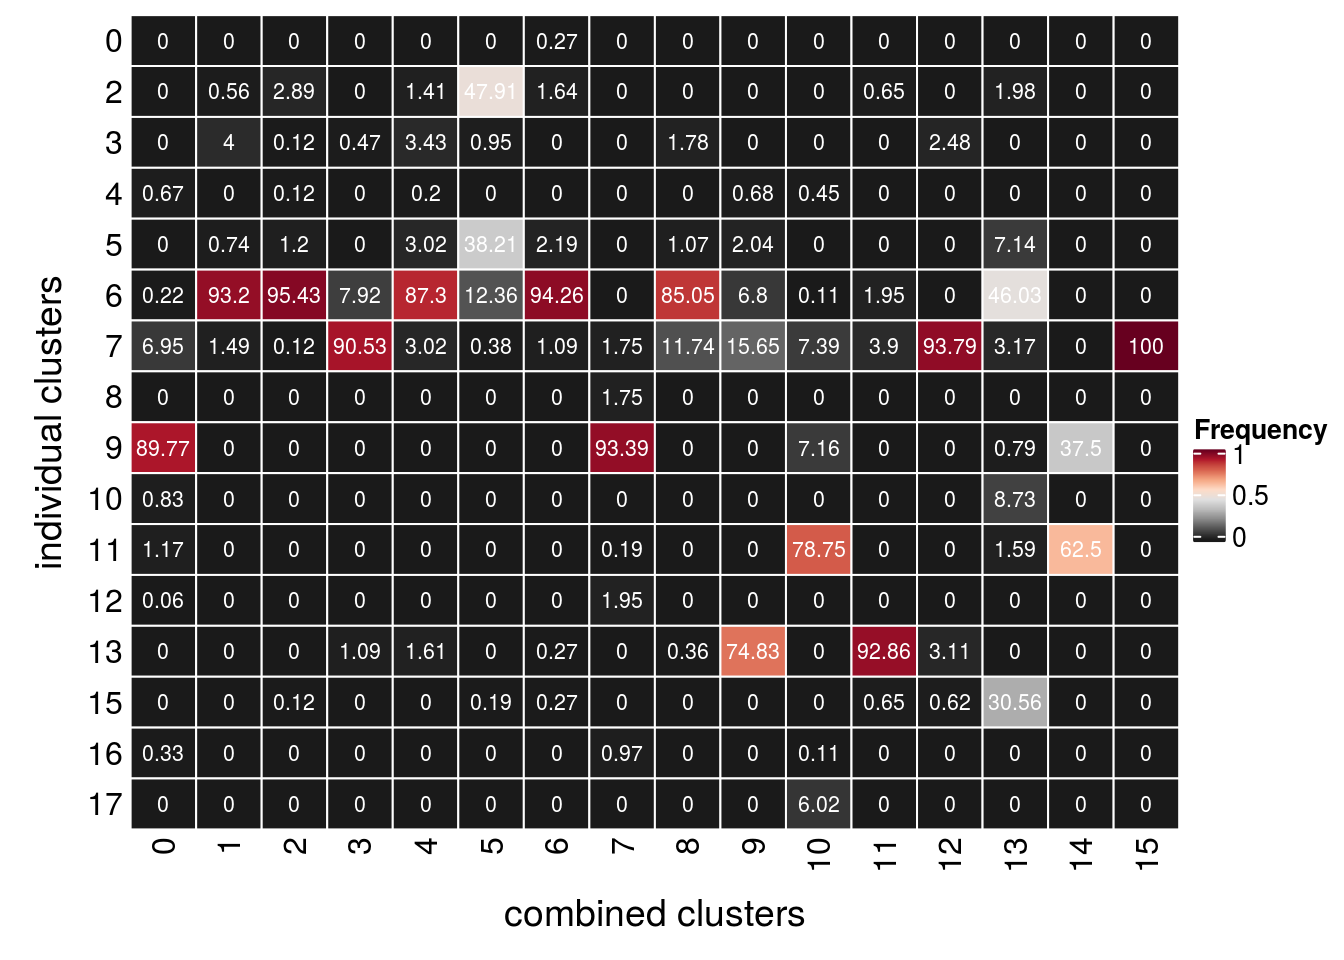
## TDP-HA experiment
(n_clusters <- table(so$RNA_snn_res.0.4, so$TDPHA_snn_res.0.4))
        0    1    2    3    4    5    6    7    8    9   10   11   12   13   14
  0     0 4304    0    0    2    0    6    0    0    0    0    0    0    3   63
  1  5009    2   47   19   11    0    0    9    0    0    1    0    4    0    0
  2    73    2 3754    2    5   14    0    0   99    0    0    0    2    0    0
  3    48   31    0    0 2893    0    0   48    1    3    0    2    0    0    0
  4    23    2    7 2889    3   24    0    0    1   20    4    0    1    0    0
  5     1    0   12    6    0 1085    0    0 1566    0    0    0    7    0    0
  6     1    2   20   63    1 1778    0    0    0    1    0    0    0    0    0
  7     0   10    0    0    0    0 1700    0    0    0    0    0    1    0    3
  8    23    2    0    9   13    0    0 1642    0    0    0    0    1    0    0
  9     0    5   25   12    6    0    0    0    0 1095    4    1    0    0    0
  10    0  286    0    0    0    0    1    0    0    0    0    0    0    3    0
  11    0    0    0   41    0    1    0    0    0    9  929    3    3    0    0
  12    6    0    1    0    7    1    0    0    0    2    1  495    1    0    0
  13    2   20    9    3    1   11    0    0    1    0    0    0  204    0   35
  14    0    3    0    0    0    0    0    0    0    0    0    0    0  131    0
  15    0    1    0    0    1    0    0    0    0    0    0    0    0    0    0

       15   16
  0     0    2
  1     0    0
  2     0    0
  3     0    1
  4     0    0
  5     0    0
  6     0    0
  7     0    1
  8     0    0
  9     0    0
  10   78    0
  11    0    2
  12    0    0
  13    0    0
  14    0    0
  15    0   48
fqs <- prop.table(n_clusters, margin = 2)
mat <- as.matrix(unclass(fqs))
Heatmap(mat,
col = rev(brewer.pal(11, "RdGy")[-6]),
name = "Frequency",
cluster_rows = FALSE,
cluster_columns = FALSE,
row_names_side = "left",
row_title = "combined clusters",
column_title = "individual clusters",
column_title_side = "bottom",
rect_gp = gpar(col = "white"),
cell_fun = function(i, j, x, y, width, height, fill)
grid.text(round(mat[j, i] * 100, 2), x = x, y = y,
gp = gpar(col = "white", fontsize = 8)))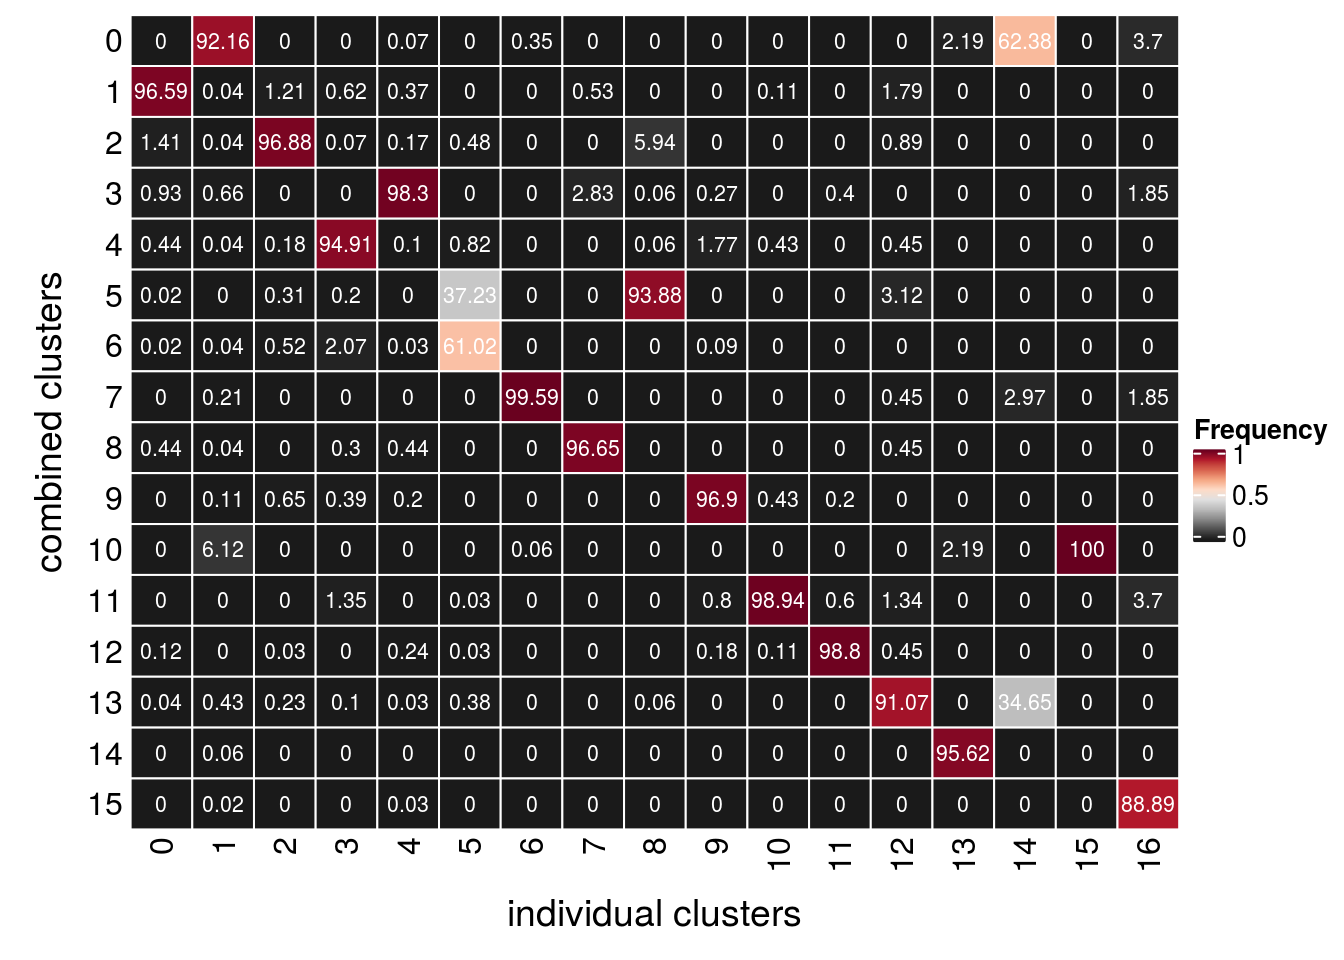
(n_clusters <- table(so$TDPHA_snn_res.0.4, so$RNA_snn_res.0.4))
        0    1    2    3    4    5    6    7    8    9   10   11   12   13   14
  0     0 5009   73   48   23    1    1    0   23    0    0    0    6    2    0
  1  4304    2    2   31    2    0    2   10    2    5  286    0    0   20    3
  2     0   47 3754    0    7   12   20    0    0   25    0    0    1    9    0
  3     0   19    2    0 2889    6   63    0    9   12    0   41    0    3    0
  4     2   11    5 2893    3    0    1    0   13    6    0    0    7    1    0
  5     0    0   14    0   24 1085 1778    0    0    0    0    1    1   11    0
  6     6    0    0    0    0    0    0 1700    0    0    1    0    0    0    0
  7     0    9    0   48    0    0    0    0 1642    0    0    0    0    0    0
  8     0    0   99    1    1 1566    0    0    0    0    0    0    0    1    0
  9     0    0    0    3   20    0    1    0    0 1095    0    9    2    0    0
  10    0    1    0    0    4    0    0    0    0    4    0  929    1    0    0
  11    0    0    0    2    0    0    0    0    0    1    0    3  495    0    0
  12    0    4    2    0    1    7    0    1    1    0    0    3    1  204    0
  13    3    0    0    0    0    0    0    0    0    0    3    0    0    0  131
  14   63    0    0    0    0    0    0    3    0    0    0    0    0   35    0
  15    0    0    0    0    0    0    0    0    0    0   78    0    0    0    0
  16    2    0    0    1    0    0    0    1    0    0    0    2    0    0    0

       15
  0     0
  1     1
  2     0
  3     0
  4     1
  5     0
  6     0
  7     0
  8     0
  9     0
  10    0
  11    0
  12    0
  13    0
  14    0
  15    0
  16   48
fqs <- prop.table(n_clusters, margin = 2)
mat <- as.matrix(unclass(fqs))
Heatmap(mat,
col = rev(brewer.pal(11, "RdGy")[-6]),
name = "Frequency",
cluster_rows = FALSE,
cluster_columns = FALSE,
row_names_side = "left",
row_title = "individual clusters",
column_title = "combined clusters",
column_title_side = "bottom",
rect_gp = gpar(col = "white"),
cell_fun = function(i, j, x, y, width, height, fill)
grid.text(round(mat[j, i] * 100, 2), x = x, y = y,
gp = gpar(col = "white", fontsize = 8)))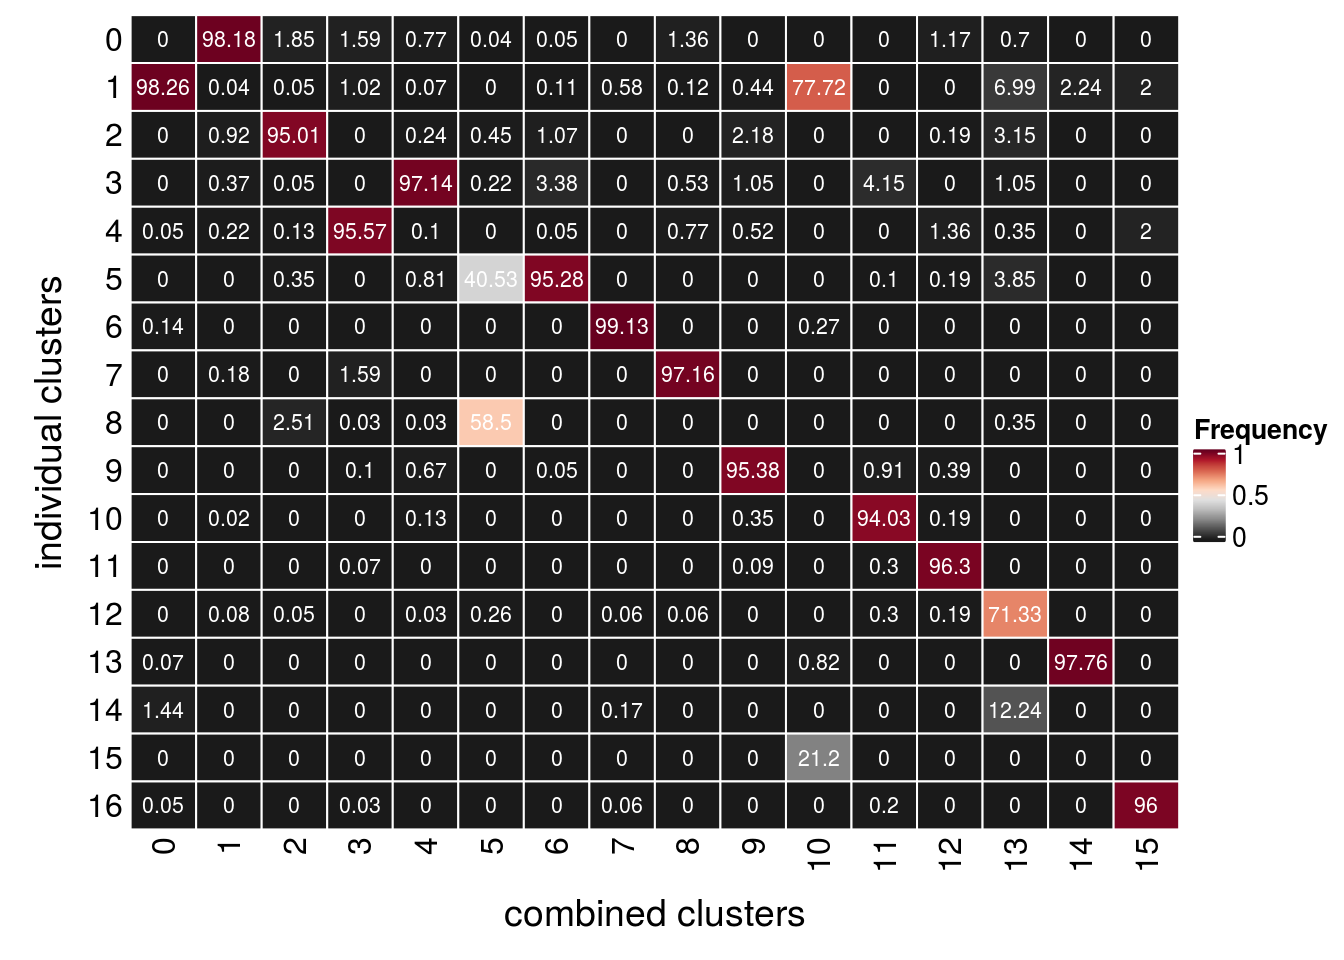
Save Seurat object to RDS
saveRDS(so, file.path("output", "so_08-00_clustering_HA_D96.rds"))
sessionInfo()R version 4.0.0 (2020-04-24)
Platform: x86_64-pc-linux-gnu (64-bit)
Running under: Ubuntu 16.04.7 LTS
Matrix products: default
BLAS: /usr/local/R/R-4.0.0/lib/libRblas.so
LAPACK: /usr/local/R/R-4.0.0/lib/libRlapack.so
locale:
[1] LC_CTYPE=en_US.UTF-8 LC_NUMERIC=C
[3] LC_TIME=en_US.UTF-8 LC_COLLATE=en_US.UTF-8
[5] LC_MONETARY=en_US.UTF-8 LC_MESSAGES=en_US.UTF-8
[7] LC_PAPER=en_US.UTF-8 LC_NAME=C
[9] LC_ADDRESS=C LC_TELEPHONE=C
[11] LC_MEASUREMENT=en_US.UTF-8 LC_IDENTIFICATION=C
attached base packages:
[1] grid parallel stats4 stats graphics grDevices utils
[8] datasets methods base
other attached packages:
[1] viridis_0.5.1 viridisLite_0.3.0
[3] RColorBrewer_1.1-2 ComplexHeatmap_2.4.2
[5] future_1.17.0 SingleCellExperiment_1.10.1
[7] SummarizedExperiment_1.18.1 DelayedArray_0.14.0
[9] matrixStats_0.56.0 Biobase_2.48.0
[11] GenomicRanges_1.40.0 GenomeInfoDb_1.24.2
[13] IRanges_2.22.2 S4Vectors_0.26.1
[15] BiocGenerics_0.34.0 Seurat_3.1.5
[17] cowplot_1.0.0 dplyr_1.0.2
[19] ggplot2_3.3.2 BiocParallel_1.22.0
[21] workflowr_1.6.2
loaded via a namespace (and not attached):
[1] Rtsne_0.15 colorspace_1.4-1 rjson_0.2.20
[4] ellipsis_0.3.1 ggridges_0.5.2 rprojroot_1.3-2
[7] circlize_0.4.10 XVector_0.28.0 GlobalOptions_0.1.2
[10] fs_1.4.2 clue_0.3-57 farver_2.0.3
[13] leiden_0.3.3 listenv_0.8.0 ggrepel_0.8.2
[16] RSpectra_0.16-0 codetools_0.2-16 splines_4.0.0
[19] knitr_1.29 jsonlite_1.7.0 ica_1.0-2
[22] cluster_2.1.0 png_0.1-7 uwot_0.1.8
[25] sctransform_0.2.1 compiler_4.0.0 httr_1.4.1
[28] backports_1.1.9 Matrix_1.2-18 lazyeval_0.2.2
[31] later_1.1.0.1 htmltools_0.5.0 tools_4.0.0
[34] rsvd_1.0.3 igraph_1.2.5 gtable_0.3.0
[37] glue_1.4.2 GenomeInfoDbData_1.2.3 RANN_2.6.1
[40] reshape2_1.4.4 rappdirs_0.3.1 Rcpp_1.0.5
[43] vctrs_0.3.4 ape_5.4 nlme_3.1-148
[46] lmtest_0.9-37 xfun_0.15 stringr_1.4.0
[49] globals_0.12.5 lifecycle_0.2.0 irlba_2.3.3
[52] MASS_7.3-51.6 zlibbioc_1.34.0 zoo_1.8-8
[55] scales_1.1.1 promises_1.1.1 yaml_2.2.1
[58] reticulate_1.16 pbapply_1.4-2 gridExtra_2.3
[61] stringi_1.4.6 shape_1.4.4 rlang_0.4.7
[64] pkgconfig_2.0.3 bitops_1.0-6 evaluate_0.14
[67] lattice_0.20-41 ROCR_1.0-11 purrr_0.3.4
[70] labeling_0.3 patchwork_1.0.1 htmlwidgets_1.5.1
[73] tidyselect_1.1.0 RcppAnnoy_0.0.16 plyr_1.8.6
[76] magrittr_1.5 R6_2.4.1 generics_0.0.2
[79] pillar_1.4.6 whisker_0.4 withr_2.2.0
[82] fitdistrplus_1.1-1 survival_3.2-3 RCurl_1.98-1.2
[85] tibble_3.0.3 future.apply_1.6.0 tsne_0.1-3
[88] crayon_1.3.4 KernSmooth_2.23-17 plotly_4.9.2.1
[91] rmarkdown_2.3 GetoptLong_1.0.1 data.table_1.12.8
[94] git2r_0.27.1 digest_0.6.25 tidyr_1.1.0
[97] httpuv_1.5.4 munsell_0.5.0