Cluster 12 analysis
Katharina Hembach
11/19/2020
Last updated: 2021-06-02
Checks: 7 0
Knit directory: neural_scRNAseq/
This reproducible R Markdown analysis was created with workflowr (version 1.6.2). The Checks tab describes the reproducibility checks that were applied when the results were created. The Past versions tab lists the development history.
Great! Since the R Markdown file has been committed to the Git repository, you know the exact version of the code that produced these results.
Great job! The global environment was empty. Objects defined in the global environment can affect the analysis in your R Markdown file in unknown ways. For reproduciblity it's best to always run the code in an empty environment.
The command set.seed(20200522) was run prior to running the code in the R Markdown file. Setting a seed ensures that any results that rely on randomness, e.g. subsampling or permutations, are reproducible.
Great job! Recording the operating system, R version, and package versions is critical for reproducibility.
Nice! There were no cached chunks for this analysis, so you can be confident that you successfully produced the results during this run.
Great job! Using relative paths to the files within your workflowr project makes it easier to run your code on other machines.
Great! You are using Git for version control. Tracking code development and connecting the code version to the results is critical for reproducibility.
The results in this page were generated with repository version 6ad3baa. See the Past versions tab to see a history of the changes made to the R Markdown and HTML files.
Note that you need to be careful to ensure that all relevant files for the analysis have been committed to Git prior to generating the results (you can use wflow_publish or wflow_git_commit). workflowr only checks the R Markdown file, but you know if there are other scripts or data files that it depends on. Below is the status of the Git repository when the results were generated:
Ignored files:
    Ignored:    .DS_Store
    Ignored:    .Rhistory
    Ignored:    .Rproj.user/
    Ignored:    ._.DS_Store
    Ignored:    ._Filtered.pdf
    Ignored:    ._Rplots.pdf
    Ignored:    ._Unfiltered.pdf
    Ignored:    .__workflowr.yml
    Ignored:    ._coverage.pdf
    Ignored:    ._coverage_sashimi.pdf
    Ignored:    ._coverage_sashimi.png
    Ignored:    ._neural_scRNAseq.Rproj
    Ignored:    ._pbDS_cell_level.pdf
    Ignored:    ._pbDS_top_expr_umap.pdf
    Ignored:    ._pbDS_upset.pdf
    Ignored:    ._sashimi.pdf
    Ignored:    ._stmn2.pdf
    Ignored:    ._tdp.pdf
    Ignored:    analysis/.DS_Store
    Ignored:    analysis/.Rhistory
    Ignored:    analysis/._.DS_Store
    Ignored:    analysis/._01-preprocessing.Rmd
    Ignored:    analysis/._01-preprocessing.html
    Ignored:    analysis/._02.1-SampleQC.Rmd
    Ignored:    analysis/._03-filtering.Rmd
    Ignored:    analysis/._04-clustering.Rmd
    Ignored:    analysis/._04-clustering.knit.md
    Ignored:    analysis/._04.1-cell_cycle.Rmd
    Ignored:    analysis/._05-annotation.Rmd
    Ignored:    analysis/._07-cluster-analysis-all-timepoints.Rmd
    Ignored:    analysis/._Lam-0-NSC_no_integration.Rmd
    Ignored:    analysis/._Lam-01-NSC_integration.Rmd
    Ignored:    analysis/._Lam-02-NSC_annotation.Rmd
    Ignored:    analysis/._NSC-1-clustering.Rmd
    Ignored:    analysis/._NSC-2-annotation.Rmd
    Ignored:    analysis/.__site.yml
    Ignored:    analysis/._additional_filtering.Rmd
    Ignored:    analysis/._additional_filtering_clustering.Rmd
    Ignored:    analysis/._index.Rmd
    Ignored:    analysis/._organoid-01-1-qualtiy-control.Rmd
    Ignored:    analysis/._organoid-01-clustering.Rmd
    Ignored:    analysis/._organoid-02-integration.Rmd
    Ignored:    analysis/._organoid-03-cluster_analysis.Rmd
    Ignored:    analysis/._organoid-04-group_integration.Rmd
    Ignored:    analysis/._organoid-04-stage_integration.Rmd
    Ignored:    analysis/._organoid-05-group_integration_cluster_analysis.Rmd
    Ignored:    analysis/._organoid-05-stage_integration_cluster_analysis.Rmd
    Ignored:    analysis/._organoid-06-1-prepare-sce.Rmd
    Ignored:    analysis/._organoid-06-conos-analysis-Seurat.Rmd
    Ignored:    analysis/._organoid-06-conos-analysis-function.Rmd
    Ignored:    analysis/._organoid-06-conos-analysis.Rmd
    Ignored:    analysis/._organoid-06-group-integration-conos-analysis.Rmd
    Ignored:    analysis/._organoid-07-conos-visualization.Rmd
    Ignored:    analysis/._organoid-07-group-integration-conos-visualization.Rmd
    Ignored:    analysis/._organoid-08-conos-comparison.Rmd
    Ignored:    analysis/._organoid-0x-sample_integration.Rmd
    Ignored:    analysis/01-preprocessing_cache/
    Ignored:    analysis/02-1-SampleQC_cache/
    Ignored:    analysis/02-quality_control_cache/
    Ignored:    analysis/02.1-SampleQC_cache/
    Ignored:    analysis/03-filtering_cache/
    Ignored:    analysis/04-clustering_cache/
    Ignored:    analysis/04.1-cell_cycle_cache/
    Ignored:    analysis/05-annotation_cache/
    Ignored:    analysis/06-clustering-all-timepoints_cache/
    Ignored:    analysis/07-cluster-analysis-all-timepoints_cache/
    Ignored:    analysis/CH-test-01-preprocessing_cache/
    Ignored:    analysis/CH-test-02-transgene-expression_cache/
    Ignored:    analysis/CH-test-03-cluster-analysis_cache/
    Ignored:    analysis/Lam-01-NSC_integration_cache/
    Ignored:    analysis/Lam-02-NSC_annotation_cache/
    Ignored:    analysis/NSC-1-clustering_cache/
    Ignored:    analysis/NSC-2-annotation_cache/
    Ignored:    analysis/TDP-01-preprocessing_cache/
    Ignored:    analysis/TDP-02-quality_control_cache/
    Ignored:    analysis/TDP-03-filtering_cache/
    Ignored:    analysis/TDP-04-clustering_cache/
    Ignored:    analysis/TDP-05-00-filtering-plasmid-QC_cache/
    Ignored:    analysis/TDP-05-plasmid_expression_cache/
    Ignored:    analysis/TDP-06-cluster_analysis_cache/
    Ignored:    analysis/TDP-07-01-STMN2_expression_cache/
    Ignored:    analysis/TDP-08-00-clustering-HA-D96_cache/
    Ignored:    analysis/TDP-08-01-HA-D96-expression-changes_cache/
    Ignored:    analysis/TDP-08-02-TDP_target_genes_cache/
    Ignored:    analysis/TDP-08-clustering-timeline-HA_cache/
    Ignored:    analysis/additional_filtering_cache/
    Ignored:    analysis/additional_filtering_clustering_cache/
    Ignored:    analysis/figure/
    Ignored:    analysis/organoid-01-1-qualtiy-control_cache/
    Ignored:    analysis/organoid-01-clustering_cache/
    Ignored:    analysis/organoid-02-integration_cache/
    Ignored:    analysis/organoid-03-cluster_analysis_cache/
    Ignored:    analysis/organoid-04-group_integration_cache/
    Ignored:    analysis/organoid-04-stage_integration_cache/
    Ignored:    analysis/organoid-05-group_integration_cluster_analysis_cache/
    Ignored:    analysis/organoid-05-stage_integration_cluster_analysis_cache/
    Ignored:    analysis/organoid-06-conos-analysis_cache/
    Ignored:    analysis/organoid-06-conos-analysis_test_cache/
    Ignored:    analysis/organoid-06-group-integration-conos-analysis_cache/
    Ignored:    analysis/organoid-07-conos-visualization_cache/
    Ignored:    analysis/organoid-07-group-integration-conos-visualization_cache/
    Ignored:    analysis/organoid-08-conos-comparison_cache/
    Ignored:    analysis/organoid-0x-sample_integration_cache/
    Ignored:    analysis/sample5_QC_cache/
    Ignored:    analysis/timepoints-01-organoid-integration_cache/
    Ignored:    analysis/timepoints-02-cluster-analysis_cache/
    Ignored:    data/.DS_Store
    Ignored:    data/._.DS_Store
    Ignored:    data/._.smbdeleteAAA17ed8b4b
    Ignored:    data/._Lam_figure2_markers.R
    Ignored:    data/._README.md
    Ignored:    data/._Reactive_astrocytes_markers.xlsx
    Ignored:    data/._known_NSC_markers.R
    Ignored:    data/._known_cell_type_markers.R
    Ignored:    data/._metadata.csv
    Ignored:    data/._virus_cell_tropism_markers.R
    Ignored:    data/._~$Reactive_astrocytes_markers.xlsx
    Ignored:    data/data_sushi/
    Ignored:    data/filtered_feature_matrices/
    Ignored:    output/.DS_Store
    Ignored:    output/._.DS_Store
    Ignored:    output/._NSC_cluster2_marker_genes.txt
    Ignored:    output/._TDP-06-no_integration_cluster12_marker_genes.txt
    Ignored:    output/._TDP-06-no_integration_cluster13_marker_genes.txt
    Ignored:    output/._organoid_integration_cluster1_marker_genes.txt
    Ignored:    output/._tbl_TDP-08-01-muscat_cluster_0.txt
    Ignored:    output/._tbl_TDP-08-01-muscat_cluster_1.txt
    Ignored:    output/._tbl_TDP-08-01-muscat_cluster_10.txt
    Ignored:    output/._tbl_TDP-08-01-muscat_cluster_11.txt
    Ignored:    output/._tbl_TDP-08-01-muscat_cluster_12.txt
    Ignored:    output/._tbl_TDP-08-01-muscat_cluster_13.txt
    Ignored:    output/._tbl_TDP-08-01-muscat_cluster_14.txt
    Ignored:    output/._tbl_TDP-08-01-muscat_cluster_5.txt
    Ignored:    output/._tbl_TDP-08-01-muscat_cluster_7.txt
    Ignored:    output/._tbl_TDP-08-01-muscat_cluster_8.txt
    Ignored:    output/._tbl_TDP-08-01-muscat_cluster_all.xlsx
    Ignored:    output/._tbl_TDP-08-02-targets_hek_cluster_0.txt
    Ignored:    output/._tbl_TDP-08-02-targets_hek_cluster_1.txt
    Ignored:    output/._tbl_TDP-08-02-targets_hek_cluster_10.txt
    Ignored:    output/._tbl_TDP-08-02-targets_hek_cluster_11.txt
    Ignored:    output/._tbl_TDP-08-02-targets_hek_cluster_12.txt
    Ignored:    output/._tbl_TDP-08-02-targets_hek_cluster_13.txt
    Ignored:    output/._tbl_TDP-08-02-targets_hek_cluster_14.txt
    Ignored:    output/._tbl_TDP-08-02-targets_hek_cluster_5.txt
    Ignored:    output/._tbl_TDP-08-02-targets_hek_cluster_7.txt
    Ignored:    output/._tbl_TDP-08-02-targets_hek_cluster_8.txt
    Ignored:    output/._tbl_TDP-08-02-targets_hek_cluster_all.xlsx
    Ignored:    output/._~$tbl_TDP-08-02-targets_hek_cluster_all.xlsx
    Ignored:    output/CH-test-01-preprocessing.rds
    Ignored:    output/CH-test-01-preprocessing_singlets.rds
    Ignored:    output/CH-test-01-preprocessing_singlets_filtered.rds
    Ignored:    output/CH-test-01-preprocessing_so.rds
    Ignored:    output/CH-test-01-preprocessing_so_filtered.rds
    Ignored:    output/CH-test-03-cluster-analysis_so.rds
    Ignored:    output/CH-test-03_scran_markers.rds
    Ignored:    output/Lam-01-clustering.rds
    Ignored:    output/NSC_1_clustering.rds
    Ignored:    output/NSC_cluster1_marker_genes.txt
    Ignored:    output/NSC_cluster2_marker_genes.txt
    Ignored:    output/NSC_cluster3_marker_genes.txt
    Ignored:    output/NSC_cluster4_marker_genes.txt
    Ignored:    output/NSC_cluster5_marker_genes.txt
    Ignored:    output/NSC_cluster6_marker_genes.txt
    Ignored:    output/NSC_cluster7_marker_genes.txt
    Ignored:    output/TDP-06-no_integration_cluster0_marker_genes.txt
    Ignored:    output/TDP-06-no_integration_cluster10_marker_genes.txt
    Ignored:    output/TDP-06-no_integration_cluster11_marker_genes.txt
    Ignored:    output/TDP-06-no_integration_cluster12_marker_genes.txt
    Ignored:    output/TDP-06-no_integration_cluster13_marker_genes.txt
    Ignored:    output/TDP-06-no_integration_cluster14_marker_genes.txt
    Ignored:    output/TDP-06-no_integration_cluster15_marker_genes.txt
    Ignored:    output/TDP-06-no_integration_cluster16_marker_genes.txt
    Ignored:    output/TDP-06-no_integration_cluster17_marker_genes.txt
    Ignored:    output/TDP-06-no_integration_cluster1_marker_genes.txt
    Ignored:    output/TDP-06-no_integration_cluster2_marker_genes.txt
    Ignored:    output/TDP-06-no_integration_cluster3_marker_genes.txt
    Ignored:    output/TDP-06-no_integration_cluster4_marker_genes.txt
    Ignored:    output/TDP-06-no_integration_cluster5_marker_genes.txt
    Ignored:    output/TDP-06-no_integration_cluster6_marker_genes.txt
    Ignored:    output/TDP-06-no_integration_cluster7_marker_genes.txt
    Ignored:    output/TDP-06-no_integration_cluster8_marker_genes.txt
    Ignored:    output/TDP-06-no_integration_cluster9_marker_genes.txt
    Ignored:    output/TDP-06_scran_markers.rds
    Ignored:    output/additional_filtering.rds
    Ignored:    output/conos/
    Ignored:    output/conos_organoid-06-conos-analysis.rds
    Ignored:    output/conos_organoid-06-group-integration-conos-analysis.rds
    Ignored:    output/figures/
    Ignored:    output/organoid_integration_cluster10_marker_genes.txt
    Ignored:    output/organoid_integration_cluster11_marker_genes.txt
    Ignored:    output/organoid_integration_cluster12_marker_genes.txt
    Ignored:    output/organoid_integration_cluster13_marker_genes.txt
    Ignored:    output/organoid_integration_cluster14_marker_genes.txt
    Ignored:    output/organoid_integration_cluster15_marker_genes.txt
    Ignored:    output/organoid_integration_cluster16_marker_genes.txt
    Ignored:    output/organoid_integration_cluster17_marker_genes.txt
    Ignored:    output/organoid_integration_cluster1_marker_genes.txt
    Ignored:    output/organoid_integration_cluster2_marker_genes.txt
    Ignored:    output/organoid_integration_cluster3_marker_genes.txt
    Ignored:    output/organoid_integration_cluster4_marker_genes.txt
    Ignored:    output/organoid_integration_cluster5_marker_genes.txt
    Ignored:    output/organoid_integration_cluster6_marker_genes.txt
    Ignored:    output/organoid_integration_cluster7_marker_genes.txt
    Ignored:    output/organoid_integration_cluster8_marker_genes.txt
    Ignored:    output/organoid_integration_cluster9_marker_genes.txt
    Ignored:    output/res_TDP-08-01-muscat.rds
    Ignored:    output/sce_01_preprocessing.rds
    Ignored:    output/sce_02_quality_control.rds
    Ignored:    output/sce_03_filtering.rds
    Ignored:    output/sce_03_filtering_all_genes.rds
    Ignored:    output/sce_06-1-prepare-sce.rds
    Ignored:    output/sce_TDP-08-01-muscat.rds
    Ignored:    output/sce_TDP_01_preprocessing.rds
    Ignored:    output/sce_TDP_02_quality_control.rds
    Ignored:    output/sce_TDP_03_filtering.rds
    Ignored:    output/sce_TDP_03_filtering_all_genes.rds
    Ignored:    output/sce_organoid-01-clustering.rds
    Ignored:    output/sce_preprocessing.rds
    Ignored:    output/so_04-stage_integration.rds
    Ignored:    output/so_04_1_cell_cycle.rds
    Ignored:    output/so_04_clustering.rds
    Ignored:    output/so_06-clustering_all_timepoints.rds
    Ignored:    output/so_08-00_clustering_HA_D96.rds
    Ignored:    output/so_08-clustering_timeline_HA.rds
    Ignored:    output/so_0x-sample_integration.rds
    Ignored:    output/so_CH-test-02-transgene_expression.rds
    Ignored:    output/so_TDP-06-cluster-analysis.rds
    Ignored:    output/so_TDP_04_clustering.rds
    Ignored:    output/so_TDP_05_plasmid_expression.rds
    Ignored:    output/so_additional_filtering_clustering.rds
    Ignored:    output/so_integrated_organoid-02-integration.rds
    Ignored:    output/so_merged_organoid-02-integration.rds
    Ignored:    output/so_organoid-01-clustering.rds
    Ignored:    output/so_sample_organoid-01-clustering.rds
    Ignored:    output/so_timepoints-01-organoid_integration.rds
    Ignored:    output/tbl_TDP-08-01-muscat.rds
    Ignored:    output/tbl_TDP-08-01-muscat_cluster_0.txt
    Ignored:    output/tbl_TDP-08-01-muscat_cluster_1.txt
    Ignored:    output/tbl_TDP-08-01-muscat_cluster_10.txt
    Ignored:    output/tbl_TDP-08-01-muscat_cluster_11.txt
    Ignored:    output/tbl_TDP-08-01-muscat_cluster_12.txt
    Ignored:    output/tbl_TDP-08-01-muscat_cluster_13.txt
    Ignored:    output/tbl_TDP-08-01-muscat_cluster_14.txt
    Ignored:    output/tbl_TDP-08-01-muscat_cluster_5.txt
    Ignored:    output/tbl_TDP-08-01-muscat_cluster_7.txt
    Ignored:    output/tbl_TDP-08-01-muscat_cluster_8.txt
    Ignored:    output/tbl_TDP-08-01-muscat_cluster_all.xlsx
    Ignored:    output/tbl_TDP-08-02-targets_hek.rds
    Ignored:    output/tbl_TDP-08-02-targets_hek_cluster_0.txt
    Ignored:    output/tbl_TDP-08-02-targets_hek_cluster_1.txt
    Ignored:    output/tbl_TDP-08-02-targets_hek_cluster_10.txt
    Ignored:    output/tbl_TDP-08-02-targets_hek_cluster_11.txt
    Ignored:    output/tbl_TDP-08-02-targets_hek_cluster_12.txt
    Ignored:    output/tbl_TDP-08-02-targets_hek_cluster_13.txt
    Ignored:    output/tbl_TDP-08-02-targets_hek_cluster_14.txt
    Ignored:    output/tbl_TDP-08-02-targets_hek_cluster_5.txt
    Ignored:    output/tbl_TDP-08-02-targets_hek_cluster_7.txt
    Ignored:    output/tbl_TDP-08-02-targets_hek_cluster_8.txt
    Ignored:    output/tbl_TDP-08-02-targets_hek_cluster_all.xlsx
    Ignored:    output/~$tbl_TDP-08-02-targets_hek_cluster_all.xlsx
    Ignored:    scripts/.DS_Store
    Ignored:    scripts/._.DS_Store
    Ignored:    scripts/._bu_Rcode.R
    Ignored:    scripts/._plasmid_expression.sh
    Ignored:    scripts/._plasmid_expression_cell_hashing_test.sh
    Ignored:    scripts/._prepare_salmon_transcripts.R

Untracked files:
    Untracked:  Filtered.pdf
    Untracked:  Rplots.pdf
    Untracked:  Unfiltered
    Untracked:  Unfiltered.pdf
    Untracked:  analysis/Lam-0-NSC_no_integration.Rmd
    Untracked:  analysis/TDP-07-01-STMN2_expression copy.Rmd
    Untracked:  analysis/additional_filtering.Rmd
    Untracked:  analysis/additional_filtering_clustering.Rmd
    Untracked:  analysis/organoid-01-1-qualtiy-control.Rmd
    Untracked:  analysis/organoid-06-conos-analysis-Seurat.Rmd
    Untracked:  analysis/organoid-06-conos-analysis-function.Rmd
    Untracked:  analysis/organoid-07-conos-visualization.Rmd
    Untracked:  analysis/organoid-07-group-integration-conos-visualization.Rmd
    Untracked:  analysis/organoid-08-conos-comparison.Rmd
    Untracked:  analysis/organoid-0x-sample_integration.Rmd
    Untracked:  analysis/sample5_QC.Rmd
    Untracked:  coverage.pdf
    Untracked:  coverage_sashimi.pdf
    Untracked:  coverage_sashimi.png
    Untracked:  data/Homo_sapiens.GRCh38.98.sorted.gtf
    Untracked:  data/Kanton_et_al/
    Untracked:  data/Lam_et_al/
    Untracked:  data/Sep2020/
    Untracked:  data/cell_hashing_test/
    Untracked:  data/cell_hashing_test_FB/
    Untracked:  data/reference/
    Untracked:  data/virus_cell_tropism_markers.R
    Untracked:  data/~$Reactive_astrocytes_markers.xlsx
    Untracked:  pbDS_cell_level.pdf
    Untracked:  pbDS_heatmap.pdf
    Untracked:  pbDS_top_expr_umap.pdf
    Untracked:  pbDS_upset.pdf
    Untracked:  sashimi.pdf
    Untracked:  scripts/bu_Rcode.R
    Untracked:  scripts/bu_code.Rmd
    Untracked:  scripts/plasmid_expression_cell_hashing_test.sh
    Untracked:  scripts/prepare_salmon_transcripts_cell_hashing_test.R
    Untracked:  scripts/salmon-latest_linux_x86_64/
    Untracked:  stmn2.pdf
    Untracked:  tdp.pdf

Unstaged changes:
    Modified:   analysis/05-annotation.Rmd
    Modified:   analysis/TDP-04-clustering.Rmd
    Modified:   analysis/TDP-08-01-HA-D96-expression-changes.Rmd
    Modified:   analysis/_site.yml
    Modified:   analysis/organoid-02-integration.Rmd
    Modified:   analysis/organoid-04-group_integration.Rmd
    Modified:   analysis/organoid-06-conos-analysis.Rmd
    Modified:   analysis/timepoints-02-cluster-analysis.Rmd
Note that any generated files, e.g. HTML, png, CSS, etc., are not included in this status report because it is ok for generated content to have uncommitted changes.
These are the previous versions of the repository in which changes were made to the R Markdown (analysis/TDP-07-cluster_12.Rmd) and HTML (docs/TDP-07-cluster_12.html) files. If you've configured a remote Git repository (see ?wflow_git_remote), click on the hyperlinks in the table below to view the files as they were in that past version.
| File | Version | Author | Date | Message |
|---|---|---|---|---|
| Rmd | 6ad3baa | khembach | 2021-06-02 | add UNC13A to dotplot of downregulated genes |
| html | f16f42c | khembach | 2021-06-02 | Build site. |
| Rmd | a786042 | khembach | 2021-06-02 | analyze UNC13A expression in neuronal clusters of TDP experiment |
| html | b197eb4 | khembach | 2021-05-26 | Build site. |
| Rmd | 7ae9423 | khembach | 2021-05-26 | change size of dots in dot plot |
| html | 35b48c4 | khembach | 2021-05-25 | Build site. |
| Rmd | 1092725 | khembach | 2021-05-25 | add dot plot for cluster 12 marker genes |
| html | 1790d32 | khembach | 2020-11-19 | Build site. |
| Rmd | 8c0edda | khembach | 2020-11-19 | no blocking |
| html | 390fede | khembach | 2020-11-19 | Build site. |
| Rmd | 21d8e8c | khembach | 2020-11-19 | find markers for cluster 12 |
Load packages
library(ComplexHeatmap)
library(cowplot)
library(ggplot2)
library(dplyr)
library(muscat)
library(purrr)
library(RColorBrewer)
library(viridis)
library(scran)
library(Seurat)
library(SingleCellExperiment)
library(stringr)
library(RCurl)
library(BiocParallel)
Load data & convert to SCE
so <- readRDS(file.path("output", "so_TDP-06-cluster-analysis.rds"))
sce <- as.SingleCellExperiment(so, assay = "RNA")
colData(sce) <- as.data.frame(colData(sce)) %>%
    mutate_if(is.character, as.factor) %>%
    DataFrame(row.names = colnames(sce))
so <- SetIdent(so, value = "RNA_snn_res.0.4")
so@meta.data$cluster_id <- Idents(so)
sce$cluster_id <- Idents(so)
Find markers specific for cluster 12
Markers
We want to find markers that are specific for cluster 12 (TDP-HA positive cells). We are interested in markers that separate cluster 12 from ALL other clusters or only a subset of clusters. Additionally, we compare cluster 12 to only the neuronal clusters.
We identify candidate marker genes for each cluster that enable a separation of that group from any other group. The null hypothesis is that the log FC between a cluster and the compared cluster is 2.
We first subset the data to the neuronal clusters.
neuronal_clusters <- c(0, 2:5, 7:11, 12)
sce_sub <- sce[,sce$cluster_id %in% neuronal_clusters]
dim(sce)
[1] 13970 30870dim(sce_sub)[1] 13970 24123## marker for any other cluster
## UP
any_up <- findMarkers(sce_sub, groups = sce_sub$cluster_id, direction = "up",
lfc = 2, pval.type="any")
## top 10 markers
any_up[["12"]][1:10,1:4]DataFrame with 10 rows and 4 columns
Top p.value FDR summary.logFC
<integer> <numeric> <numeric> <numeric>
ENSG00000106236.NPTX2 1 2.26562e-22 3.16506e-18 2.831270
ENSG00000156427.FGF18 2 9.91261e-01 1.00000e+00 1.867654
ENSG00000183036.PCP4 3 1.00000e+00 1.00000e+00 1.647749
TDP43-HA 3 9.99994e-01 1.00000e+00 1.750398
ENSG00000068305.MEF2A 4 1.00000e+00 1.00000e+00 1.605818
ENSG00000132635.PCED1A 4 1.00000e+00 1.00000e+00 1.400512
ENSG00000116717.GADD45A 6 1.00000e+00 1.00000e+00 1.227090
ENSG00000187240.DYNC2H1 6 1.00000e+00 1.00000e+00 1.089005
ENSG00000130203.APOE 6 1.00000e+00 1.00000e+00 1.112024
ENSG00000197747.S100A10 9 1.00000e+00 1.00000e+00 0.787618## DOWN
any_down <- findMarkers(sce_sub, groups = sce_sub$cluster_id,
direction = "down",
lfc = 2, pval.type="any")
any_down[["12"]][1:10,1:4]DataFrame with 10 rows and 4 columns
Top p.value FDR summary.logFC
<integer> <numeric> <numeric> <numeric>
ENSG00000197747.S100A10 1 1.01182e-05 2.35586e-02 -2.39943
ENSG00000115457.IGFBP2 1 1.00000e+00 1.00000e+00 -1.86749
ENSG00000115461.IGFBP5 1 4.05389e-01 1.00000e+00 -2.06417
ENSG00000171951.SCG2 1 4.50190e-13 1.25783e-09 -2.39547
ENSG00000175426.PCSK1 1 6.20799e-71 2.89085e-67 -2.74919
ENSG00000147571.CRH 1 3.14570e-164 4.39455e-160 -3.45347
ENSG00000049247.UTS2 2 1.46581e-103 1.02386e-99 -3.83757
ENSG00000172020.GAP43 2 1.00000e+00 1.00000e+00 -1.83240
ENSG00000006128.TAC1 2 4.56656e-39 1.59487e-35 -3.23100
ENSG00000128564.VGF 2 2.51249e-03 1.00000e+00 -2.17395## any default parameters
any_default <- findMarkers(sce_sub, groups = sce_sub$cluster_id,
pval.type="any")
any_default[["12"]][1:10,1:4]DataFrame with 10 rows and 4 columns
Top p.value FDR summary.logFC
<integer> <numeric> <numeric> <numeric>
ENSG00000115461.IGFBP5 1 0.00000e+00 2.25788e-321 -1.958679
ENSG00000175426.PCSK1 1 7.15640e-258 5.26183e-255 -2.749195
ENSG00000175445.LPL 1 0.00000e+00 0.00000e+00 -0.550130
ENSG00000147571.CRH 1 0.00000e+00 0.00000e+00 -3.453471
ENSG00000102468.HTR2A 1 0.00000e+00 0.00000e+00 -0.408254
ENSG00000172137.CALB2 1 9.31601e-290 1.08454e-286 -0.779942
ENSG00000147255.IGSF1 1 1.41743e-269 1.41439e-266 -0.350740
ENSG00000115756.HPCAL1 2 1.87907e-234 1.14133e-231 -1.159961
ENSG00000148826.NKX6-2 2 4.71313e-268 4.38950e-265 -0.663511
ENSG00000069431.ABCC9 2 1.71935e-321 3.42776e-318 -1.018577## markers for all other clusters
## UP
all_up <- findMarkers(sce_sub, groups = sce_sub$cluster_id,
direction = "up",
lfc = 2, pval.type="all")
all_up[["12"]][1:10,1:3]DataFrame with 10 rows and 3 columns
p.value FDR summary.logFC
<numeric> <numeric> <numeric>
ENSG00000106236.NPTX2 1.55484e-06 0.0217211 2.364647
ENSG00000156427.FGF18 9.91261e-01 1.0000000 1.807844
TDP43-HA 9.99994e-01 1.0000000 1.732752
ENSG00000132635.PCED1A 1.00000e+00 1.0000000 1.327038
ENSG00000068305.MEF2A 1.00000e+00 1.0000000 1.522896
ENSG00000187240.DYNC2H1 1.00000e+00 1.0000000 0.952902
ENSG00000130203.APOE 1.00000e+00 1.0000000 1.015335
ENSG00000116717.GADD45A 1.00000e+00 1.0000000 1.083348
ENSG00000187244.BCAM 1.00000e+00 1.0000000 0.818770
ENSG00000175197.DDIT3 1.00000e+00 1.0000000 0.684888## DOWN
all_down <- findMarkers(sce_sub, groups = sce_sub$cluster_id,
direction = "down",
lfc = 2, pval.type="all")
all_down[["12"]][1:10,1:3]DataFrame with 10 rows and 3 columns
p.value FDR summary.logFC
<numeric> <numeric> <numeric>
ENSG00000128564.VGF 1 1 -1.486591
ENSG00000171951.SCG2 1 1 -1.476279
ENSG00000172020.GAP43 1 1 -1.171562
ENSG00000243449.C4orf48 1 1 -0.999043
ENSG00000169567.HINT1 1 1 -0.910935
ENSG00000176956.LY6H 1 1 -0.944435
ENSG00000167552.TUBA1A 1 1 -0.706289
ENSG00000205542.TMSB4X 1 1 -0.951074
ENSG00000137285.TUBB2B 1 1 -0.741400
ENSG00000104435.STMN2 1 1 -0.686553## no logFC cutoff and direction
all_default <- findMarkers(sce_sub, groups = sce_sub$cluster_id,
pval.type="all")
all_default[["12"]][1:10,1:3]DataFrame with 10 rows and 3 columns
p.value FDR summary.logFC
<numeric> <numeric> <numeric>
ENSG00000197406.DIO3 2.12946e-101 2.97486e-97 -0.625671
ENSG00000068305.MEF2A 5.34150e-94 3.73104e-90 1.522896
ENSG00000128564.VGF 1.28745e-87 5.99522e-84 -1.486591
ENSG00000106236.NPTX2 6.24255e-86 2.18021e-82 2.377799
ENSG00000171951.SCG2 1.58359e-85 4.42455e-82 -1.525665
ENSG00000171724.VAT1L 9.10156e-82 1.95512e-78 -0.646556
ENSG00000115756.HPCAL1 9.79659e-82 1.95512e-78 -0.472824
TDP43-HA 3.47730e-78 6.07223e-75 1.732752
ENSG00000101489.CELF4 7.88379e-74 1.22374e-70 -0.618175
ENSG00000182870.GALNT9 9.63322e-71 1.34576e-67 -0.320352Heatmap of mean marker-exprs. by cluster
We aggregate the cells to pseudobulks and plot the average expression of the condidate marker genes in each of the clusters.
plot_marker_heatmap <- function(marker, cluster, any = TRUE, top = 1, title = "") {
  u <- marker[[cluster]]
  ## including marker genes of rank 1 to 4
  if(any){
    x <- rownames(u)[u$Top %in% 1:top]
  } else{
    x <- rownames(u)[1:top]
  }

  sub <- sce_sub[unique(x), ]
  pbs <- aggregateData(sub, assay = "logcounts", by = "cluster_id", fun = "mean")
  mat <- t(muscat:::.scale(assay(pbs)))
  ## remove the Ensembl ID from the gene names
  cnames <- colnames(mat)
  colnames(mat) <- str_split(cnames, pattern = "\\.", simplify = TRUE)[,2]
  colnames(mat)[which(colnames(mat) == "")] <- cnames[which(colnames(mat) == "")]

  print(Heatmap(mat,
      name = "scaled avg.\nexpression",
      col = viridis(10),
      cluster_rows = FALSE,
      cluster_columns = FALSE,
      row_names_side = "left",
      row_title = "cluster_id",
      column_title = title,
      rect_gp = gpar(col = "white")))
}

plot_marker_heatmap(any_up, "12", top = 5, title = "any UP")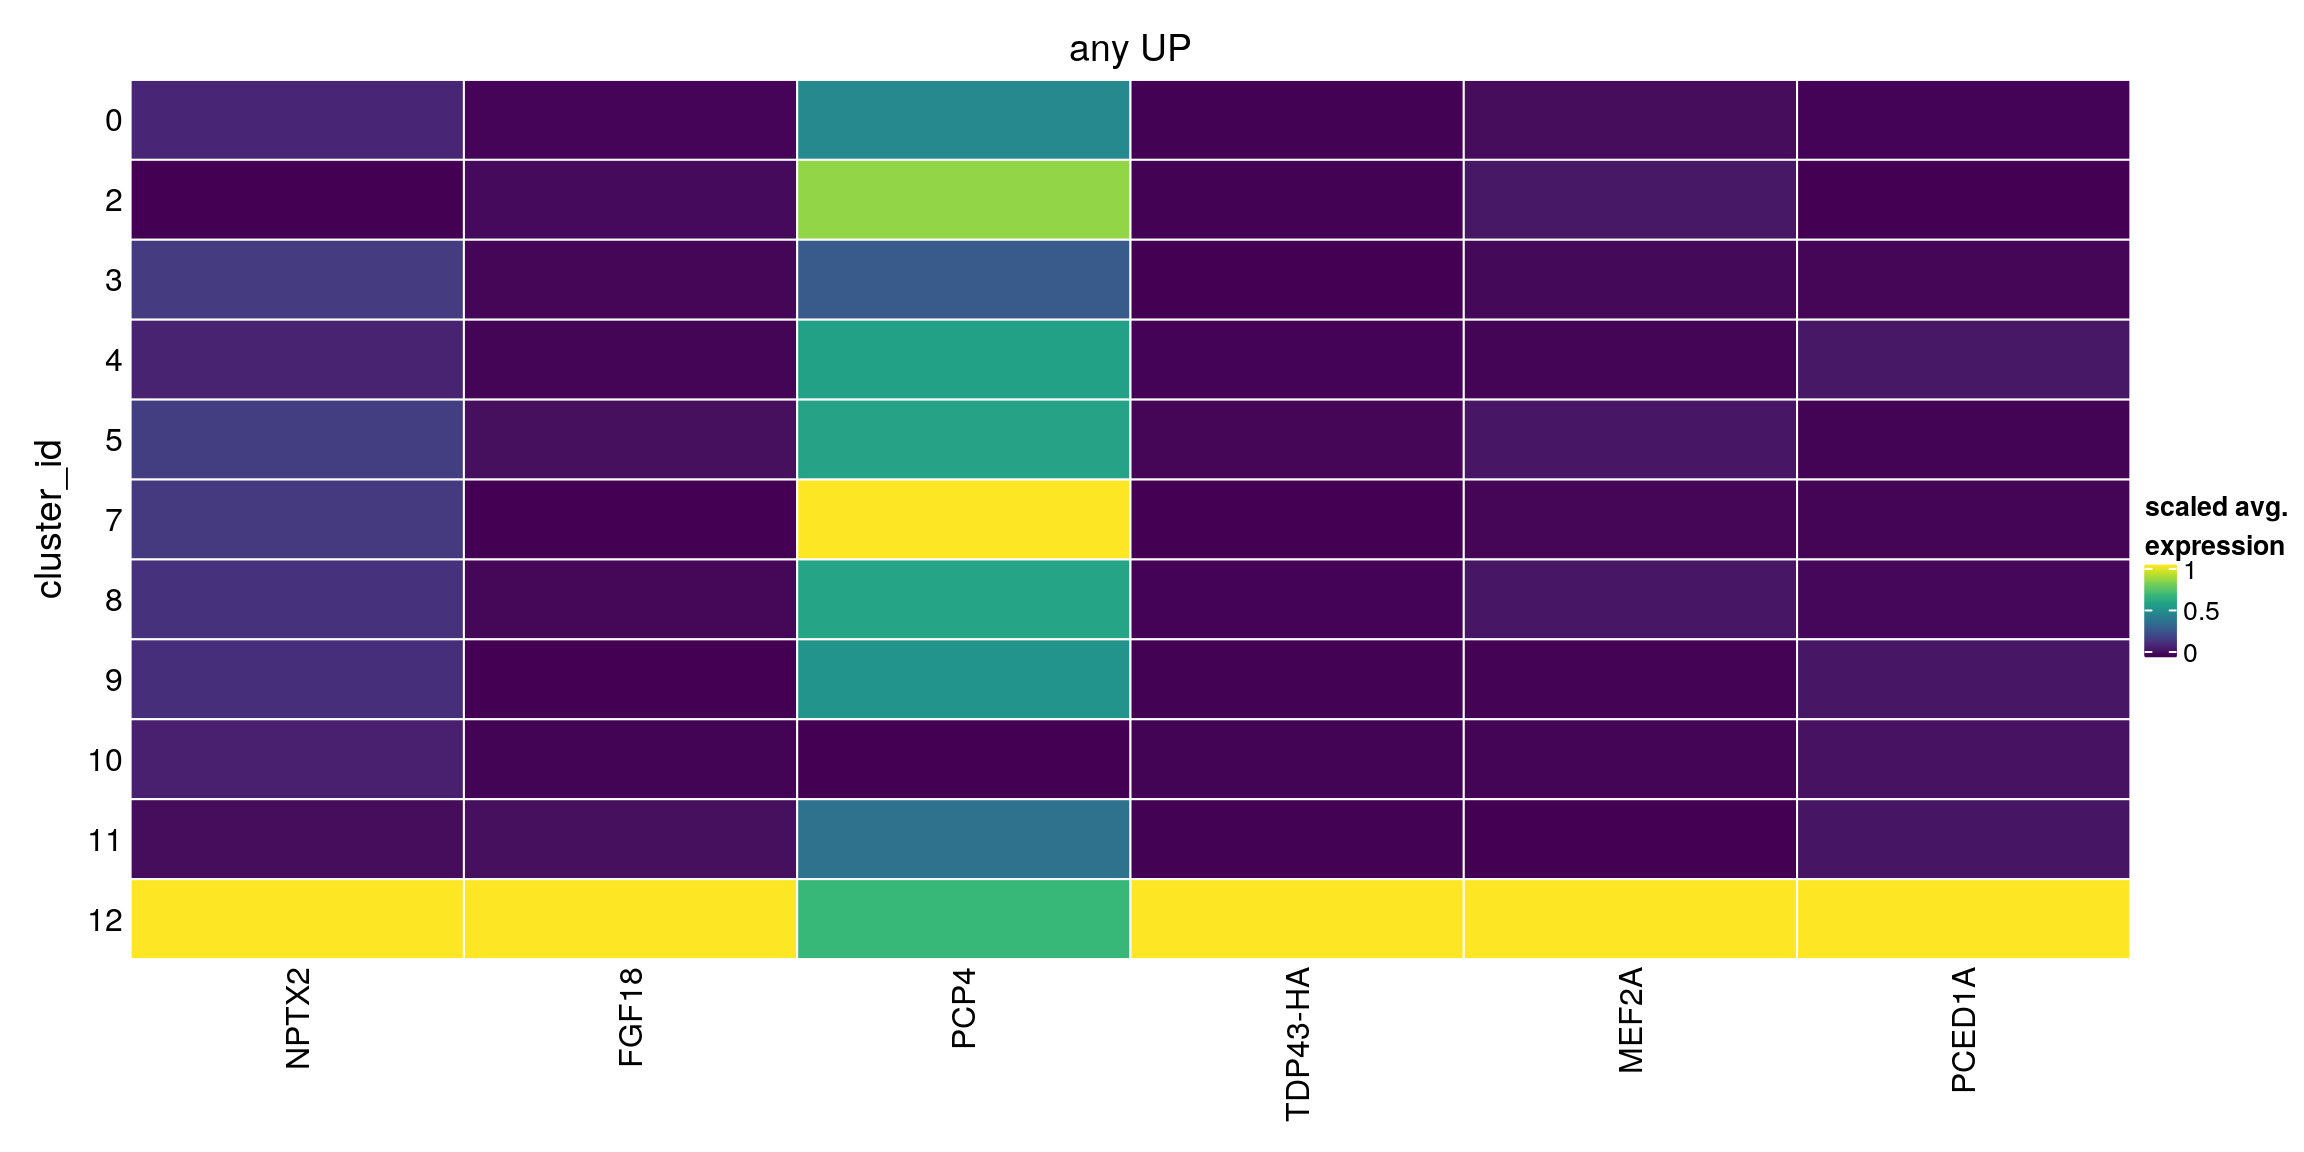
plot_marker_heatmap(any_down, "12", top = 5, title = "any DOWN")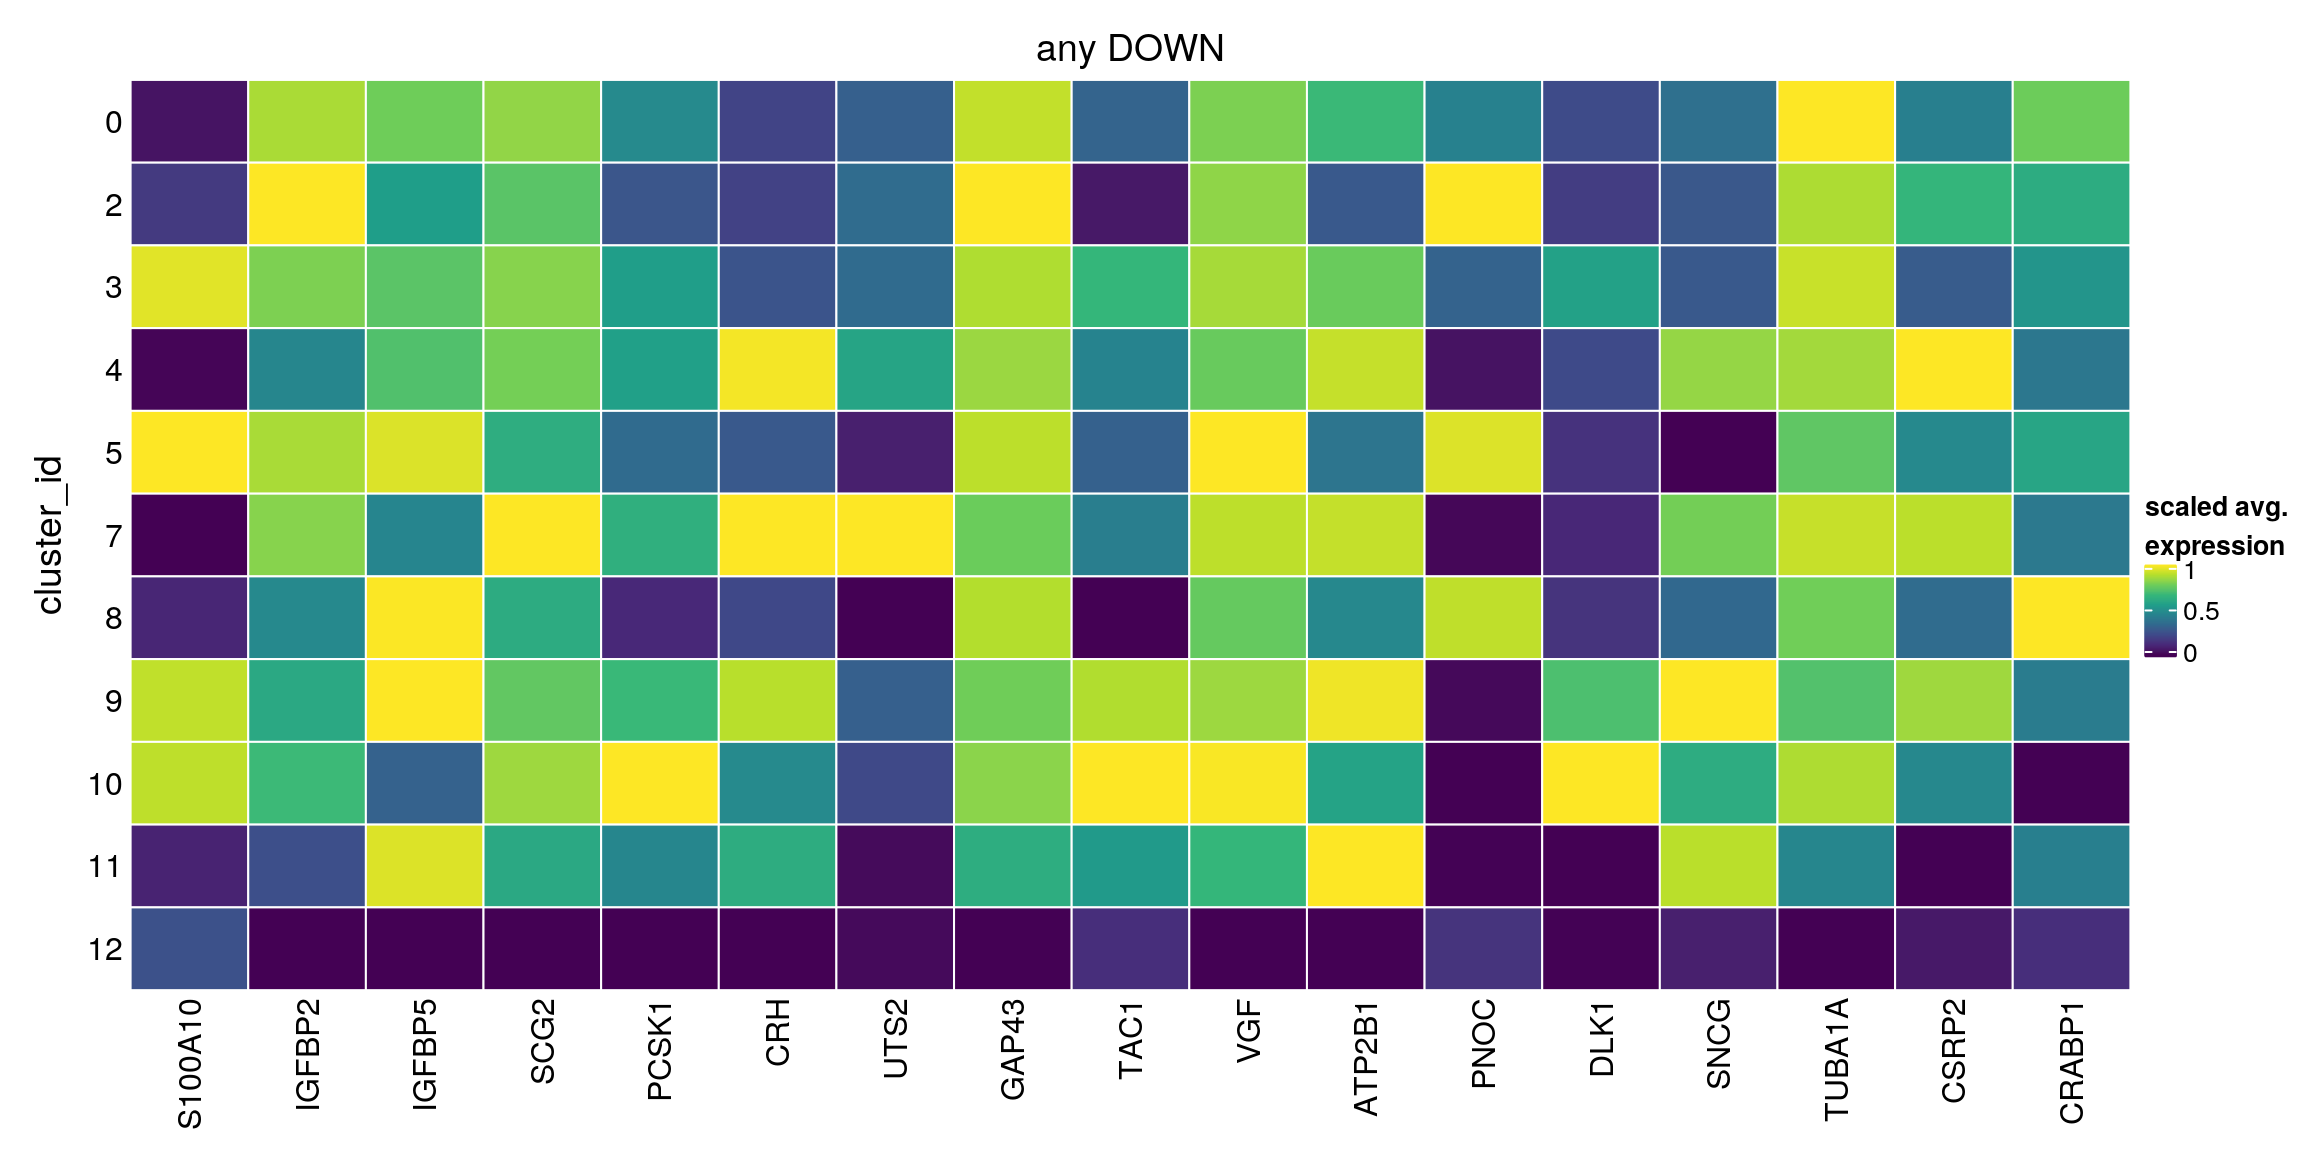
plot_marker_heatmap(any_default, "12", top = 5, title = "any default")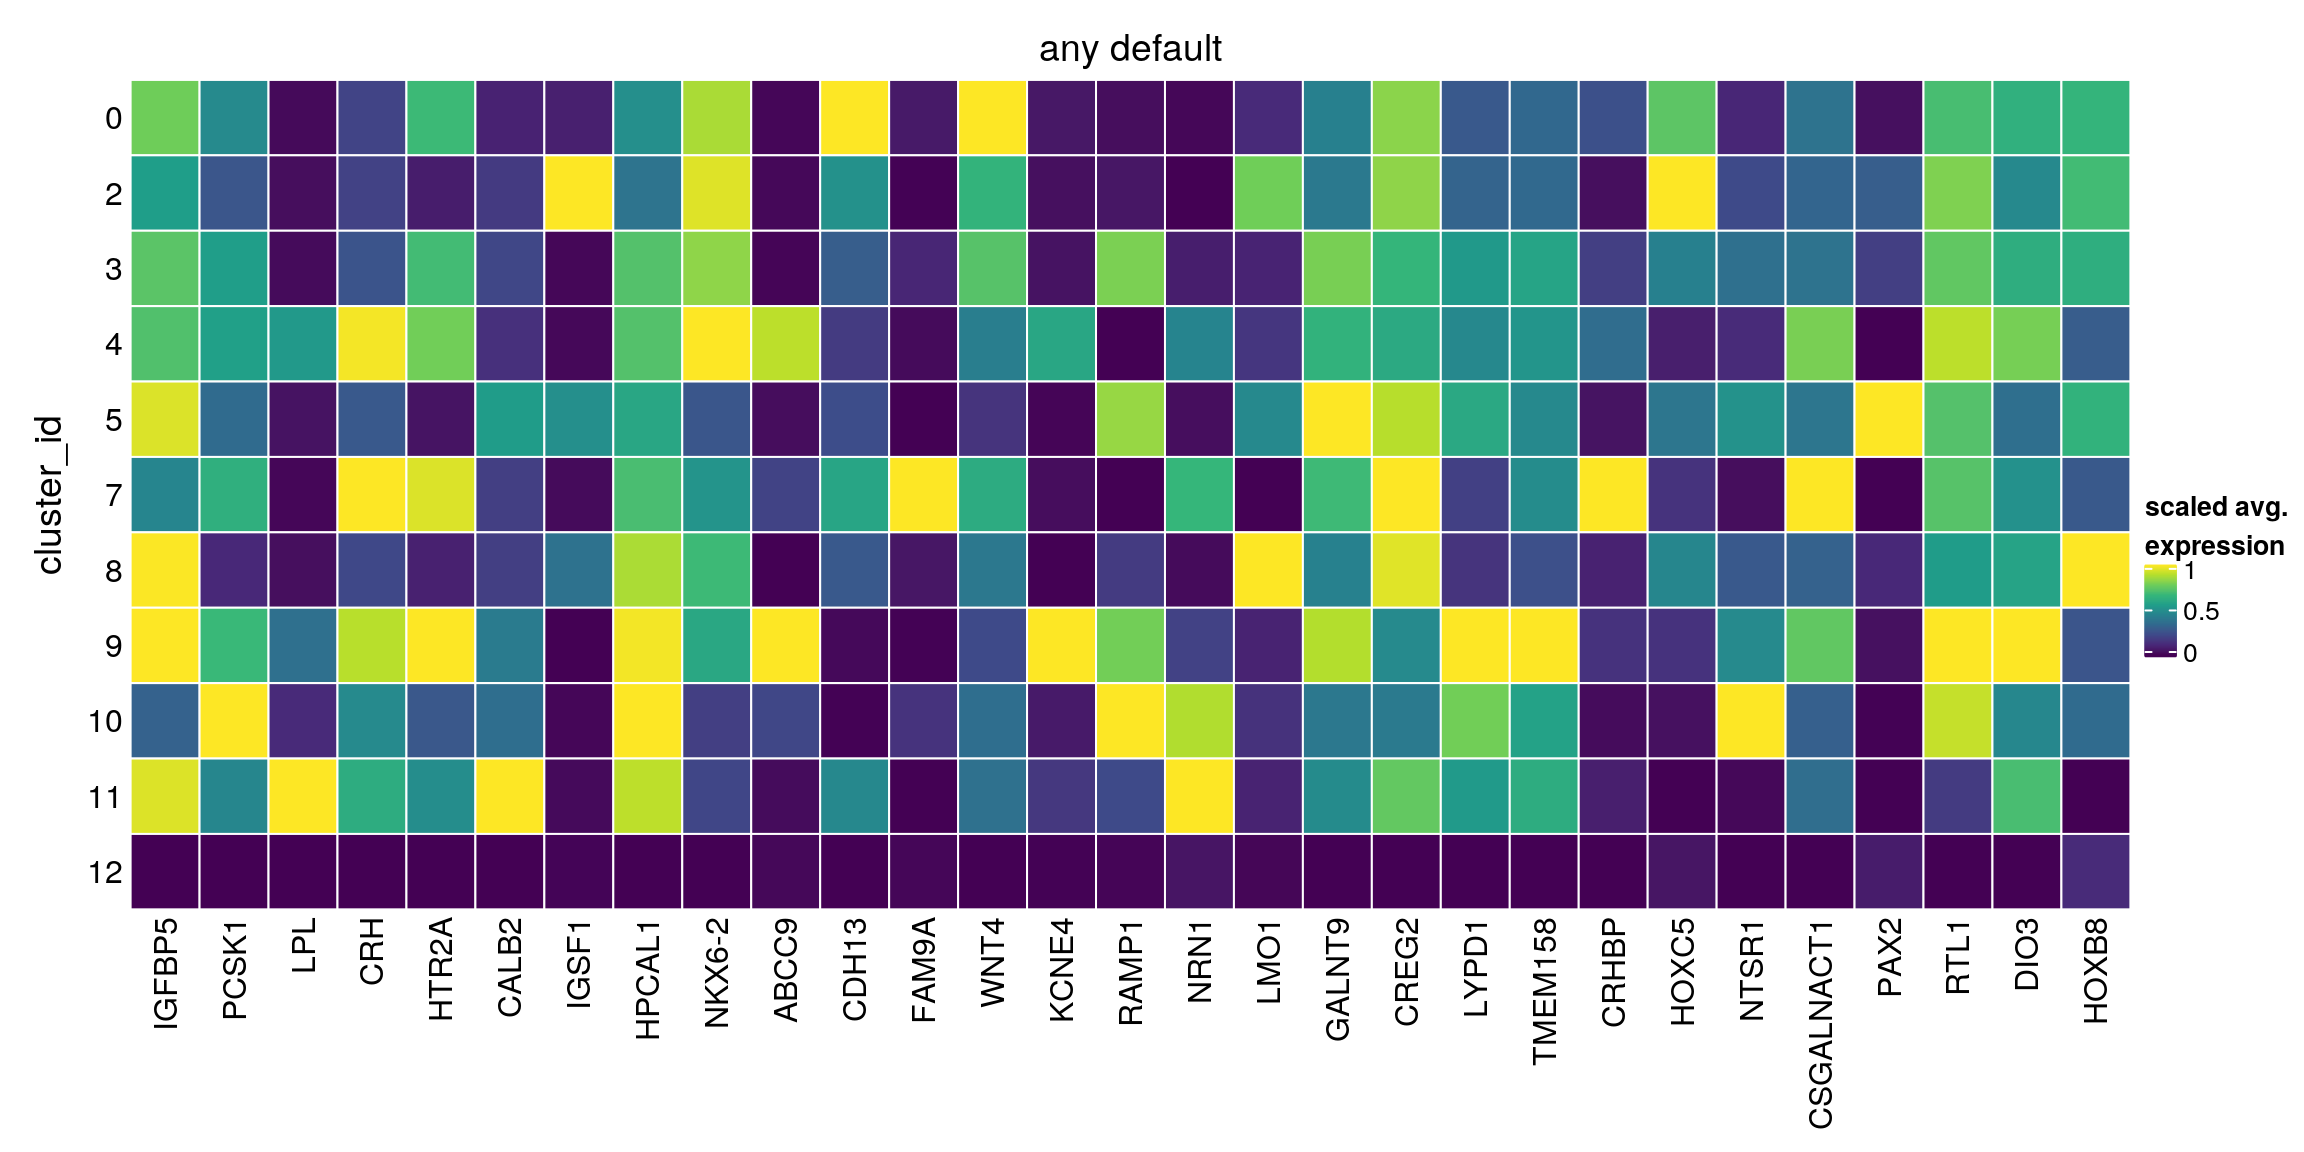
plot_marker_heatmap(all_up, "12", any = FALSE, top = 10, title = "all UP")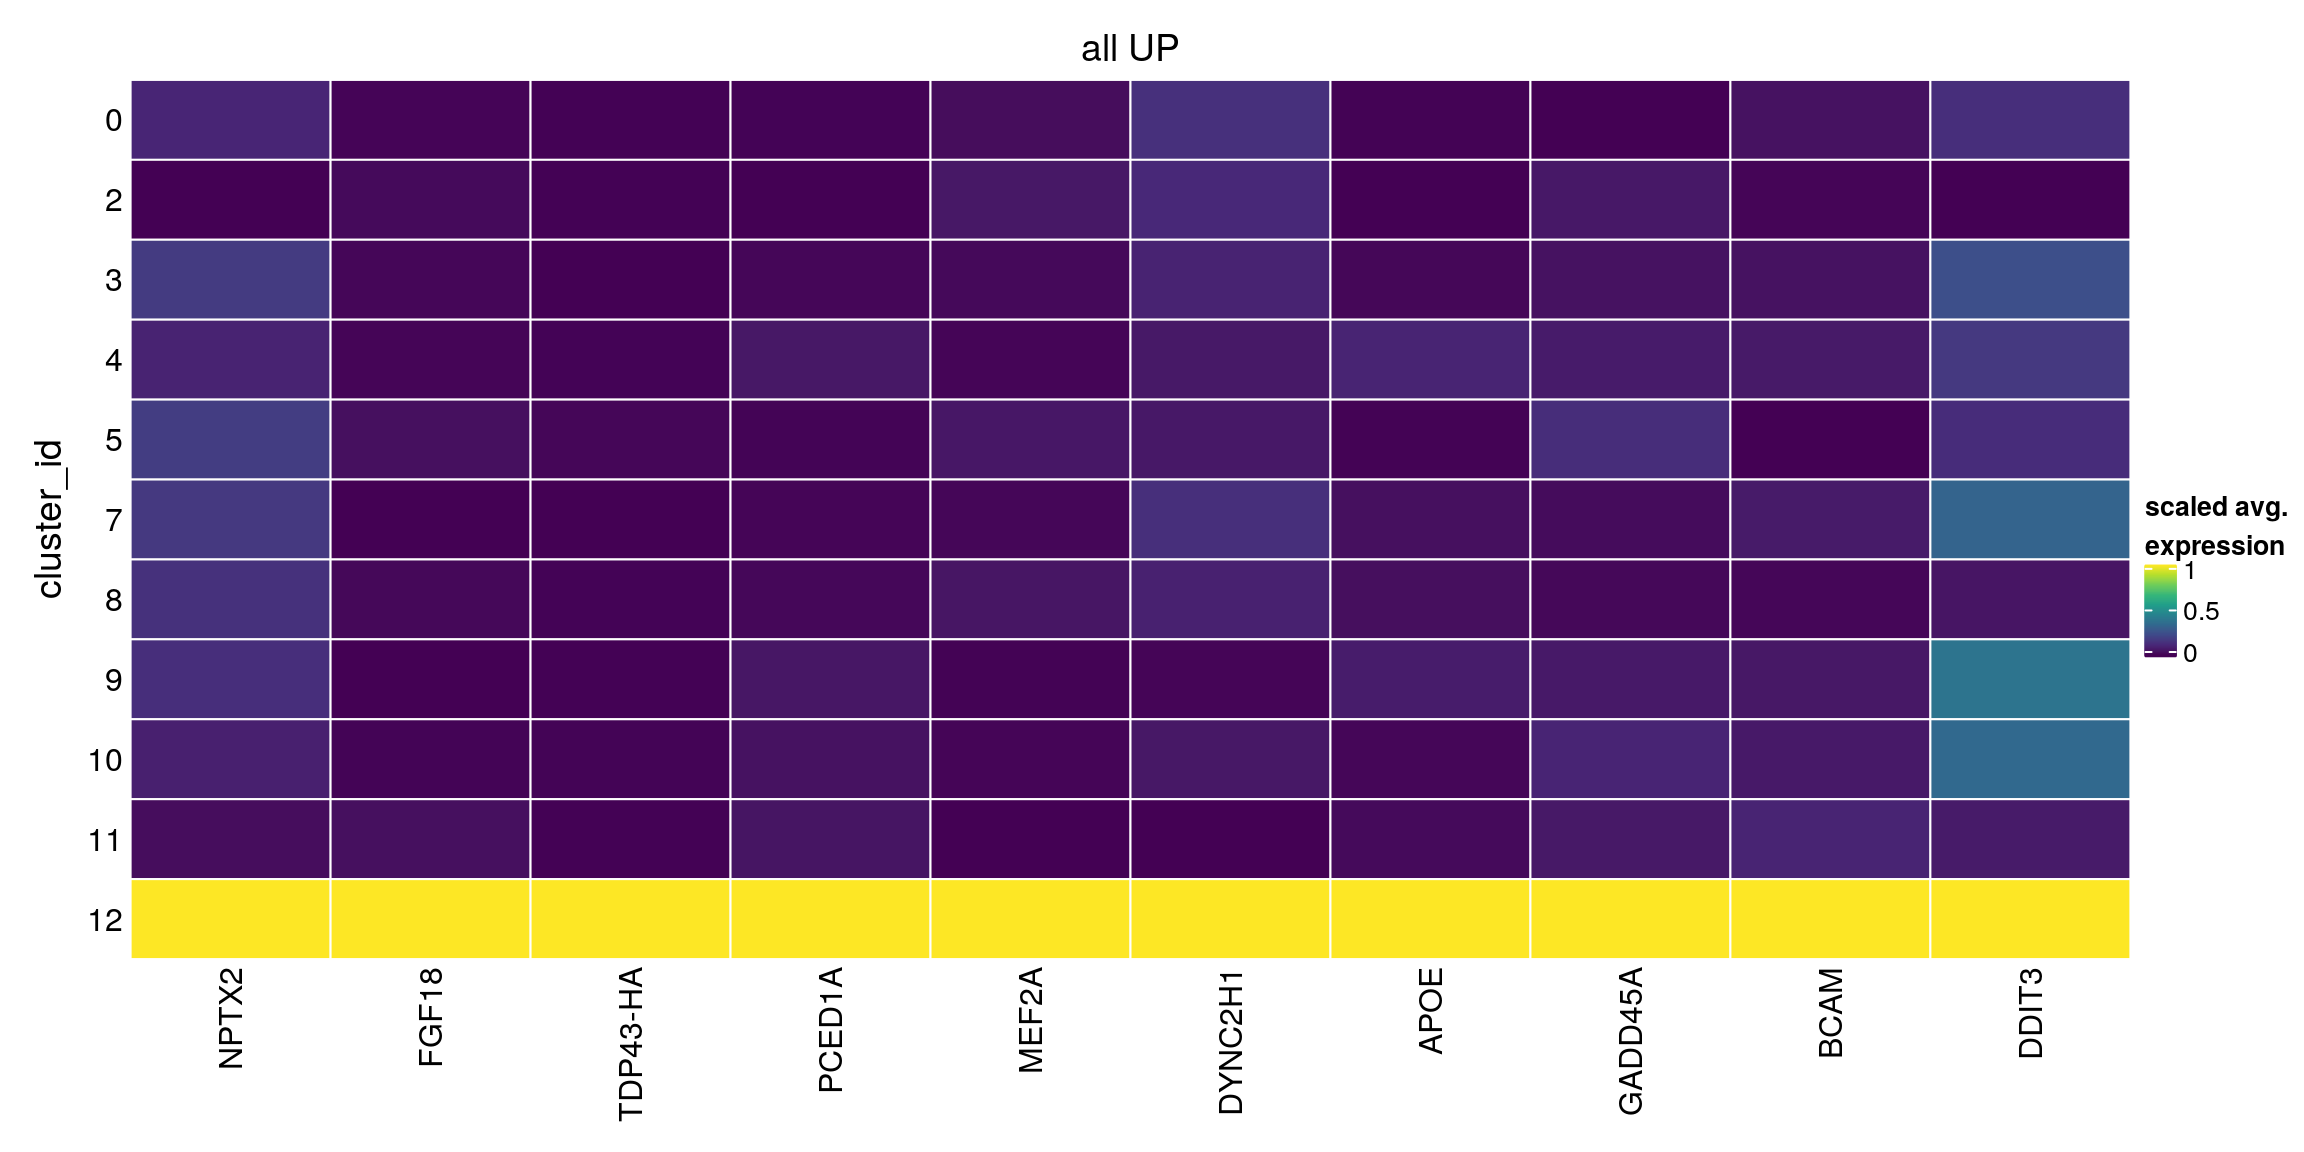
plot_marker_heatmap(all_down, "12", any = FALSE, top = 10, title = "all DOWN")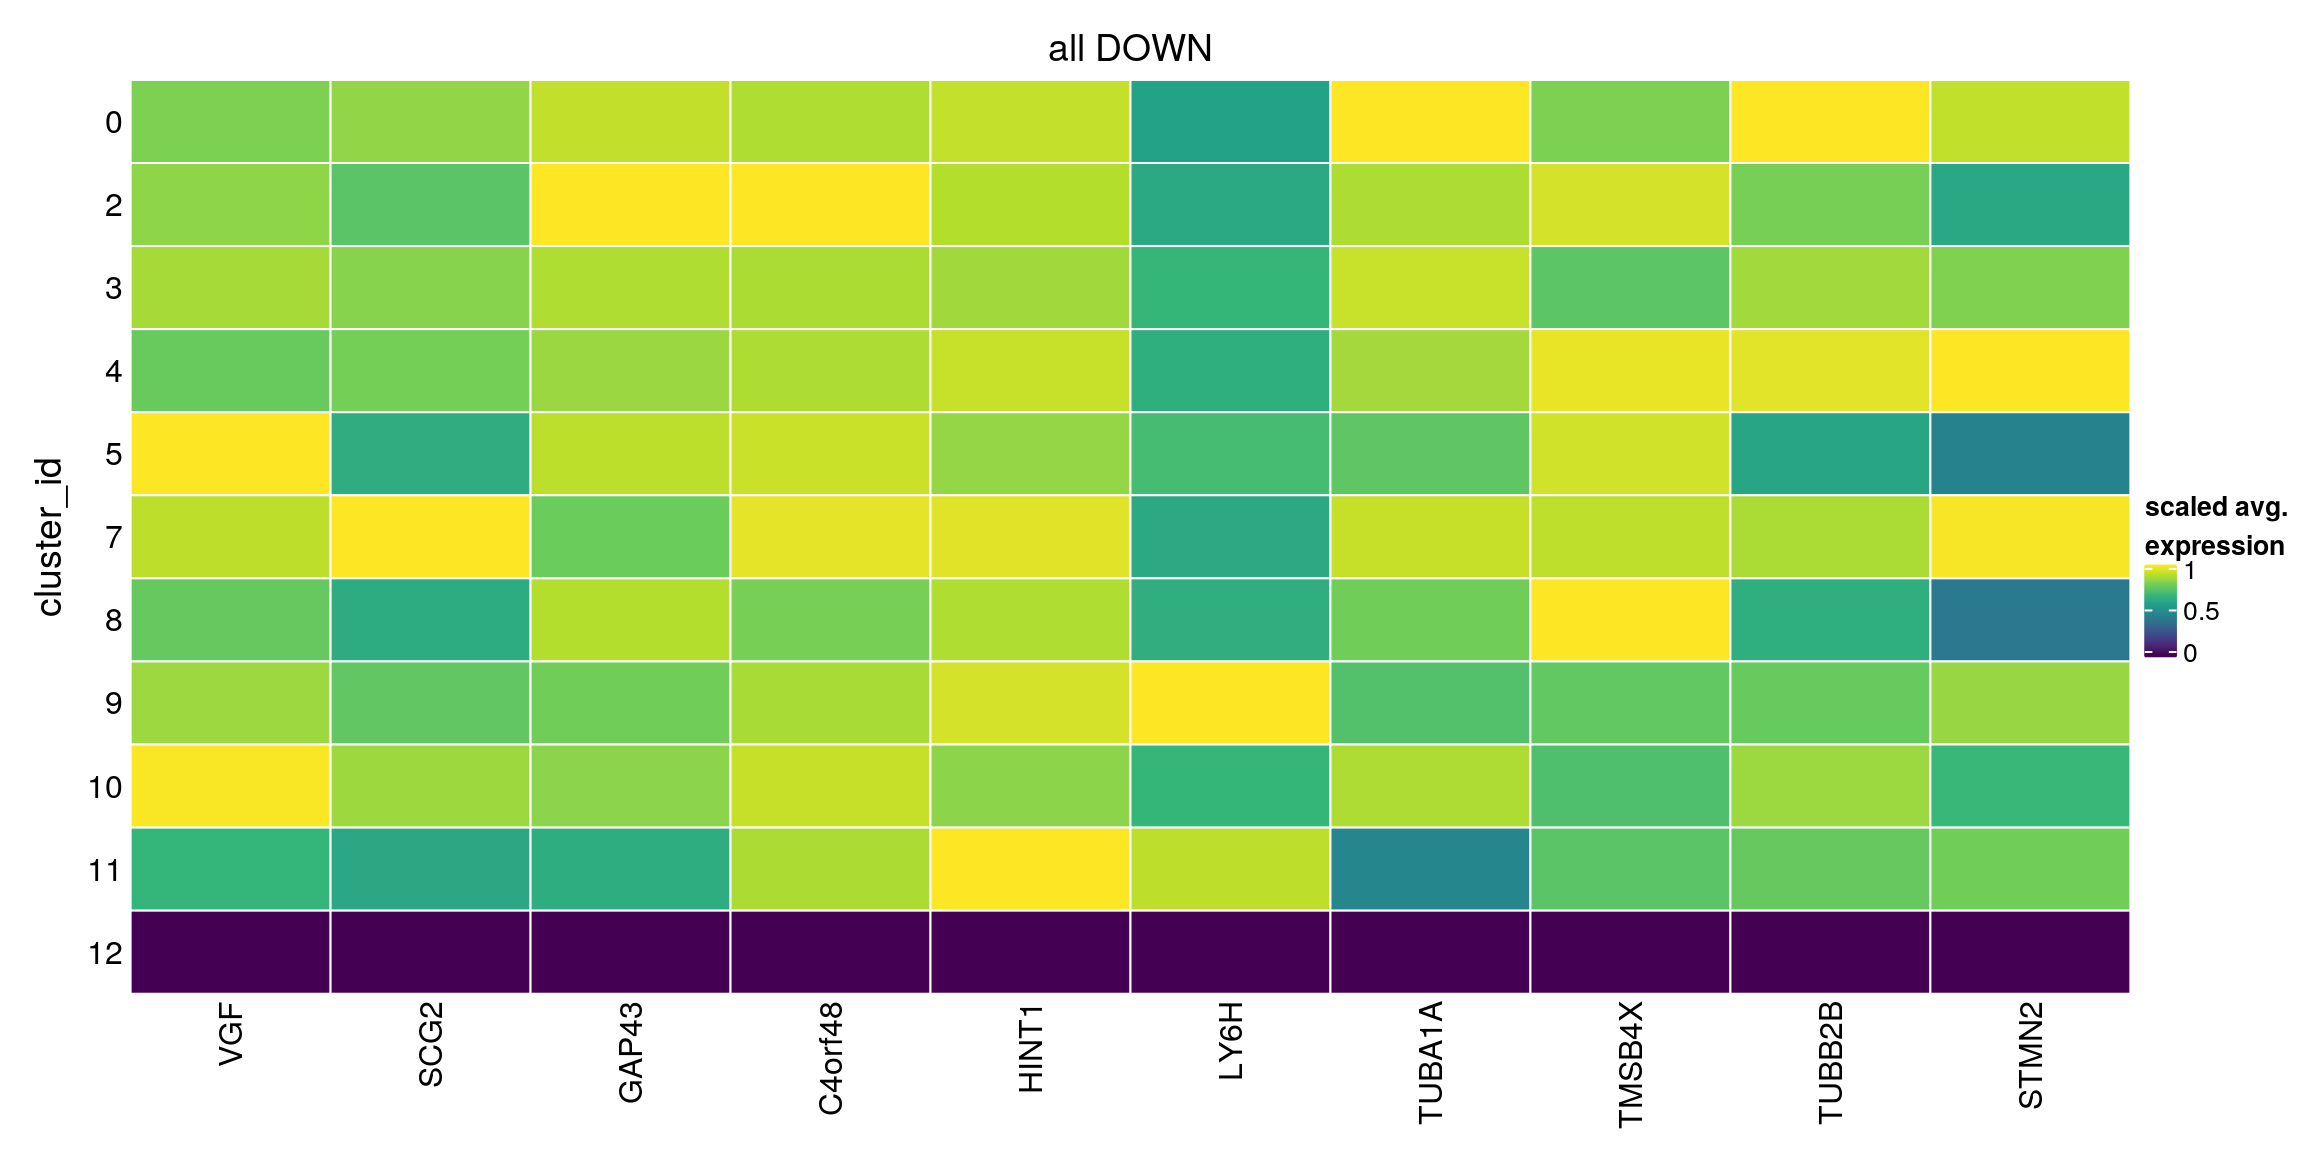
plot_marker_heatmap(all_default, "12", any = FALSE, top = 10, title = "all default")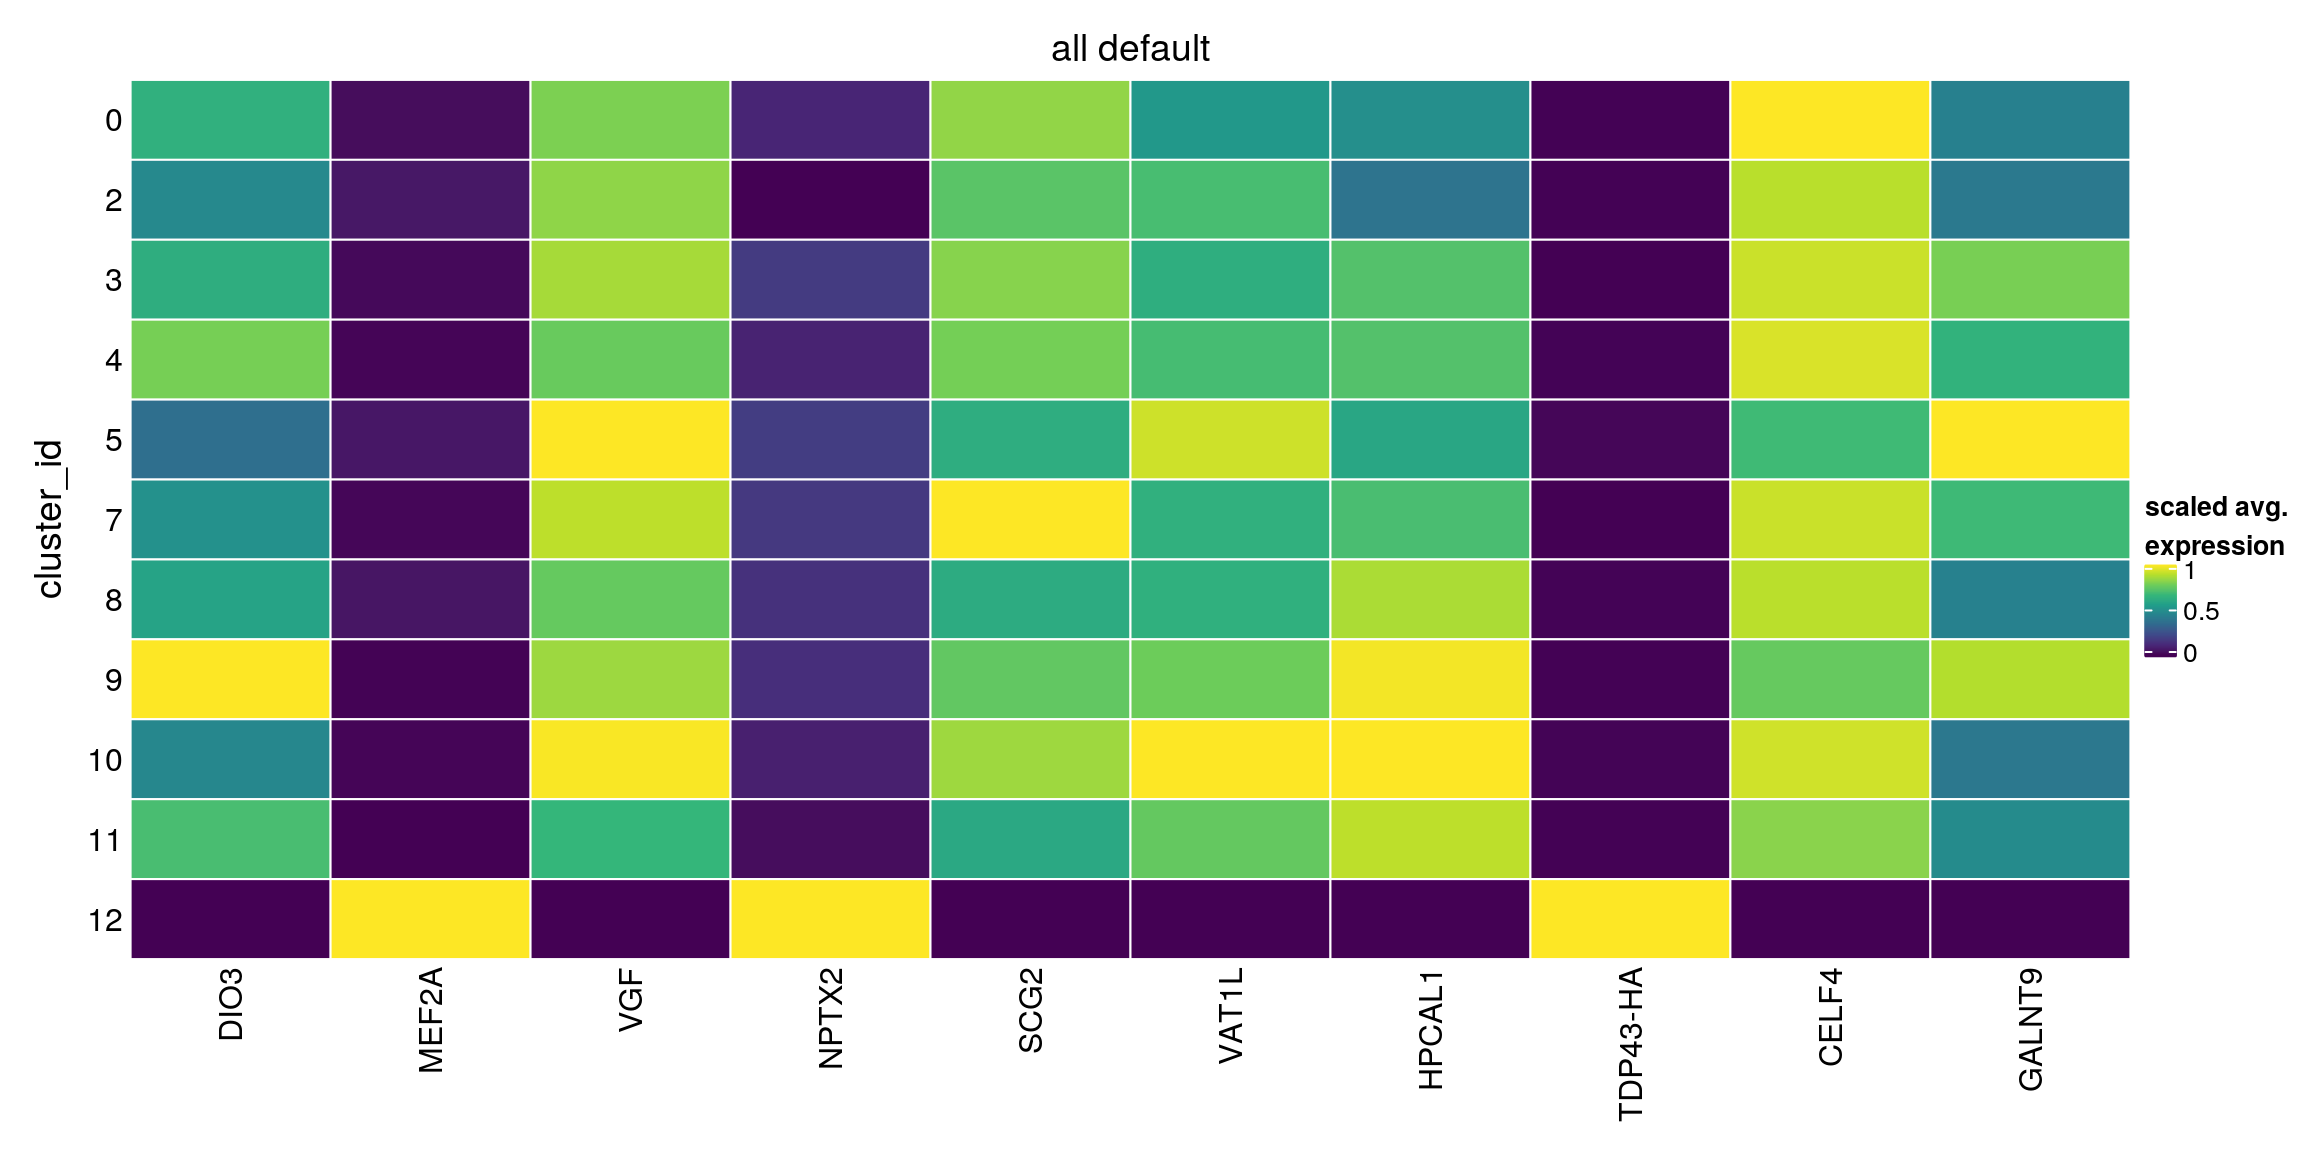
Dot plot visualization of marker expression
From Seurat github: "The DotPlot shows scaled values (which can be both positive and negative). This is because we want to be able to visualize both highly and lowly expressed genes on the same color scale."
fs <- list(up = c("NPTX2", "FGF18", "TDP43-HA", "PCED1A", "MEF2A", "DYNC2H1",
                   "APOE", "GADD45A", "BCAM", "DDIT3"),
           down = c("VGF", "SCG2", "GAP43", "C4orf48", "HINT1", "LY6H",
                     "TUBA1A", "TMSB4X", "TUBB2B", "STMN2"))

features <- all_up[["12"]][1:10,] %>% rownames
DotPlot(so, assay = "RNA", features = features, idents = neuronal_clusters,
        scale = TRUE, scale.min = 0, scale.max = 100, dot.scale = 7) +
  RotatedAxis() + scale_color_viridis() +
  theme(axis.text.x = element_text(angle=45)) + ylab("neuronal cluster ID") +
  scale_x_discrete(name = "gene", breaks = features, labels=fs[["up"]])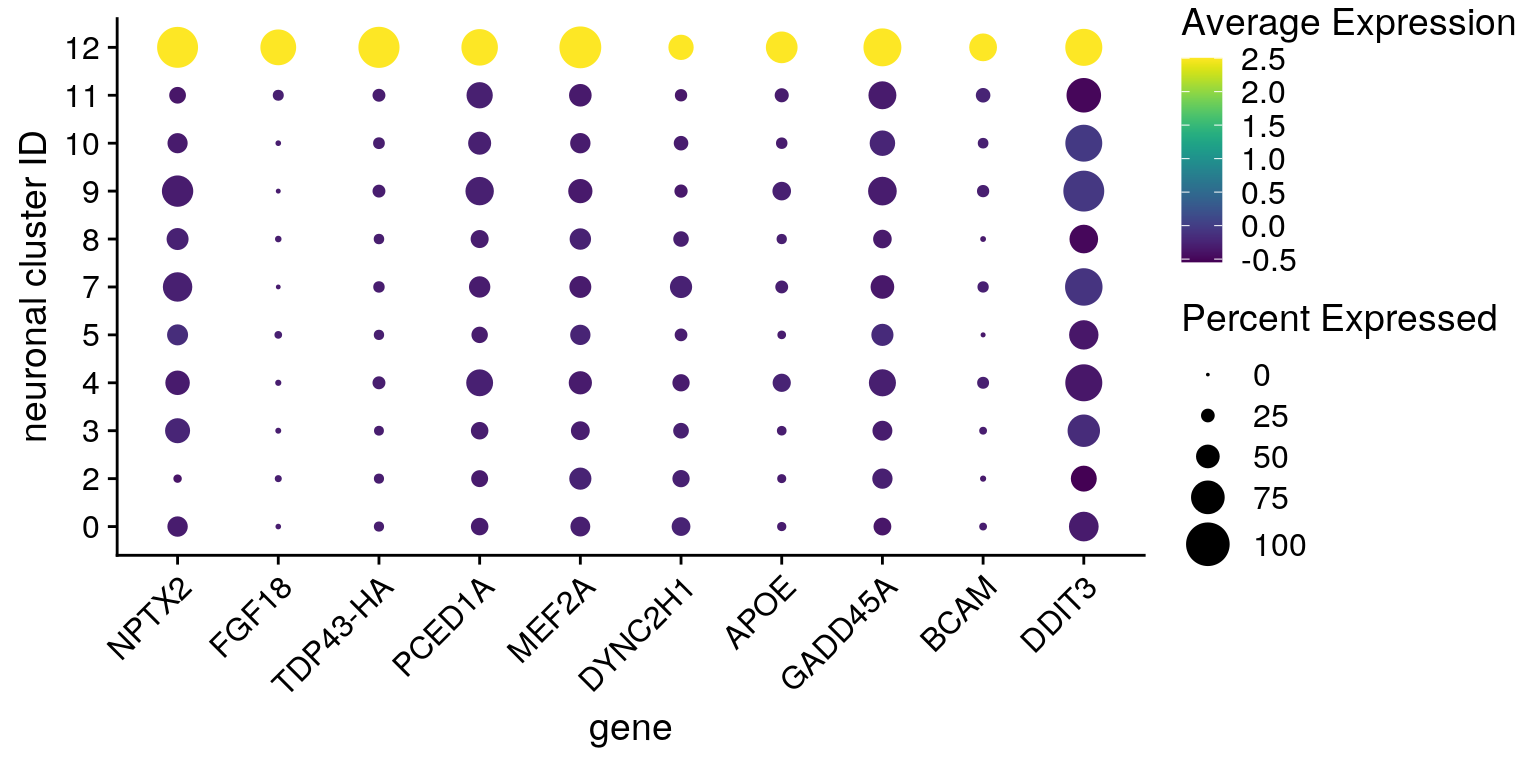
features <- all_down[["12"]][1:10,] %>% rownames
DotPlot(so, assay = "RNA", features = features, idents = neuronal_clusters,
        scale = TRUE, scale.min = 0, scale.max = 100, dot.scale = 7) +
  RotatedAxis() + scale_color_viridis() +
  theme(axis.text.x = element_text(angle=45)) + ylab("neuronal cluster ID") +
  scale_x_discrete(name = "gene",  breaks = features, labels=fs[["down"]])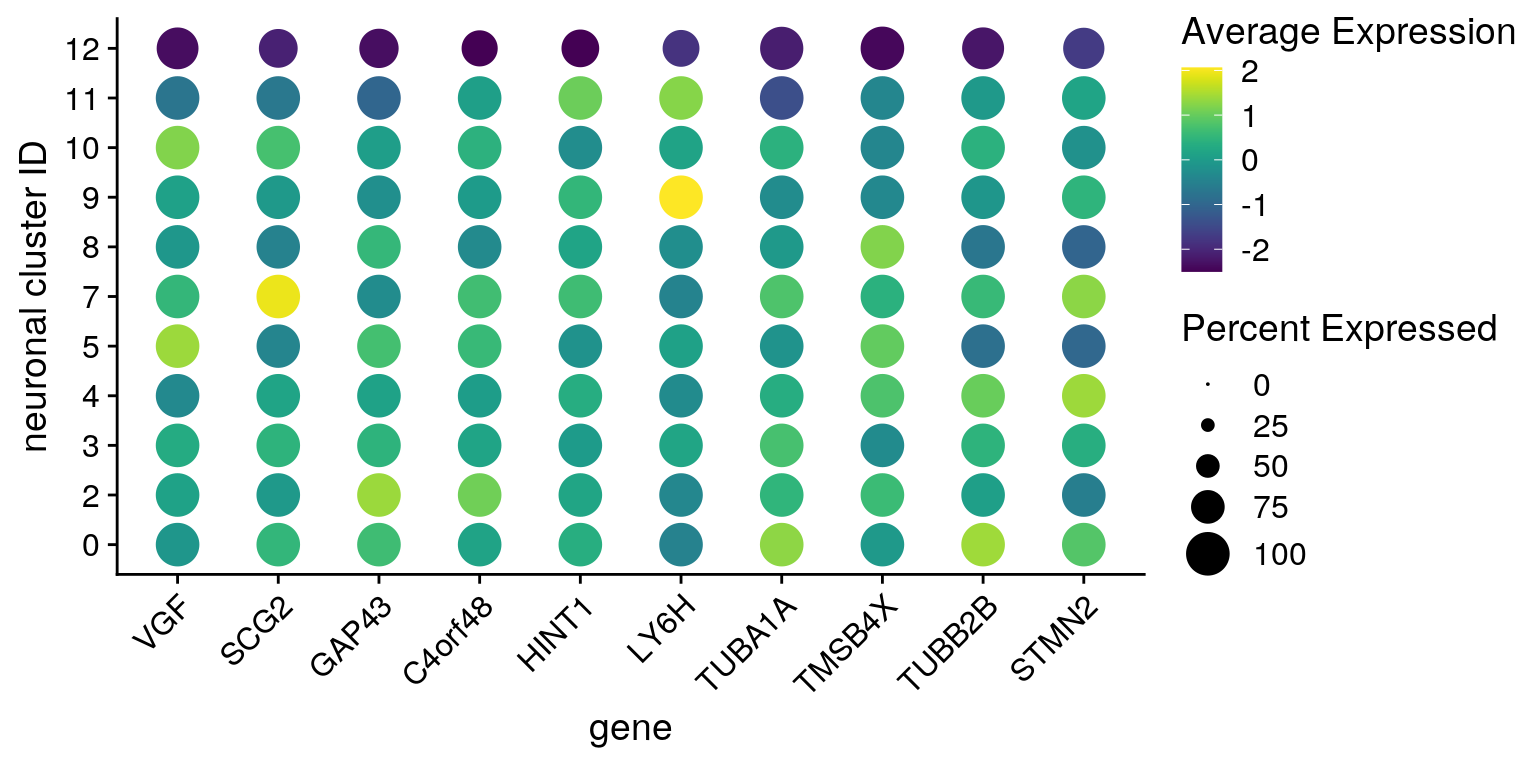
UNC13A expression in neuronal clusters
feature <- grep(pattern = paste0("\\.UNC13A$"), rownames(so), value = TRUE)
DotPlot(so, assay = "RNA", features = feature, idents = neuronal_clusters,
        scale = TRUE, scale.min = 0, scale.max = 100, dot.scale = 7) +
  RotatedAxis() + scale_color_viridis() +
  theme(axis.text.x = element_text(angle=45)) + ylab("neuronal cluster ID") +
  scale_x_discrete(name = "gene", breaks = feature, labels = "UNC13A")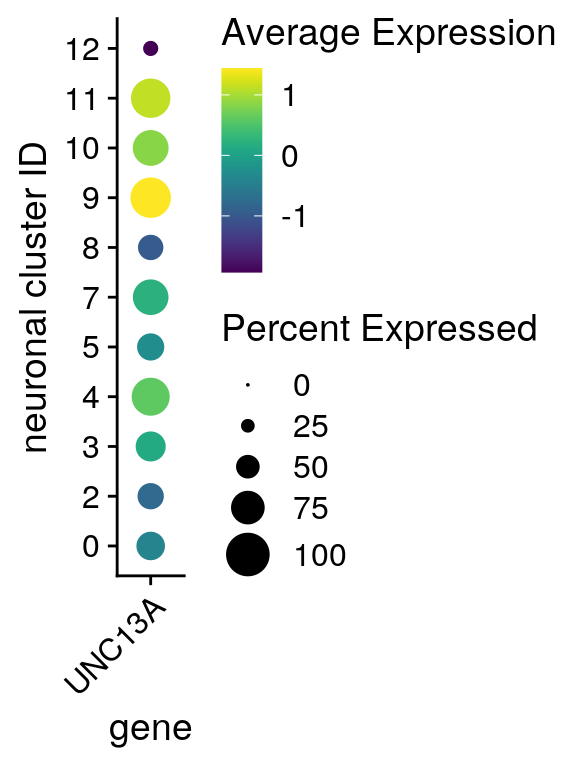
Together with the other downregulated genes:
features <- c(features, feature)
DotPlot(so, assay = "RNA", features = features, idents = neuronal_clusters,
        scale = TRUE, scale.min = 0, scale.max = 100, dot.scale = 7) +
  RotatedAxis() + scale_color_viridis() +
  theme(axis.text.x = element_text(angle=45)) + ylab("neuronal cluster ID") +
  scale_x_discrete(name = "gene",  breaks = features,
                   labels=c(fs[["down"]], "UNC13A"))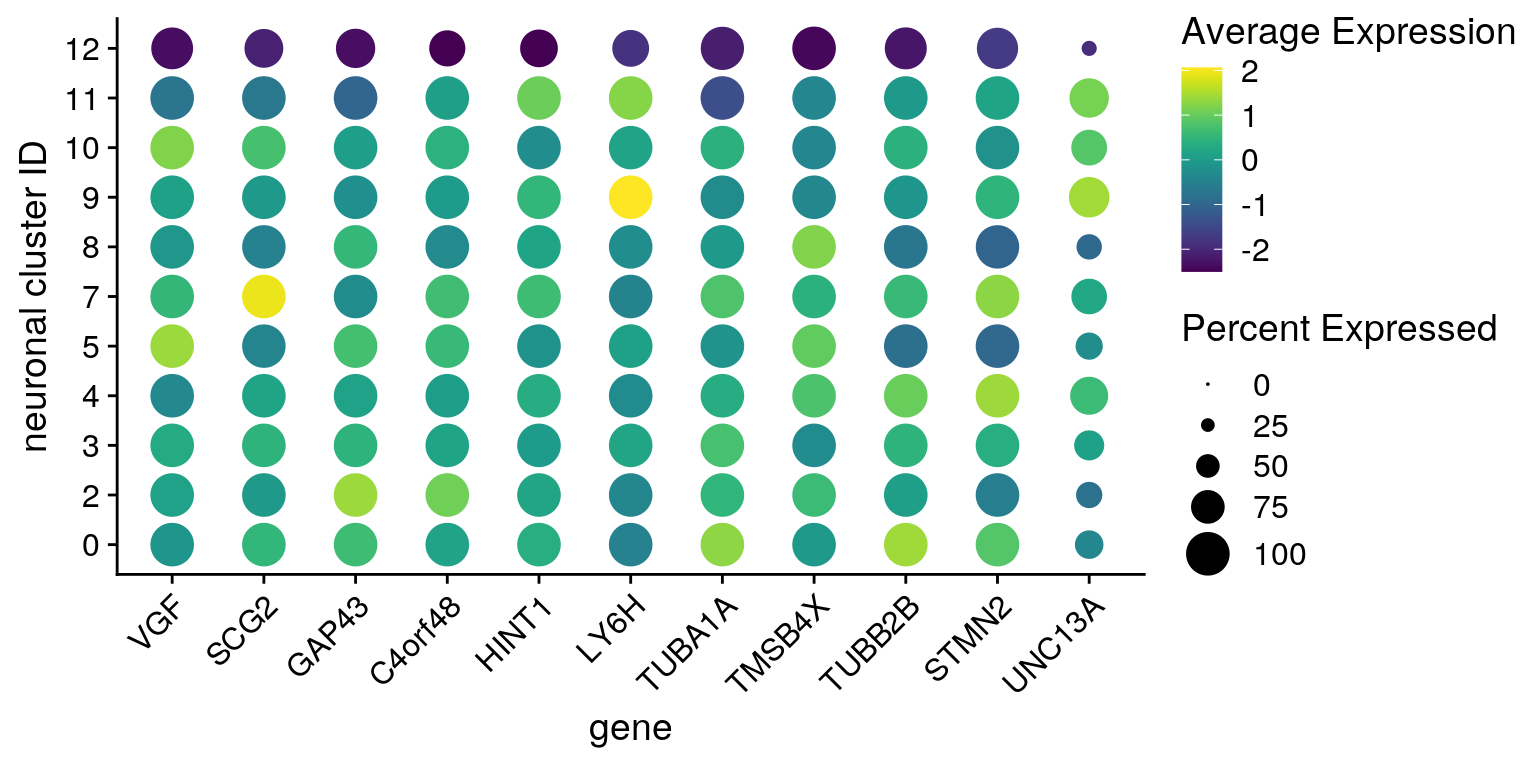
sessionInfo()R version 4.0.5 (2021-03-31)
Platform: x86_64-pc-linux-gnu (64-bit)
Running under: Ubuntu 18.04.5 LTS
Matrix products: default
BLAS: /usr/local/R/R-4.0.5/lib/libRblas.so
LAPACK: /usr/local/R/R-4.0.5/lib/libRlapack.so
locale:
[1] LC_CTYPE=en_US.UTF-8 LC_NUMERIC=C
[3] LC_TIME=en_US.UTF-8 LC_COLLATE=en_US.UTF-8
[5] LC_MONETARY=en_US.UTF-8 LC_MESSAGES=en_US.UTF-8
[7] LC_PAPER=en_US.UTF-8 LC_NAME=C
[9] LC_ADDRESS=C LC_TELEPHONE=C
[11] LC_MEASUREMENT=en_US.UTF-8 LC_IDENTIFICATION=C
attached base packages:
[1] parallel stats4 grid stats graphics grDevices utils
[8] datasets methods base
other attached packages:
[1] BiocParallel_1.22.0 RCurl_1.98-1.3
[3] stringr_1.4.0 SeuratObject_4.0.1
[5] Seurat_4.0.1 scran_1.16.0
[7] SingleCellExperiment_1.10.1 SummarizedExperiment_1.18.1
[9] DelayedArray_0.14.0 matrixStats_0.56.0
[11] Biobase_2.48.0 GenomicRanges_1.40.0
[13] GenomeInfoDb_1.24.2 IRanges_2.22.2
[15] S4Vectors_0.26.1 BiocGenerics_0.34.0
[17] viridis_0.5.1 viridisLite_0.3.0
[19] RColorBrewer_1.1-2 purrr_0.3.4
[21] muscat_1.2.1 dplyr_1.0.2
[23] ggplot2_3.3.2 cowplot_1.0.0
[25] ComplexHeatmap_2.4.2 workflowr_1.6.2
loaded via a namespace (and not attached):
[1] reticulate_1.16 tidyselect_1.1.0
[3] lme4_1.1-23 RSQLite_2.2.0
[5] AnnotationDbi_1.50.1 htmlwidgets_1.5.1
[7] Rtsne_0.15 munsell_0.5.0
[9] codetools_0.2-16 ica_1.0-2
[11] statmod_1.4.34 future_1.17.0
[13] miniUI_0.1.1.1 withr_2.4.1
[15] colorspace_1.4-1 knitr_1.29
[17] ROCR_1.0-11 tensor_1.5
[19] listenv_0.8.0 labeling_0.3
[21] git2r_0.27.1 GenomeInfoDbData_1.2.3
[23] polyclip_1.10-0 farver_2.0.3
[25] bit64_0.9-7 glmmTMB_1.0.2.1
[27] rprojroot_1.3-2 vctrs_0.3.4
[29] generics_0.0.2 xfun_0.15
[31] R6_2.4.1 doParallel_1.0.15
[33] ggbeeswarm_0.6.0 clue_0.3-57
[35] rsvd_1.0.3 locfit_1.5-9.4
[37] spatstat.utils_2.1-0 bitops_1.0-6
[39] cachem_1.0.4 promises_1.1.1
[41] scales_1.1.1 beeswarm_0.2.3
[43] gtable_0.3.0 globals_0.12.5
[45] goftest_1.2-2 rlang_0.4.10
[47] genefilter_1.70.0 GlobalOptions_0.1.2
[49] splines_4.0.5 TMB_1.7.16
[51] lazyeval_0.2.2 spatstat.geom_2.1-0
[53] abind_1.4-5 yaml_2.2.1
[55] reshape2_1.4.4 backports_1.1.9
[57] httpuv_1.5.4 tools_4.0.5
[59] spatstat.core_2.1-2 ellipsis_0.3.1
[61] gplots_3.0.4 ggridges_0.5.2
[63] Rcpp_1.0.5 plyr_1.8.6
[65] progress_1.2.2 zlibbioc_1.34.0
[67] prettyunits_1.1.1 rpart_4.1-15
[69] deldir_0.2-10 pbapply_1.4-2
[71] GetoptLong_1.0.1 zoo_1.8-8
[73] ggrepel_0.8.2 cluster_2.1.0
[75] colorRamps_2.3 fs_1.5.0
[77] variancePartition_1.18.2 magrittr_1.5
[79] data.table_1.12.8 scattermore_0.7
[81] lmerTest_3.1-2 circlize_0.4.10
[83] lmtest_0.9-37 RANN_2.6.1
[85] whisker_0.4 fitdistrplus_1.1-1
[87] hms_0.5.3 patchwork_1.0.1
[89] mime_0.9 evaluate_0.14
[91] xtable_1.8-4 pbkrtest_0.4-8.6
[93] XML_3.99-0.4 gridExtra_2.3
[95] shape_1.4.4 compiler_4.0.5
[97] scater_1.16.2 tibble_3.0.3
[99] KernSmooth_2.23-17 crayon_1.3.4
[101] minqa_1.2.4 htmltools_0.5.0
[103] mgcv_1.8-31 later_1.1.0.1
[105] tidyr_1.1.0 geneplotter_1.66.0
[107] DBI_1.1.0 MASS_7.3-51.6
[109] rappdirs_0.3.1 boot_1.3-25
[111] Matrix_1.3-3 gdata_2.18.0
[113] igraph_1.2.5 pkgconfig_2.0.3
[115] numDeriv_2016.8-1.1 spatstat.sparse_2.0-0
[117] plotly_4.9.2.1 foreach_1.5.0
[119] annotate_1.66.0 vipor_0.4.5
[121] dqrng_0.2.1 blme_1.0-4
[123] XVector_0.28.0 digest_0.6.25
[125] sctransform_0.3.2 RcppAnnoy_0.0.18
[127] spatstat.data_2.1-0 rmarkdown_2.3
[129] leiden_0.3.3 uwot_0.1.10
[131] edgeR_3.30.3 DelayedMatrixStats_1.10.1
[133] shiny_1.5.0 gtools_3.8.2
[135] rjson_0.2.20 nloptr_1.2.2.2
[137] lifecycle_1.0.0 nlme_3.1-148
[139] jsonlite_1.7.2 BiocNeighbors_1.6.0
[141] limma_3.44.3 pillar_1.4.6
[143] lattice_0.20-41 fastmap_1.0.1
[145] httr_1.4.2 survival_3.2-3
[147] glue_1.4.2 png_0.1-7
[149] iterators_1.0.12 bit_1.1-15.2
[151] stringi_1.4.6 blob_1.2.1
[153] DESeq2_1.28.1 BiocSingular_1.4.0
[155] caTools_1.18.0 memoise_2.0.0
[157] irlba_2.3.3 future.apply_1.6.0