Cluster analysis
Katharina Hembach
10/16/2020
Last updated: 2021-07-14
Checks: 7 0
Knit directory: neural_scRNAseq/
This reproducible R Markdown analysis was created with workflowr (version 1.6.2). The Checks tab describes the reproducibility checks that were applied when the results were created. The Past versions tab lists the development history.
Great! Since the R Markdown file has been committed to the Git repository, you know the exact version of the code that produced these results.
Great job! The global environment was empty. Objects defined in the global environment can affect the analysis in your R Markdown file in unknown ways. For reproduciblity it's best to always run the code in an empty environment.
The command set.seed(20200522) was run prior to running the code in the R Markdown file. Setting a seed ensures that any results that rely on randomness, e.g. subsampling or permutations, are reproducible.
Great job! Recording the operating system, R version, and package versions is critical for reproducibility.
Nice! There were no cached chunks for this analysis, so you can be confident that you successfully produced the results during this run.
Great job! Using relative paths to the files within your workflowr project makes it easier to run your code on other machines.
Great! You are using Git for version control. Tracking code development and connecting the code version to the results is critical for reproducibility.
The results in this page were generated with repository version d2fc383. See the Past versions tab to see a history of the changes made to the R Markdown and HTML files.
Note that you need to be careful to ensure that all relevant files for the analysis have been committed to Git prior to generating the results (you can use wflow_publish or wflow_git_commit). workflowr only checks the R Markdown file, but you know if there are other scripts or data files that it depends on. Below is the status of the Git repository when the results were generated:
Ignored files:
    Ignored:    .DS_Store
    Ignored:    .Rhistory
    Ignored:    .Rproj.user/
    Ignored:    ._.DS_Store
    Ignored:    ._Filtered.pdf
    Ignored:    ._Rplots.pdf
    Ignored:    ._Unfiltered.pdf
    Ignored:    .__workflowr.yml
    Ignored:    ._coverage.pdf
    Ignored:    ._coverage_sashimi.pdf
    Ignored:    ._coverage_sashimi.png
    Ignored:    ._neural_scRNAseq.Rproj
    Ignored:    ._pbDS_cell_level.pdf
    Ignored:    ._pbDS_top_expr_umap.pdf
    Ignored:    ._pbDS_upset.pdf
    Ignored:    ._sashimi.pdf
    Ignored:    ._stmn2.pdf
    Ignored:    ._tdp.pdf
    Ignored:    analysis/.DS_Store
    Ignored:    analysis/.Rhistory
    Ignored:    analysis/._.DS_Store
    Ignored:    analysis/._01-preprocessing.Rmd
    Ignored:    analysis/._01-preprocessing.html
    Ignored:    analysis/._02.1-SampleQC.Rmd
    Ignored:    analysis/._03-filtering.Rmd
    Ignored:    analysis/._04-clustering.Rmd
    Ignored:    analysis/._04-clustering.knit.md
    Ignored:    analysis/._04.1-cell_cycle.Rmd
    Ignored:    analysis/._05-annotation.Rmd
    Ignored:    analysis/._07-cluster-analysis-all-timepoints.Rmd
    Ignored:    analysis/._Lam-0-NSC_no_integration.Rmd
    Ignored:    analysis/._Lam-01-NSC_integration.Rmd
    Ignored:    analysis/._Lam-02-NSC_annotation.Rmd
    Ignored:    analysis/._NSC-1-clustering.Rmd
    Ignored:    analysis/._NSC-2-annotation.Rmd
    Ignored:    analysis/._TDP-06-cluster_analysis.Rmd
    Ignored:    analysis/.__site.yml
    Ignored:    analysis/._additional_filtering.Rmd
    Ignored:    analysis/._additional_filtering_clustering.Rmd
    Ignored:    analysis/._index.Rmd
    Ignored:    analysis/._organoid-01-1-qualtiy-control.Rmd
    Ignored:    analysis/._organoid-01-clustering.Rmd
    Ignored:    analysis/._organoid-02-integration.Rmd
    Ignored:    analysis/._organoid-03-cluster_analysis.Rmd
    Ignored:    analysis/._organoid-04-group_integration.Rmd
    Ignored:    analysis/._organoid-04-stage_integration.Rmd
    Ignored:    analysis/._organoid-05-group_integration_cluster_analysis.Rmd
    Ignored:    analysis/._organoid-05-stage_integration_cluster_analysis.Rmd
    Ignored:    analysis/._organoid-06-1-prepare-sce.Rmd
    Ignored:    analysis/._organoid-06-conos-analysis-Seurat.Rmd
    Ignored:    analysis/._organoid-06-conos-analysis-function.Rmd
    Ignored:    analysis/._organoid-06-conos-analysis.Rmd
    Ignored:    analysis/._organoid-06-group-integration-conos-analysis.Rmd
    Ignored:    analysis/._organoid-07-conos-visualization.Rmd
    Ignored:    analysis/._organoid-07-group-integration-conos-visualization.Rmd
    Ignored:    analysis/._organoid-08-conos-comparison.Rmd
    Ignored:    analysis/._organoid-0x-sample_integration.Rmd
    Ignored:    analysis/01-preprocessing_cache/
    Ignored:    analysis/02-1-SampleQC_cache/
    Ignored:    analysis/02-quality_control_cache/
    Ignored:    analysis/02.1-SampleQC_cache/
    Ignored:    analysis/03-filtering_cache/
    Ignored:    analysis/04-clustering_cache/
    Ignored:    analysis/04.1-cell_cycle_cache/
    Ignored:    analysis/05-annotation_cache/
    Ignored:    analysis/06-clustering-all-timepoints_cache/
    Ignored:    analysis/07-cluster-analysis-all-timepoints_cache/
    Ignored:    analysis/CH-test-01-preprocessing_cache/
    Ignored:    analysis/CH-test-02-transgene-expression_cache/
    Ignored:    analysis/CH-test-03-cluster-analysis_cache/
    Ignored:    analysis/Lam-01-NSC_integration_cache/
    Ignored:    analysis/Lam-02-NSC_annotation_cache/
    Ignored:    analysis/NSC-1-clustering_cache/
    Ignored:    analysis/NSC-2-annotation_cache/
    Ignored:    analysis/TDP-01-preprocessing_cache/
    Ignored:    analysis/TDP-02-quality_control_cache/
    Ignored:    analysis/TDP-03-filtering_cache/
    Ignored:    analysis/TDP-04-clustering_cache/
    Ignored:    analysis/TDP-05-00-filtering-plasmid-QC_cache/
    Ignored:    analysis/TDP-05-plasmid_expression_cache/
    Ignored:    analysis/TDP-07-01-STMN2_expression_cache/
    Ignored:    analysis/TDP-07-02-Prudencio_marker_expression_cache/
    Ignored:    analysis/TDP-07-03-Liu_sorted_nuclei_marker_expression_cache/
    Ignored:    analysis/TDP-07-cluster_12_cache/
    Ignored:    analysis/TDP-08-00-clustering-HA-D96_cache/
    Ignored:    analysis/TDP-08-01-HA-D96-expression-changes_cache/
    Ignored:    analysis/TDP-08-02-TDP_target_genes_cache/
    Ignored:    analysis/TDP-08-clustering-timeline-HA_cache/
    Ignored:    analysis/additional_filtering_cache/
    Ignored:    analysis/additional_filtering_clustering_cache/
    Ignored:    analysis/organoid-01-1-qualtiy-control_cache/
    Ignored:    analysis/organoid-01-clustering_cache/
    Ignored:    analysis/organoid-02-integration_cache/
    Ignored:    analysis/organoid-03-cluster_analysis_cache/
    Ignored:    analysis/organoid-04-group_integration_cache/
    Ignored:    analysis/organoid-04-stage_integration_cache/
    Ignored:    analysis/organoid-05-group_integration_cluster_analysis_cache/
    Ignored:    analysis/organoid-05-stage_integration_cluster_analysis_cache/
    Ignored:    analysis/organoid-06-conos-analysis_cache/
    Ignored:    analysis/organoid-06-conos-analysis_test_cache/
    Ignored:    analysis/organoid-06-group-integration-conos-analysis_cache/
    Ignored:    analysis/organoid-07-conos-visualization_cache/
    Ignored:    analysis/organoid-07-group-integration-conos-visualization_cache/
    Ignored:    analysis/organoid-08-conos-comparison_cache/
    Ignored:    analysis/organoid-0x-sample_integration_cache/
    Ignored:    analysis/sample5_QC_cache/
    Ignored:    analysis/timepoints-01-organoid-integration_cache/
    Ignored:    analysis/timepoints-02-cluster-analysis_cache/
    Ignored:    data/.DS_Store
    Ignored:    data/._.DS_Store
    Ignored:    data/._.smbdeleteAAA17ed8b4b
    Ignored:    data/._Lam_figure2_markers.R
    Ignored:    data/._README.md
    Ignored:    data/._Reactive_astrocytes_markers.xlsx
    Ignored:    data/._known_NSC_markers.R
    Ignored:    data/._known_cell_type_markers.R
    Ignored:    data/._metadata.csv
    Ignored:    data/._virus_cell_tropism_markers.R
    Ignored:    data/._~$Reactive_astrocytes_markers.xlsx
    Ignored:    data/data_sushi/
    Ignored:    data/filtered_feature_matrices/
    Ignored:    output/.DS_Store
    Ignored:    output/._.DS_Store
    Ignored:    output/._Liu_TDP_neg_vs_pos_edgeR_dge_results.txt
    Ignored:    output/._NSC_cluster2_marker_genes.txt
    Ignored:    output/._TDP-06-no_integration_cluster12_marker_genes.txt
    Ignored:    output/._TDP-06-no_integration_cluster13_marker_genes.txt
    Ignored:    output/._organoid_integration_cluster1_marker_genes.txt
    Ignored:    output/._tbl_TDP-08-01-muscat_cluster_0.txt
    Ignored:    output/._tbl_TDP-08-01-muscat_cluster_1.txt
    Ignored:    output/._tbl_TDP-08-01-muscat_cluster_10.txt
    Ignored:    output/._tbl_TDP-08-01-muscat_cluster_11.txt
    Ignored:    output/._tbl_TDP-08-01-muscat_cluster_12.txt
    Ignored:    output/._tbl_TDP-08-01-muscat_cluster_13.txt
    Ignored:    output/._tbl_TDP-08-01-muscat_cluster_14.txt
    Ignored:    output/._tbl_TDP-08-01-muscat_cluster_5.txt
    Ignored:    output/._tbl_TDP-08-01-muscat_cluster_7.txt
    Ignored:    output/._tbl_TDP-08-01-muscat_cluster_8.txt
    Ignored:    output/._tbl_TDP-08-01-muscat_cluster_all.xlsx
    Ignored:    output/._tbl_TDP-08-02-targets_hek_cluster_0.txt
    Ignored:    output/._tbl_TDP-08-02-targets_hek_cluster_1.txt
    Ignored:    output/._tbl_TDP-08-02-targets_hek_cluster_10.txt
    Ignored:    output/._tbl_TDP-08-02-targets_hek_cluster_11.txt
    Ignored:    output/._tbl_TDP-08-02-targets_hek_cluster_12.txt
    Ignored:    output/._tbl_TDP-08-02-targets_hek_cluster_13.txt
    Ignored:    output/._tbl_TDP-08-02-targets_hek_cluster_14.txt
    Ignored:    output/._tbl_TDP-08-02-targets_hek_cluster_5.txt
    Ignored:    output/._tbl_TDP-08-02-targets_hek_cluster_7.txt
    Ignored:    output/._tbl_TDP-08-02-targets_hek_cluster_8.txt
    Ignored:    output/._tbl_TDP-08-02-targets_hek_cluster_all.xlsx
    Ignored:    output/._~$tbl_TDP-08-02-targets_hek_cluster_all.xlsx
    Ignored:    output/CH-test-01-preprocessing.rds
    Ignored:    output/CH-test-01-preprocessing_singlets.rds
    Ignored:    output/CH-test-01-preprocessing_singlets_filtered.rds
    Ignored:    output/CH-test-01-preprocessing_so.rds
    Ignored:    output/CH-test-01-preprocessing_so_filtered.rds
    Ignored:    output/CH-test-03-cluster-analysis_so.rds
    Ignored:    output/CH-test-03_scran_markers.rds
    Ignored:    output/Lam-01-clustering.rds
    Ignored:    output/Liu_TDP_neg_vs_pos_edgeR_dge.rds
    Ignored:    output/Liu_TDP_neg_vs_pos_edgeR_dge_results.txt
    Ignored:    output/NSC_1_clustering.rds
    Ignored:    output/NSC_cluster1_marker_genes.txt
    Ignored:    output/NSC_cluster2_marker_genes.txt
    Ignored:    output/NSC_cluster3_marker_genes.txt
    Ignored:    output/NSC_cluster4_marker_genes.txt
    Ignored:    output/NSC_cluster5_marker_genes.txt
    Ignored:    output/NSC_cluster6_marker_genes.txt
    Ignored:    output/NSC_cluster7_marker_genes.txt
    Ignored:    output/TDP-06-no_integration_cluster0_marker_genes.txt
    Ignored:    output/TDP-06-no_integration_cluster10_marker_genes.txt
    Ignored:    output/TDP-06-no_integration_cluster11_marker_genes.txt
    Ignored:    output/TDP-06-no_integration_cluster12_marker_genes.txt
    Ignored:    output/TDP-06-no_integration_cluster13_marker_genes.txt
    Ignored:    output/TDP-06-no_integration_cluster14_marker_genes.txt
    Ignored:    output/TDP-06-no_integration_cluster15_marker_genes.txt
    Ignored:    output/TDP-06-no_integration_cluster16_marker_genes.txt
    Ignored:    output/TDP-06-no_integration_cluster17_marker_genes.txt
    Ignored:    output/TDP-06-no_integration_cluster1_marker_genes.txt
    Ignored:    output/TDP-06-no_integration_cluster2_marker_genes.txt
    Ignored:    output/TDP-06-no_integration_cluster3_marker_genes.txt
    Ignored:    output/TDP-06-no_integration_cluster4_marker_genes.txt
    Ignored:    output/TDP-06-no_integration_cluster5_marker_genes.txt
    Ignored:    output/TDP-06-no_integration_cluster6_marker_genes.txt
    Ignored:    output/TDP-06-no_integration_cluster7_marker_genes.txt
    Ignored:    output/TDP-06-no_integration_cluster8_marker_genes.txt
    Ignored:    output/TDP-06-no_integration_cluster9_marker_genes.txt
    Ignored:    output/TDP-06_scran_markers.rds
    Ignored:    output/additional_filtering.rds
    Ignored:    output/conos/
    Ignored:    output/conos_organoid-06-conos-analysis.rds
    Ignored:    output/conos_organoid-06-group-integration-conos-analysis.rds
    Ignored:    output/figures/
    Ignored:    output/organoid_integration_cluster10_marker_genes.txt
    Ignored:    output/organoid_integration_cluster11_marker_genes.txt
    Ignored:    output/organoid_integration_cluster12_marker_genes.txt
    Ignored:    output/organoid_integration_cluster13_marker_genes.txt
    Ignored:    output/organoid_integration_cluster14_marker_genes.txt
    Ignored:    output/organoid_integration_cluster15_marker_genes.txt
    Ignored:    output/organoid_integration_cluster16_marker_genes.txt
    Ignored:    output/organoid_integration_cluster17_marker_genes.txt
    Ignored:    output/organoid_integration_cluster1_marker_genes.txt
    Ignored:    output/organoid_integration_cluster2_marker_genes.txt
    Ignored:    output/organoid_integration_cluster3_marker_genes.txt
    Ignored:    output/organoid_integration_cluster4_marker_genes.txt
    Ignored:    output/organoid_integration_cluster5_marker_genes.txt
    Ignored:    output/organoid_integration_cluster6_marker_genes.txt
    Ignored:    output/organoid_integration_cluster7_marker_genes.txt
    Ignored:    output/organoid_integration_cluster8_marker_genes.txt
    Ignored:    output/organoid_integration_cluster9_marker_genes.txt
    Ignored:    output/paper_supplement/
    Ignored:    output/res_TDP-08-01-muscat.rds
    Ignored:    output/sce_01_preprocessing.rds
    Ignored:    output/sce_02_quality_control.rds
    Ignored:    output/sce_03_filtering.rds
    Ignored:    output/sce_03_filtering_all_genes.rds
    Ignored:    output/sce_06-1-prepare-sce.rds
    Ignored:    output/sce_TDP-08-01-muscat.rds
    Ignored:    output/sce_TDP_01_preprocessing.rds
    Ignored:    output/sce_TDP_02_quality_control.rds
    Ignored:    output/sce_TDP_03_filtering.rds
    Ignored:    output/sce_TDP_03_filtering_all_genes.rds
    Ignored:    output/sce_organoid-01-clustering.rds
    Ignored:    output/sce_preprocessing.rds
    Ignored:    output/so_04-stage_integration.rds
    Ignored:    output/so_04_1_cell_cycle.rds
    Ignored:    output/so_04_clustering.rds
    Ignored:    output/so_06-clustering_all_timepoints.rds
    Ignored:    output/so_08-00_clustering_HA_D96.rds
    Ignored:    output/so_08-clustering_timeline_HA.rds
    Ignored:    output/so_0x-sample_integration.rds
    Ignored:    output/so_CH-test-02-transgene_expression.rds
    Ignored:    output/so_TDP-06-cluster-analysis.rds
    Ignored:    output/so_TDP_04_clustering.rds
    Ignored:    output/so_TDP_05_plasmid_expression.rds
    Ignored:    output/so_additional_filtering_clustering.rds
    Ignored:    output/so_integrated_organoid-02-integration.rds
    Ignored:    output/so_merged_organoid-02-integration.rds
    Ignored:    output/so_organoid-01-clustering.rds
    Ignored:    output/so_sample_organoid-01-clustering.rds
    Ignored:    output/so_timepoints-01-organoid_integration.rds
    Ignored:    output/tbl_TDP-08-01-muscat.rds
    Ignored:    output/tbl_TDP-08-01-muscat_cluster_0.txt
    Ignored:    output/tbl_TDP-08-01-muscat_cluster_1.txt
    Ignored:    output/tbl_TDP-08-01-muscat_cluster_10.txt
    Ignored:    output/tbl_TDP-08-01-muscat_cluster_11.txt
    Ignored:    output/tbl_TDP-08-01-muscat_cluster_12.txt
    Ignored:    output/tbl_TDP-08-01-muscat_cluster_13.txt
    Ignored:    output/tbl_TDP-08-01-muscat_cluster_14.txt
    Ignored:    output/tbl_TDP-08-01-muscat_cluster_5.txt
    Ignored:    output/tbl_TDP-08-01-muscat_cluster_7.txt
    Ignored:    output/tbl_TDP-08-01-muscat_cluster_8.txt
    Ignored:    output/tbl_TDP-08-01-muscat_cluster_all.xlsx
    Ignored:    output/tbl_TDP-08-02-targets_hek.rds
    Ignored:    output/tbl_TDP-08-02-targets_hek_cluster_0.txt
    Ignored:    output/tbl_TDP-08-02-targets_hek_cluster_1.txt
    Ignored:    output/tbl_TDP-08-02-targets_hek_cluster_10.txt
    Ignored:    output/tbl_TDP-08-02-targets_hek_cluster_11.txt
    Ignored:    output/tbl_TDP-08-02-targets_hek_cluster_12.txt
    Ignored:    output/tbl_TDP-08-02-targets_hek_cluster_13.txt
    Ignored:    output/tbl_TDP-08-02-targets_hek_cluster_14.txt
    Ignored:    output/tbl_TDP-08-02-targets_hek_cluster_5.txt
    Ignored:    output/tbl_TDP-08-02-targets_hek_cluster_7.txt
    Ignored:    output/tbl_TDP-08-02-targets_hek_cluster_8.txt
    Ignored:    output/tbl_TDP-08-02-targets_hek_cluster_all.xlsx
    Ignored:    output/~$tbl_TDP-08-02-targets_hek_cluster_all.xlsx
    Ignored:    scripts/.DS_Store
    Ignored:    scripts/._.DS_Store
    Ignored:    scripts/._bu_Rcode.R
    Ignored:    scripts/._plasmid_expression.sh
    Ignored:    scripts/._plasmid_expression_cell_hashing_test.sh
    Ignored:    scripts/._prepare_salmon_transcripts.R
    Ignored:    scripts/._prepare_salmon_transcripts_cell_hashing_test.R

Untracked files:
    Untracked:  = gene_name[order(logFC,
    Untracked:  Filtered.pdf
    Untracked:  Rplots.pdf
    Untracked:  Unfiltered
    Untracked:  Unfiltered.pdf
    Untracked:  analysis/Lam-0-NSC_no_integration.Rmd
    Untracked:  analysis/TDP-07-01-STMN2_expression copy.Rmd
    Untracked:  analysis/additional_filtering.Rmd
    Untracked:  analysis/additional_filtering_clustering.Rmd
    Untracked:  analysis/organoid-01-1-qualtiy-control.Rmd
    Untracked:  analysis/organoid-06-conos-analysis-Seurat.Rmd
    Untracked:  analysis/organoid-06-conos-analysis-function.Rmd
    Untracked:  analysis/organoid-07-conos-visualization.Rmd
    Untracked:  analysis/organoid-07-group-integration-conos-visualization.Rmd
    Untracked:  analysis/organoid-08-conos-comparison.Rmd
    Untracked:  analysis/organoid-0x-sample_integration.Rmd
    Untracked:  analysis/sample5_QC.Rmd
    Untracked:  coverage.pdf
    Untracked:  coverage_sashimi.pdf
    Untracked:  coverage_sashimi.png
    Untracked:  data/Homo_sapiens.GRCh38.98.sorted.gtf
    Untracked:  data/Jun2021/
    Untracked:  data/Kanton_et_al/
    Untracked:  data/Lam_et_al/
    Untracked:  data/Liu_et_al/
    Untracked:  data/Prudencio_et_al/
    Untracked:  data/Sep2020/
    Untracked:  data/cell_hashing_test/
    Untracked:  data/reference/
    Untracked:  data/virus_cell_tropism_markers.R
    Untracked:  data/~$Reactive_astrocytes_markers.xlsx
    Untracked:  pbDS_cell_level.pdf
    Untracked:  pbDS_heatmap.pdf
    Untracked:  pbDS_top_expr_umap.pdf
    Untracked:  pbDS_upset.pdf
    Untracked:  sashimi.pdf
    Untracked:  scripts/bu_Rcode.R
    Untracked:  scripts/bu_code.Rmd
    Untracked:  scripts/plasmid_expression_cell_hashing_test.sh
    Untracked:  scripts/prepare_salmon_transcripts_cell_hashing_test.R
    Untracked:  scripts/salmon-latest_linux_x86_64/
    Untracked:  stmn2.pdf
    Untracked:  tdp.pdf

Unstaged changes:
    Modified:   analysis/05-annotation.Rmd
    Modified:   analysis/TDP-04-clustering.Rmd
    Modified:   analysis/TDP-07-cluster_12.Rmd
    Modified:   analysis/TDP-08-01-HA-D96-expression-changes.Rmd
    Modified:   analysis/_site.yml
    Modified:   analysis/organoid-02-integration.Rmd
    Modified:   analysis/organoid-04-group_integration.Rmd
    Modified:   analysis/organoid-06-conos-analysis.Rmd
Note that any generated files, e.g. HTML, png, CSS, etc., are not included in this status report because it is ok for generated content to have uncommitted changes.
These are the previous versions of the repository in which changes were made to the R Markdown (analysis/TDP-06-cluster_analysis.Rmd) and HTML (docs/TDP-06-cluster_analysis.html) files. If you've configured a remote Git repository (see ?wflow_git_remote), click on the hyperlinks in the table below to view the files as they were in that past version.
| File | Version | Author | Date | Message |
|---|---|---|---|---|
| Rmd | d2fc383 | khembach | 2021-07-14 | include UNC13A in heatmap and feature plot |
| html | ecba9c2 | khembach | 2021-04-20 | Build site. |
| Rmd | 459907c | khembach | 2021-04-20 | include CSNK1E in list of marker genes; new heatmap colors |
| html | a983fc3 | khembach | 2021-01-21 | Build site. |
| html | 32f4cd3 | khembach | 2021-01-21 | Build site. |
| Rmd | 6c9f7ba | khembach | 2021-01-21 | heatmap with virus cell tropism markers |
| html | c56d284 | khembach | 2020-11-12 | Build site. |
| Rmd | ca4b784 | khembach | 2020-11-12 | save marker genes |
| html | ac0f11a | khembach | 2020-11-11 | Build site. |
| Rmd | d96dd7c | khembach | 2020-11-11 | fix cluster number and gene names for heatmap |
| html | 090b450 | khembach | 2020-11-11 | Build site. |
| html | a31892e | khembach | 2020-11-11 | Build site. |
| Rmd | 6a0642f | khembach | 2020-11-11 | subset to only glial clusters for reactive astrocyte heatmap |
| html | 4622291 | khembach | 2020-11-11 | Build site. |
| Rmd | 209f182 | khembach | 2020-11-11 | analyse expression of reactive astrocyte markers |
| html | ecbde99 | khembach | 2020-10-16 | Build site. |
| Rmd | 87ac379 | khembach | 2020-10-16 | DR with TDP expression |
| html | 3a0cb5c | khembach | 2020-10-16 | Build site. |
| Rmd | a528e83 | khembach | 2020-10-16 | cluster analysis TDP experiment |
Load packages
library(ComplexHeatmap)
library(cowplot)
library(ggplot2)
library(dplyr)
library(muscat)
library(purrr)
library(RColorBrewer)
library(viridis)
library(scran)
library(Seurat)
library(SingleCellExperiment)
library(stringr)
library(RCurl)
library(BiocParallel)
Load data & convert to SCE
so <- readRDS(file.path("output", "so_TDP_05_plasmid_expression.rds"))
sce <- as.SingleCellExperiment(so, assay = "RNA")
colData(sce) <- as.data.frame(colData(sce)) %>%
    mutate_if(is.character, as.factor) %>%
    DataFrame(row.names = colnames(sce))
Number of clusters by resolution
cluster_cols <- grep("res.[0-9]", colnames(colData(sce)), value = TRUE)
sapply(colData(sce)[cluster_cols], nlevels)
RNA_snn_res.0.2 RNA_snn_res.0.4 RNA_snn_res.0.8 RNA_snn_res.1
11 17 24 25 Cluster-sample counts
# set cluster IDs to resolution 0.4 clustering
so <- SetIdent(so, value = "RNA_snn_res.0.4")
so@meta.data$cluster_id <- Idents(so)
sce$cluster_id <- Idents(so)
(n_cells <- table(sce$cluster_id, sce$sample_id))
     TDP2wON TDP4wOFF TDP4wONa TDP4wONb
  0     1188     1015     1599     1384
  1     1168      938     1621      943
  2      907      811     1066     1091
  3      725      619      925      775
  4      616      560      996      771
  5      672      594      846      802
  6      576      411      477      243
  7      375      348      530      446
  8      450      307      444      467
  9      254      176      396      304
  10     207      174      307      251
  11      63       64      231      143
  12      97        3       88       36
  13      49       14       42       32
  14      37       17       23       24
  15      12       25       32        9
  16      10        1       42        1
Relative cluster-abundances
fqs <- prop.table(n_cells, margin = 2)
mat <- round(as.matrix(unclass(fqs))*100, 2)
colfunc <- colorRampPalette(c("ghostwhite", "deepskyblue4"))
Heatmap(mat,
    # col = rev(brewer.pal(11, "RdGy")[-6]),
    col = colfunc(10),
    name = "Percentage\nof cells",
    cluster_rows = FALSE,
    cluster_columns = FALSE,
    row_names_side = "left",
    row_title = "cluster ID",
    column_title = "sample ID",
    column_title_side = "bottom",
    rect_gp = gpar(col = "white"),
    cell_fun = function(i, j, x, y, width, height, fill)
        grid.text(mat[j, i], x = x, y = y,
            gp = gpar(col = "black", fontsize = 10)))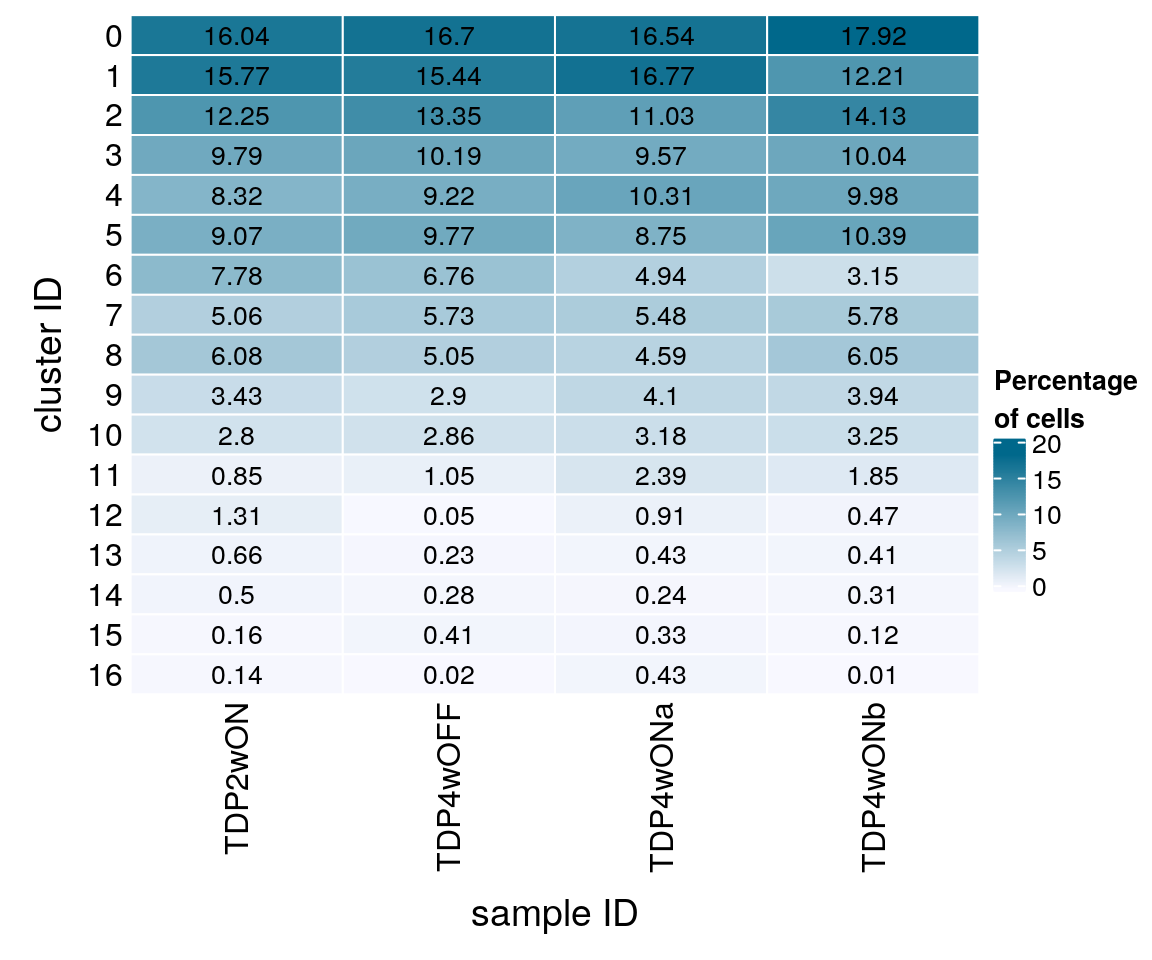
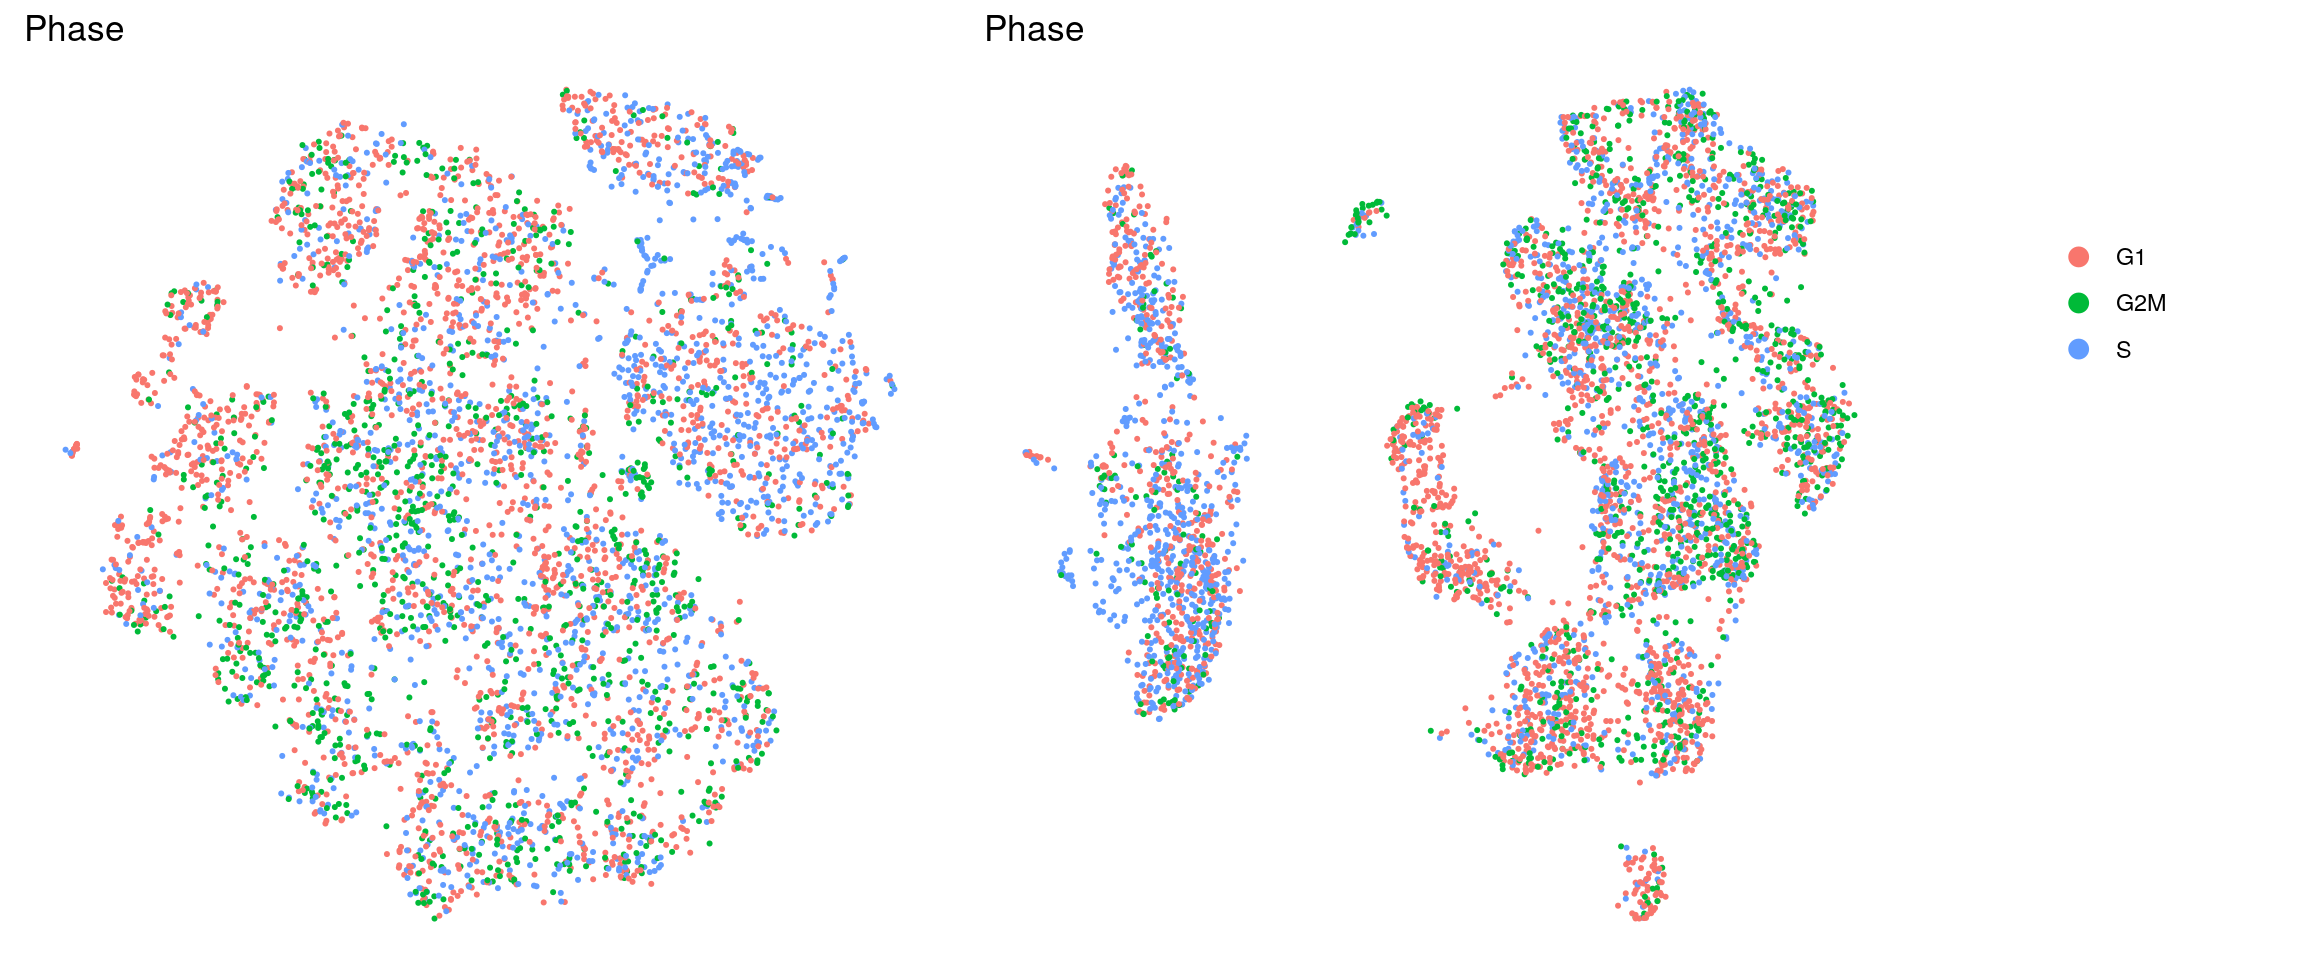
Cell cycle scoring with Seurat
We assign each cell a cell cycle scores and visualize them in the DR plots. We use known G2/M and S phase markers that come with the Seurat package. The markers are anticorrelated and cells that to not express the markers should be in G1 phase.
We compute cell cycle phase:
# A list of cell cycle markers, from Tirosh et al, 2015
cc_file <- getURL("https://raw.githubusercontent.com/hbc/tinyatlas/master/cell_cycle/Homo_sapiens.csv")
cc_genes <- read.csv(text = cc_file)
# match the marker genes to the features
m <- match(cc_genes$geneID[cc_genes$phase == "S"],
           str_split(rownames(GetAssayData(so)),
                     pattern = "\\.", simplify = TRUE)[,1])
s_genes <- rownames(GetAssayData(so))[m]
(s_genes <- s_genes[!is.na(s_genes)])
[1] "ENSG00000012963.UBR7" "ENSG00000049541.RFC2"
[3] "ENSG00000051180.RAD51" "ENSG00000073111.MCM2"
[5] "ENSG00000075131.TIPIN" "ENSG00000076003.MCM6"
[7] "ENSG00000076248.UNG" "ENSG00000077514.POLD3"
[9] "ENSG00000092470.WDR76" "ENSG00000092853.CLSPN"
[11] "ENSG00000093009.CDC45" "ENSG00000094804.CDC6"
[13] "ENSG00000095002.MSH2" "ENSG00000100297.MCM5"
[15] "ENSG00000101868.POLA1" "ENSG00000104738.MCM4"
[17] "ENSG00000111247.RAD51AP1" "ENSG00000112312.GMNN"
[19] "ENSG00000117748.RPA2" "ENSG00000118412.CASP8AP2"
[21] "ENSG00000119969.HELLS" "ENSG00000131153.GINS2"
[23] "ENSG00000132646.PCNA" "ENSG00000132780.NASP"
[25] "ENSG00000136492.BRIP1" "ENSG00000136982.DSCC1"
[27] "ENSG00000143476.DTL" "ENSG00000144354.CDCA7"
[29] "ENSG00000151725.CENPU" "ENSG00000156802.ATAD2"
[31] "ENSG00000159259.CHAF1B" "ENSG00000162607.USP1"
[33] "ENSG00000163950.SLBP" "ENSG00000167325.RRM1"
[35] "ENSG00000168496.FEN1" "ENSG00000171848.RRM2"
[37] "ENSG00000175305.CCNE2" "ENSG00000176890.TYMS"
[39] "ENSG00000197299.BLM" "ENSG00000198056.PRIM1"
[41] "ENSG00000276043.UHRF1" m <- match(cc_genes$geneID[cc_genes$phase == "G2/M"],
str_split(rownames(GetAssayData(so)),
pattern = "\\.", simplify = TRUE)[,1])
g2m_genes <- rownames(GetAssayData(so))[m]
(g2m_genes <- g2m_genes[!is.na(g2m_genes)]) [1] "ENSG00000010292.NCAPD2" "ENSG00000011426.ANLN"
[3] "ENSG00000013810.TACC3" "ENSG00000072571.HMMR"
[5] "ENSG00000075218.GTSE1" "ENSG00000080986.NDC80"
[7] "ENSG00000087586.AURKA" "ENSG00000088325.TPX2"
[9] "ENSG00000089685.BIRC5" "ENSG00000092140.G2E3"
[11] "ENSG00000094916.CBX5" "ENSG00000100401.RANGAP1"
[13] "ENSG00000102974.CTCF" "ENSG00000111665.CDCA3"
[15] "ENSG00000112742.TTK" "ENSG00000113810.SMC4"
[17] "ENSG00000114346.ECT2" "ENSG00000115163.CENPA"
[19] "ENSG00000117399.CDC20" "ENSG00000117724.CENPF"
[21] "ENSG00000120802.TMPO" "ENSG00000123975.CKS2"
[23] "ENSG00000126787.DLGAP5" "ENSG00000129195.PIMREG"
[25] "ENSG00000131747.TOP2A" "ENSG00000134222.PSRC1"
[27] "ENSG00000134690.CDCA8" "ENSG00000136108.CKAP2"
[29] "ENSG00000137804.NUSAP1" "ENSG00000137807.KIF23"
[31] "ENSG00000138160.KIF11" "ENSG00000138182.KIF20B"
[33] "ENSG00000138778.CENPE" "ENSG00000139354.GAS2L3"
[35] "ENSG00000143228.NUF2" "ENSG00000143401.ANP32E"
[37] "ENSG00000143815.LBR" "ENSG00000148773.MKI67"
[39] "ENSG00000157456.CCNB2" "ENSG00000164104.HMGB2"
[41] "ENSG00000169607.CKAP2L" "ENSG00000169679.BUB1"
[43] "ENSG00000170312.CDK1" "ENSG00000173207.CKS1B"
[45] "ENSG00000175063.UBE2C" "ENSG00000175216.CKAP5"
[47] "ENSG00000184661.CDCA2" "ENSG00000188229.TUBB4B"
[49] "ENSG00000189159.JPT1" so <- CellCycleScoring(so, s.features = s_genes, g2m.features = g2m_genes,
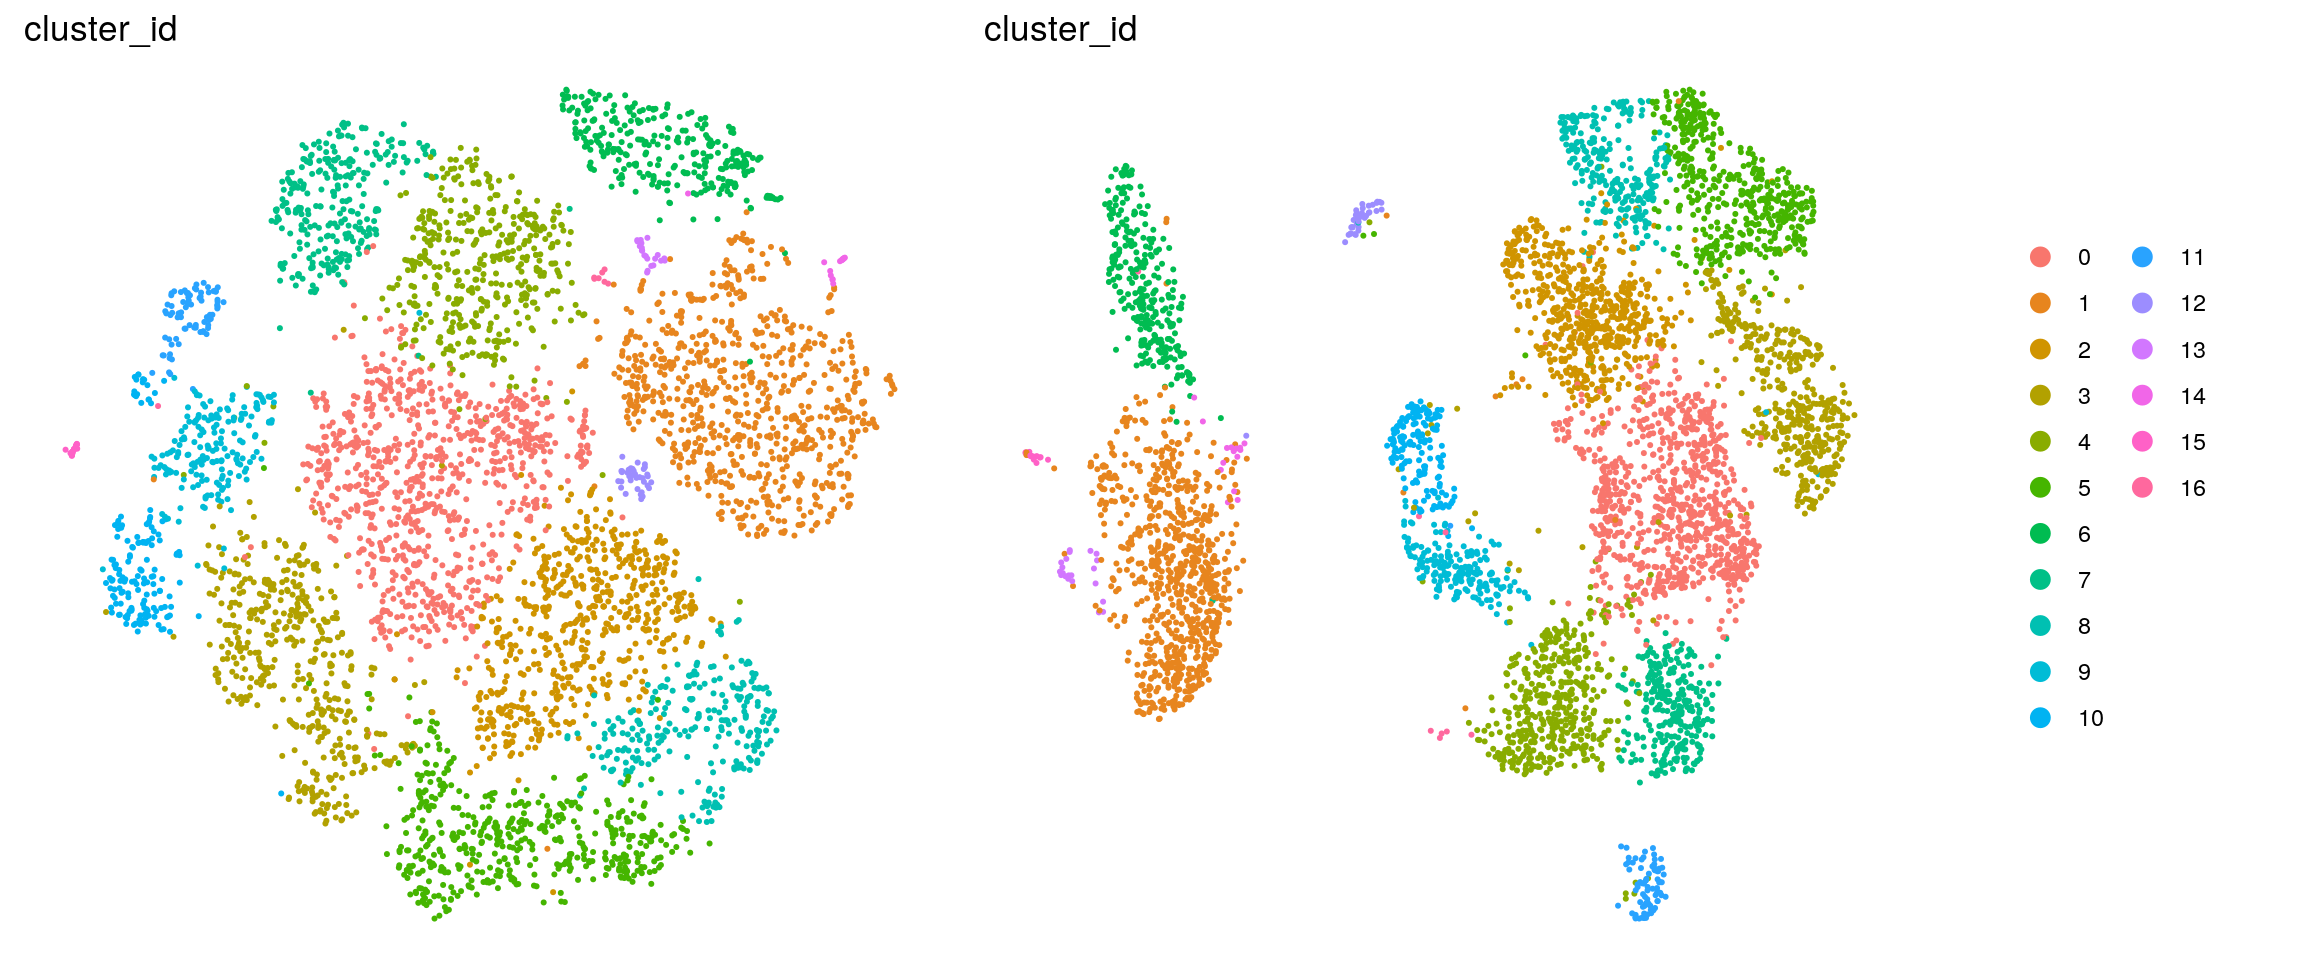
set.ident = TRUE)DR colored by cluster ID
cs <- sample(colnames(so), 5e3)
.plot_dr <- function(so, dr, id)
DimPlot(so, cells = cs, group.by = id, reduction = dr, pt.size = 0.4) +
guides(col = guide_legend(nrow = 11,
override.aes = list(size = 3, alpha = 1))) +
theme_void() + theme(aspect.ratio = 1)
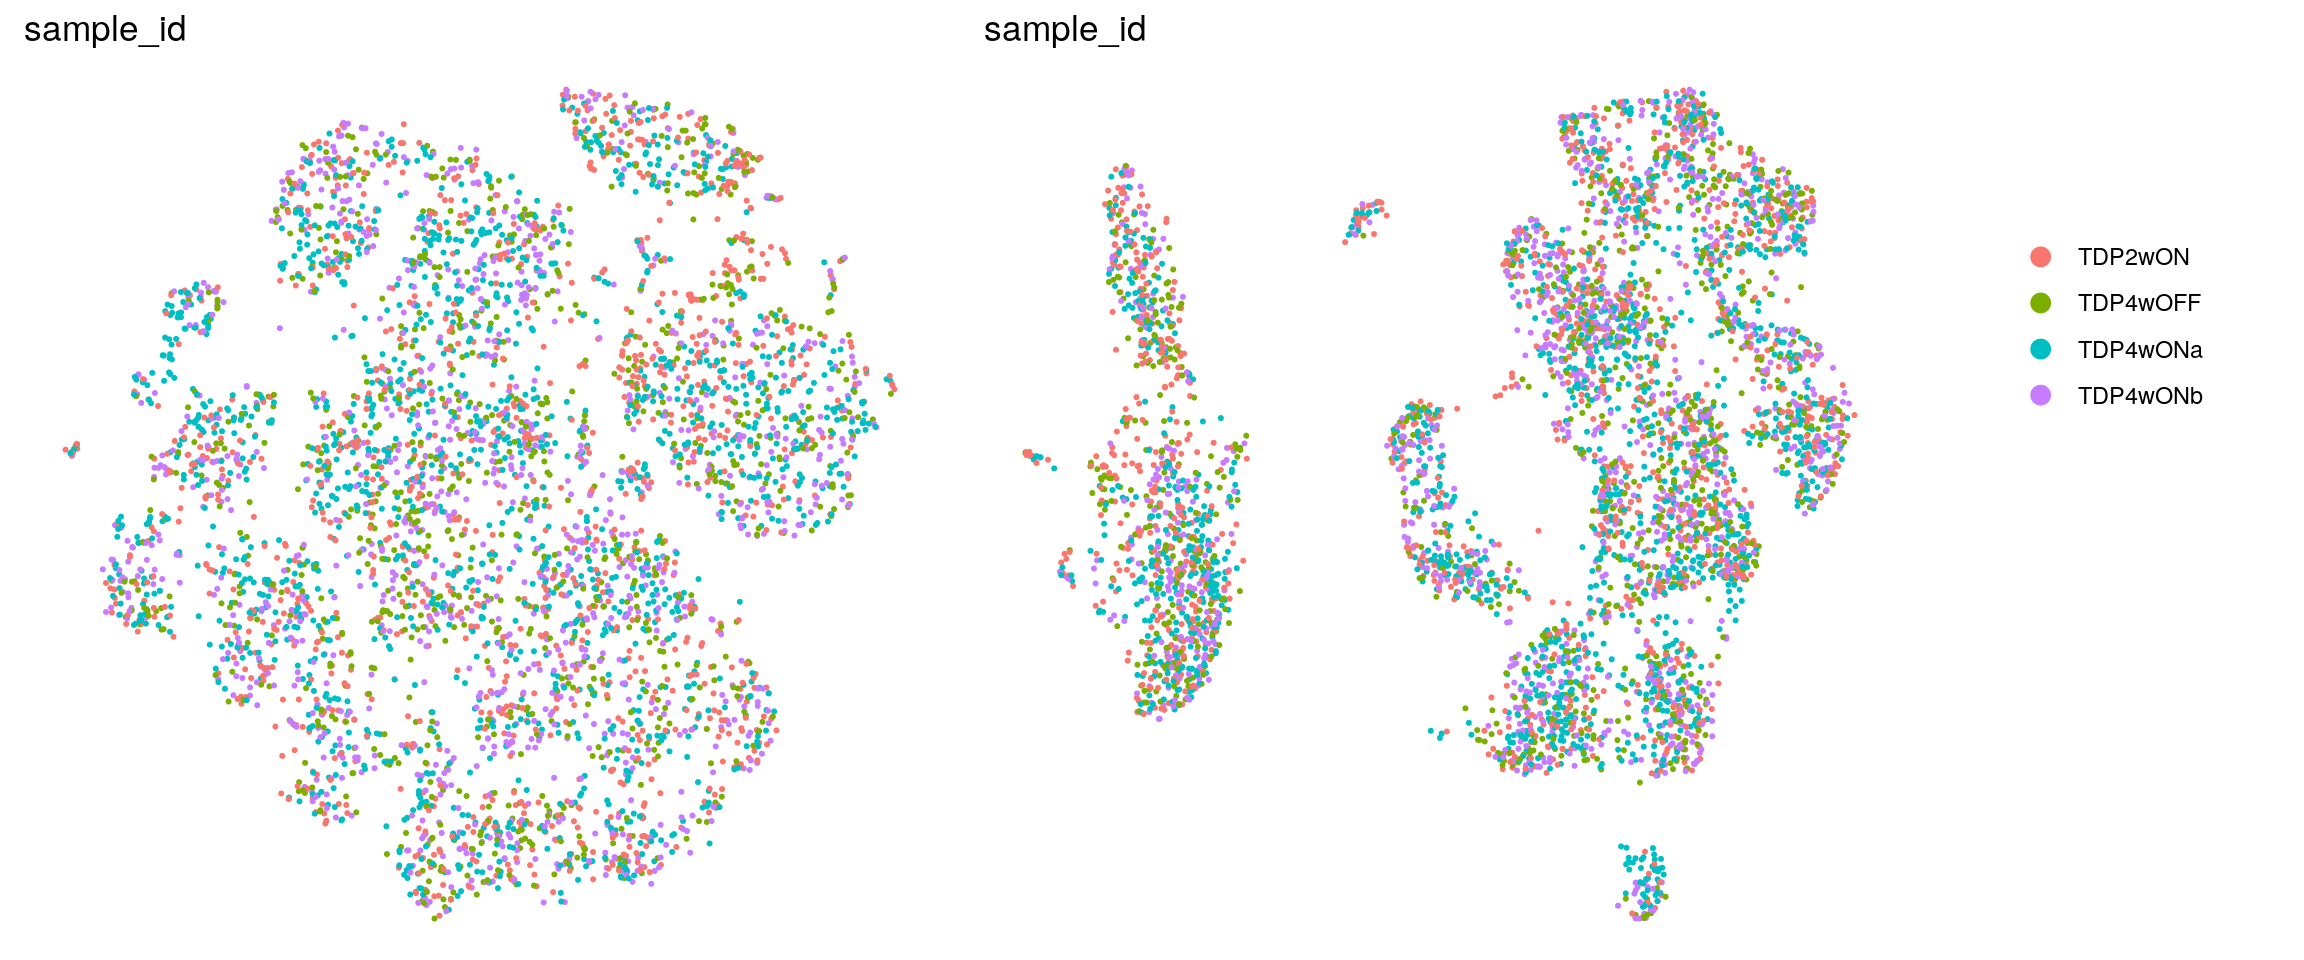
ids <- c("cluster_id", "sample_id", "Phase")
for (id in ids) {
cat("## ", id, "\n")
p1 <- .plot_dr(so, "tsne", id)
lgd <- get_legend(p1)
p1 <- p1 + theme(legend.position = "none")
p2 <- .plot_dr(so, "umap", id) + theme(legend.position = "none")
ps <- plot_grid(plotlist = list(p1, p2), nrow = 1)
p <- plot_grid(ps, lgd, nrow = 1, rel_widths = c(1, 0.2))
print(p)
cat("\n\n")
}cluster_id
sample_id
Find markers using scran
Markers
We identify candidate marker genes for each cluster that enable a separation of that group from any other group. The null hypothesis is that the log FC between a cluster and the compared cluster is 2.
scran_markers <- findMarkers(sce,
    groups = sce$cluster_id, block = sce$sample_id,
    direction = "up", lfc = 2, full.stats = TRUE, log.p = FALSE)
We write tables with the top marker genes per cluster.
gs2 <- lapply(scran_markers, function(u) u[u$Top %in% 1:2,])
for (i in seq_along(gs2)) {
  write.table(x = gs2[[i]] %>% as.data.frame %>%
                dplyr::mutate(gene = rownames(gs2[[i]])) %>%
                dplyr::relocate(gene),
              file =  file.path("output",
                                paste0("TDP-06-no_integration_cluster", i-1, "_marker_genes.txt")),
              sep = "\t", quote = FALSE, row.names = FALSE)
}
Heatmap of mean marker-exprs. by cluster
We aggregate the cells to pseudobulks and plot the average expression of the condidate marker genes in each of the clusters.
## including marker genes of rank 1 and 2
gs <- lapply(scran_markers, function(u) rownames(u)[u$Top %in% 1:2])
## candidate cluster markers
lapply(gs, function(x) {
  y <- str_split(x, pattern = "\\.", simplify = TRUE)[,2]
  y[which(y == "")] <- x[which(y == "")]
  y
  })
$`0`
[1] "SAMD11" "SCG2" "SCRG1" "FABP7" "TAC1" "STMN2" "RTN1"
[8] "SEZ6L2" "MT-ND4L" "NOC2L" "UTS2" "IGFBP5" "GAP43" "VGF"
[15] "MT-ND5"
$`1`
[1] "C1orf61" "FABP5" "VIM" "GFAP" "MT-CO1" "MT-ND4L" "FGFBP2"
[8] "SPARCL1" "SPP1" "METRN" "S100B" "MT-ND1" "MT-ND4"
$`2`
[1] "UTS2" "IGFBP2" "SCRG1" "PNOC" "STMN2" "RTN1" "SEZ6L2"
[8] "SAMD11" "GAP43" "VGF" "LAPTM4B" "PCP4" "MT-ND4L"
$`3`
[1] "S100A10" "IGFBP5" "FABP7" "TAC1" "STMN2" "UTS2" "VGF"
[8] "MT-ND5"
$`4`
[1] "UTS2" "TRH" "CRH" "STMN2" "NTS" "TAC1" "CSRP2" "RTN1"
[9] "MT-ND5"
$`5`
[1] "S100A10" "VGF" "PNOC" "STMN2" "SAMD11" "IGFBP5" "SCRG1"
[8] "TAC1" "MT-RNR2" "MT-ND5"
$`6`
[1] "PTGDS" "DLK1" "METRN" "TTYH1" "MT-CO1" "C1orf61" "CLU"
[8] "LY6H" "VIM" "MT-CO3"
$`7`
[1] "UTS2" "CRH" "STMN2" "PCP4" "MT-ND5"
$`8`
[1] "IGFBP5" "NEFM" "PNOC" "STMN2" "RTN1" "MT-ND4L" "SAMD11"
[8] "GAP43" "SPP1" "VGF" "LAPTM4B" "MT-ND5"
$`9`
[1] "S100A10" "TAC1" "CRH" "STMN2" "LYPD1" "IGFBP5" "VGF"
[8] "NTS" "RTN1" "HOXB5"
$`10`
[1] "S100A10" "PCSK1" "TAC1" "VGF" "STMN2" "TRH" "DLK1"
$`11`
[1] "WDPCP" "IGFBP5" "NRN1" "TAC1" "CRH" "STMN2" "SNCG"
[8] "MT-ND5" "CHL1" "GPX1" "ATP2B1" "RTN1" "CALB2" "MT-ND4L"
$`12`
[1] "NPTX2" "STMN2" "TDP43-HA" "FGF18" "MEF2A" "MT-ND4"
$`13`
[1] "C1orf61" "VIM" "CKB" "PCLAF" "METRN" "GFAP" "MT-ND4"
[8] "SPP1" "TYMS" "MT-CO1" "MT-ND4L"
$`14`
[1] "SPP1" "VIM" "CRYAB" "FTL" "DDIT3"
$`15`
[1] "S100A11" "COL1A1" "LGALS1" "COL3A1"
$`16`
[1] "UTS2" "C1orf61" "CRH" "STMN2" "CLU" "VIM" "METRN" sub <- sce[unique(unlist(gs)), ]
pbs <- aggregateData(sub, assay = "logcounts", by = "cluster_id", fun = "mean")
mat <- t(muscat:::.scale(assay(pbs)))
## remove the Ensembl ID from the gene names
cnames <- colnames(mat)
colnames(mat) <- str_split(cnames, pattern = "\\.", simplify = TRUE)[,2]
colnames(mat)[which(colnames(mat) == "")] <- cnames[which(colnames(mat) == "")]
Heatmap(mat,
name = "scaled avg.\nexpression",
col = viridis(10),
cluster_rows = FALSE,
cluster_columns = FALSE,
row_names_side = "left",
row_title = "cluster_id",
rect_gp = gpar(col = "white"))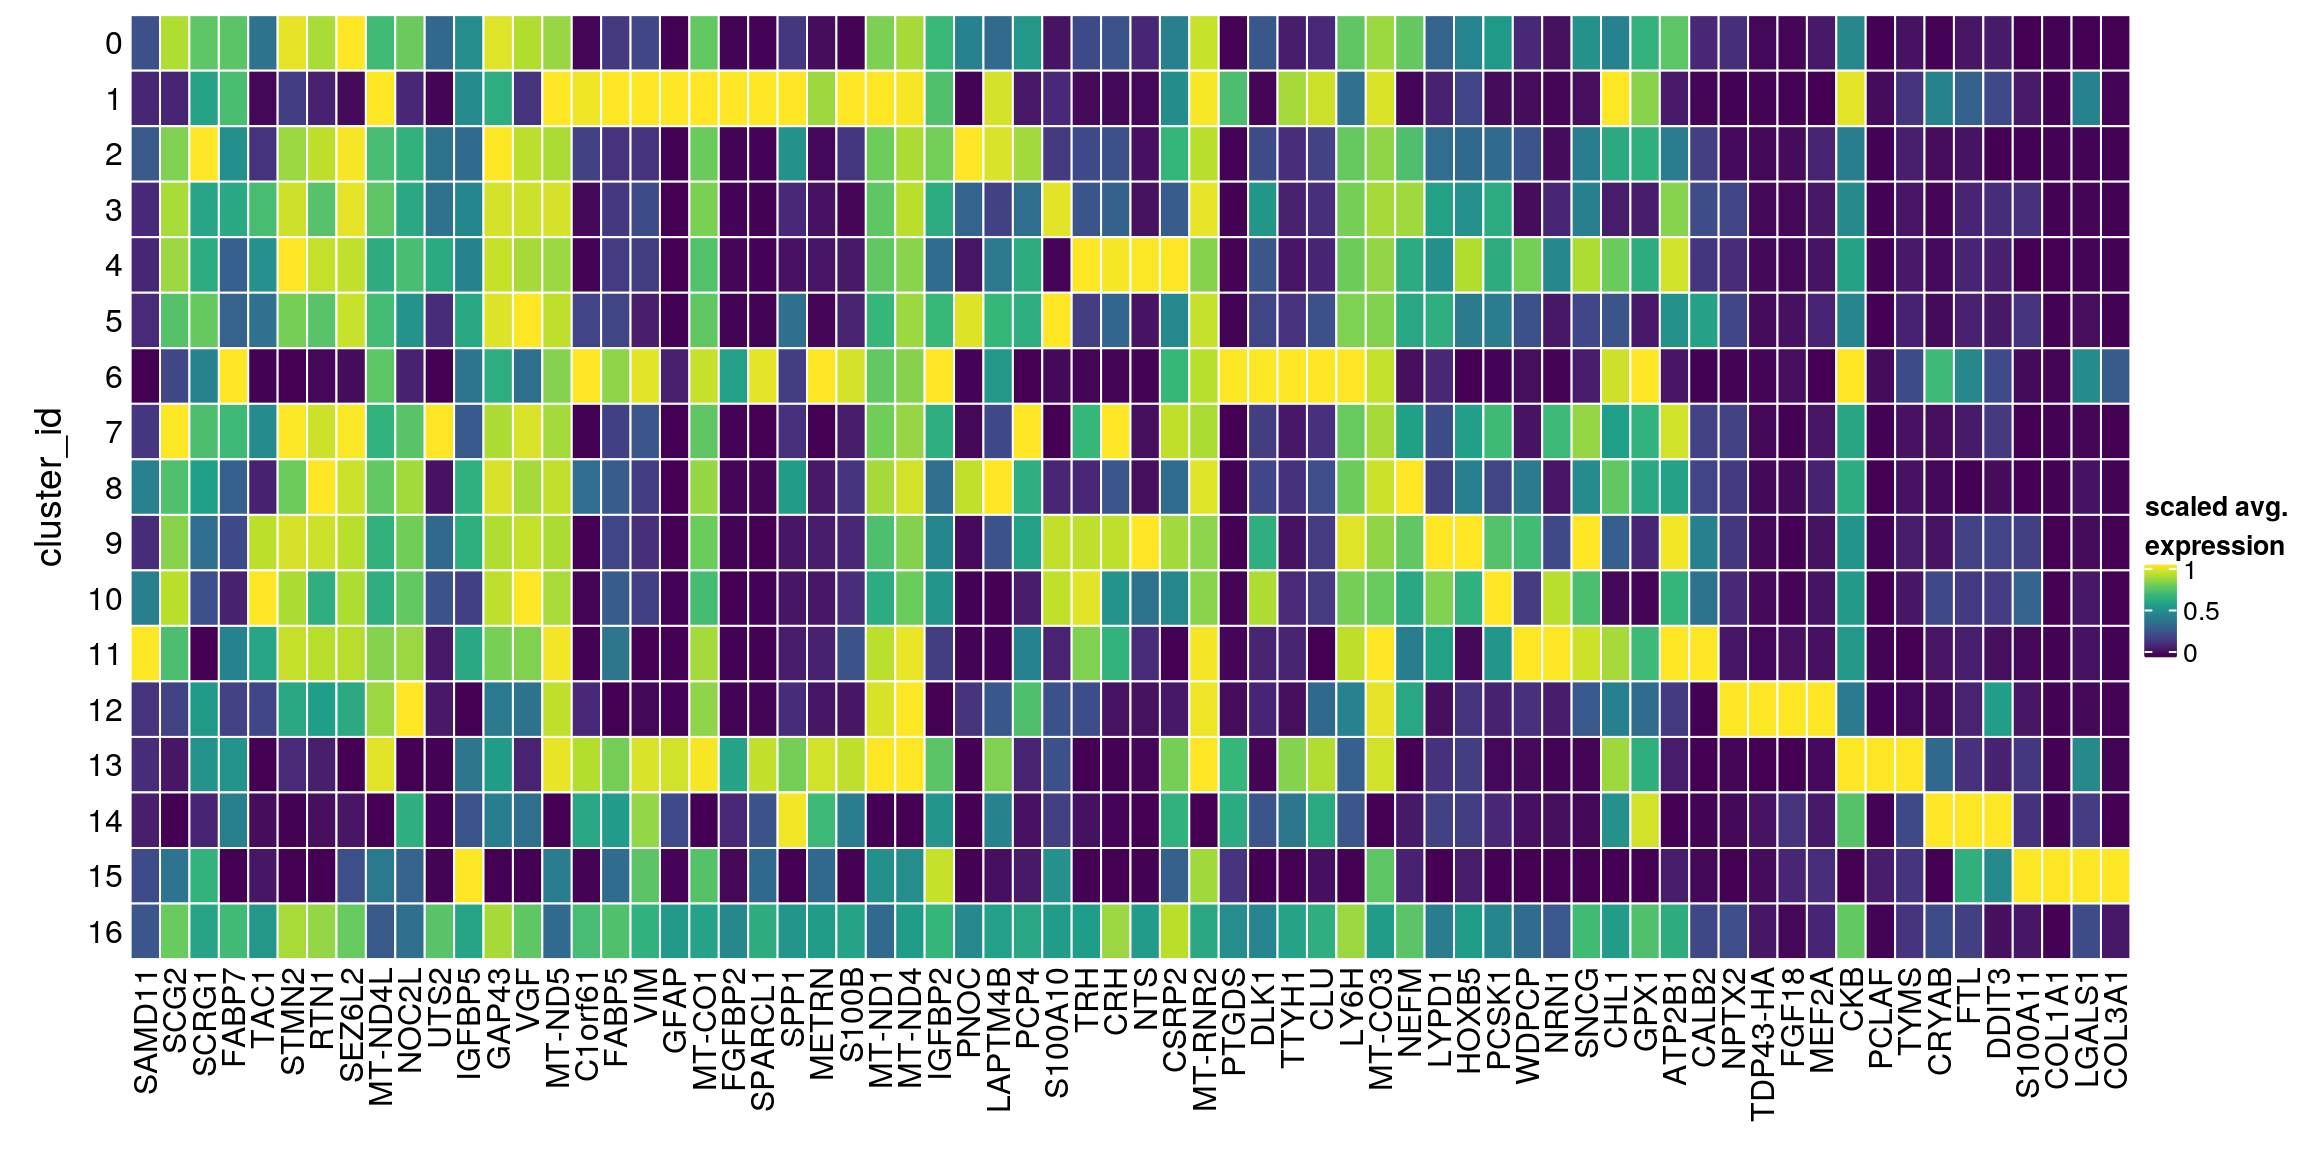
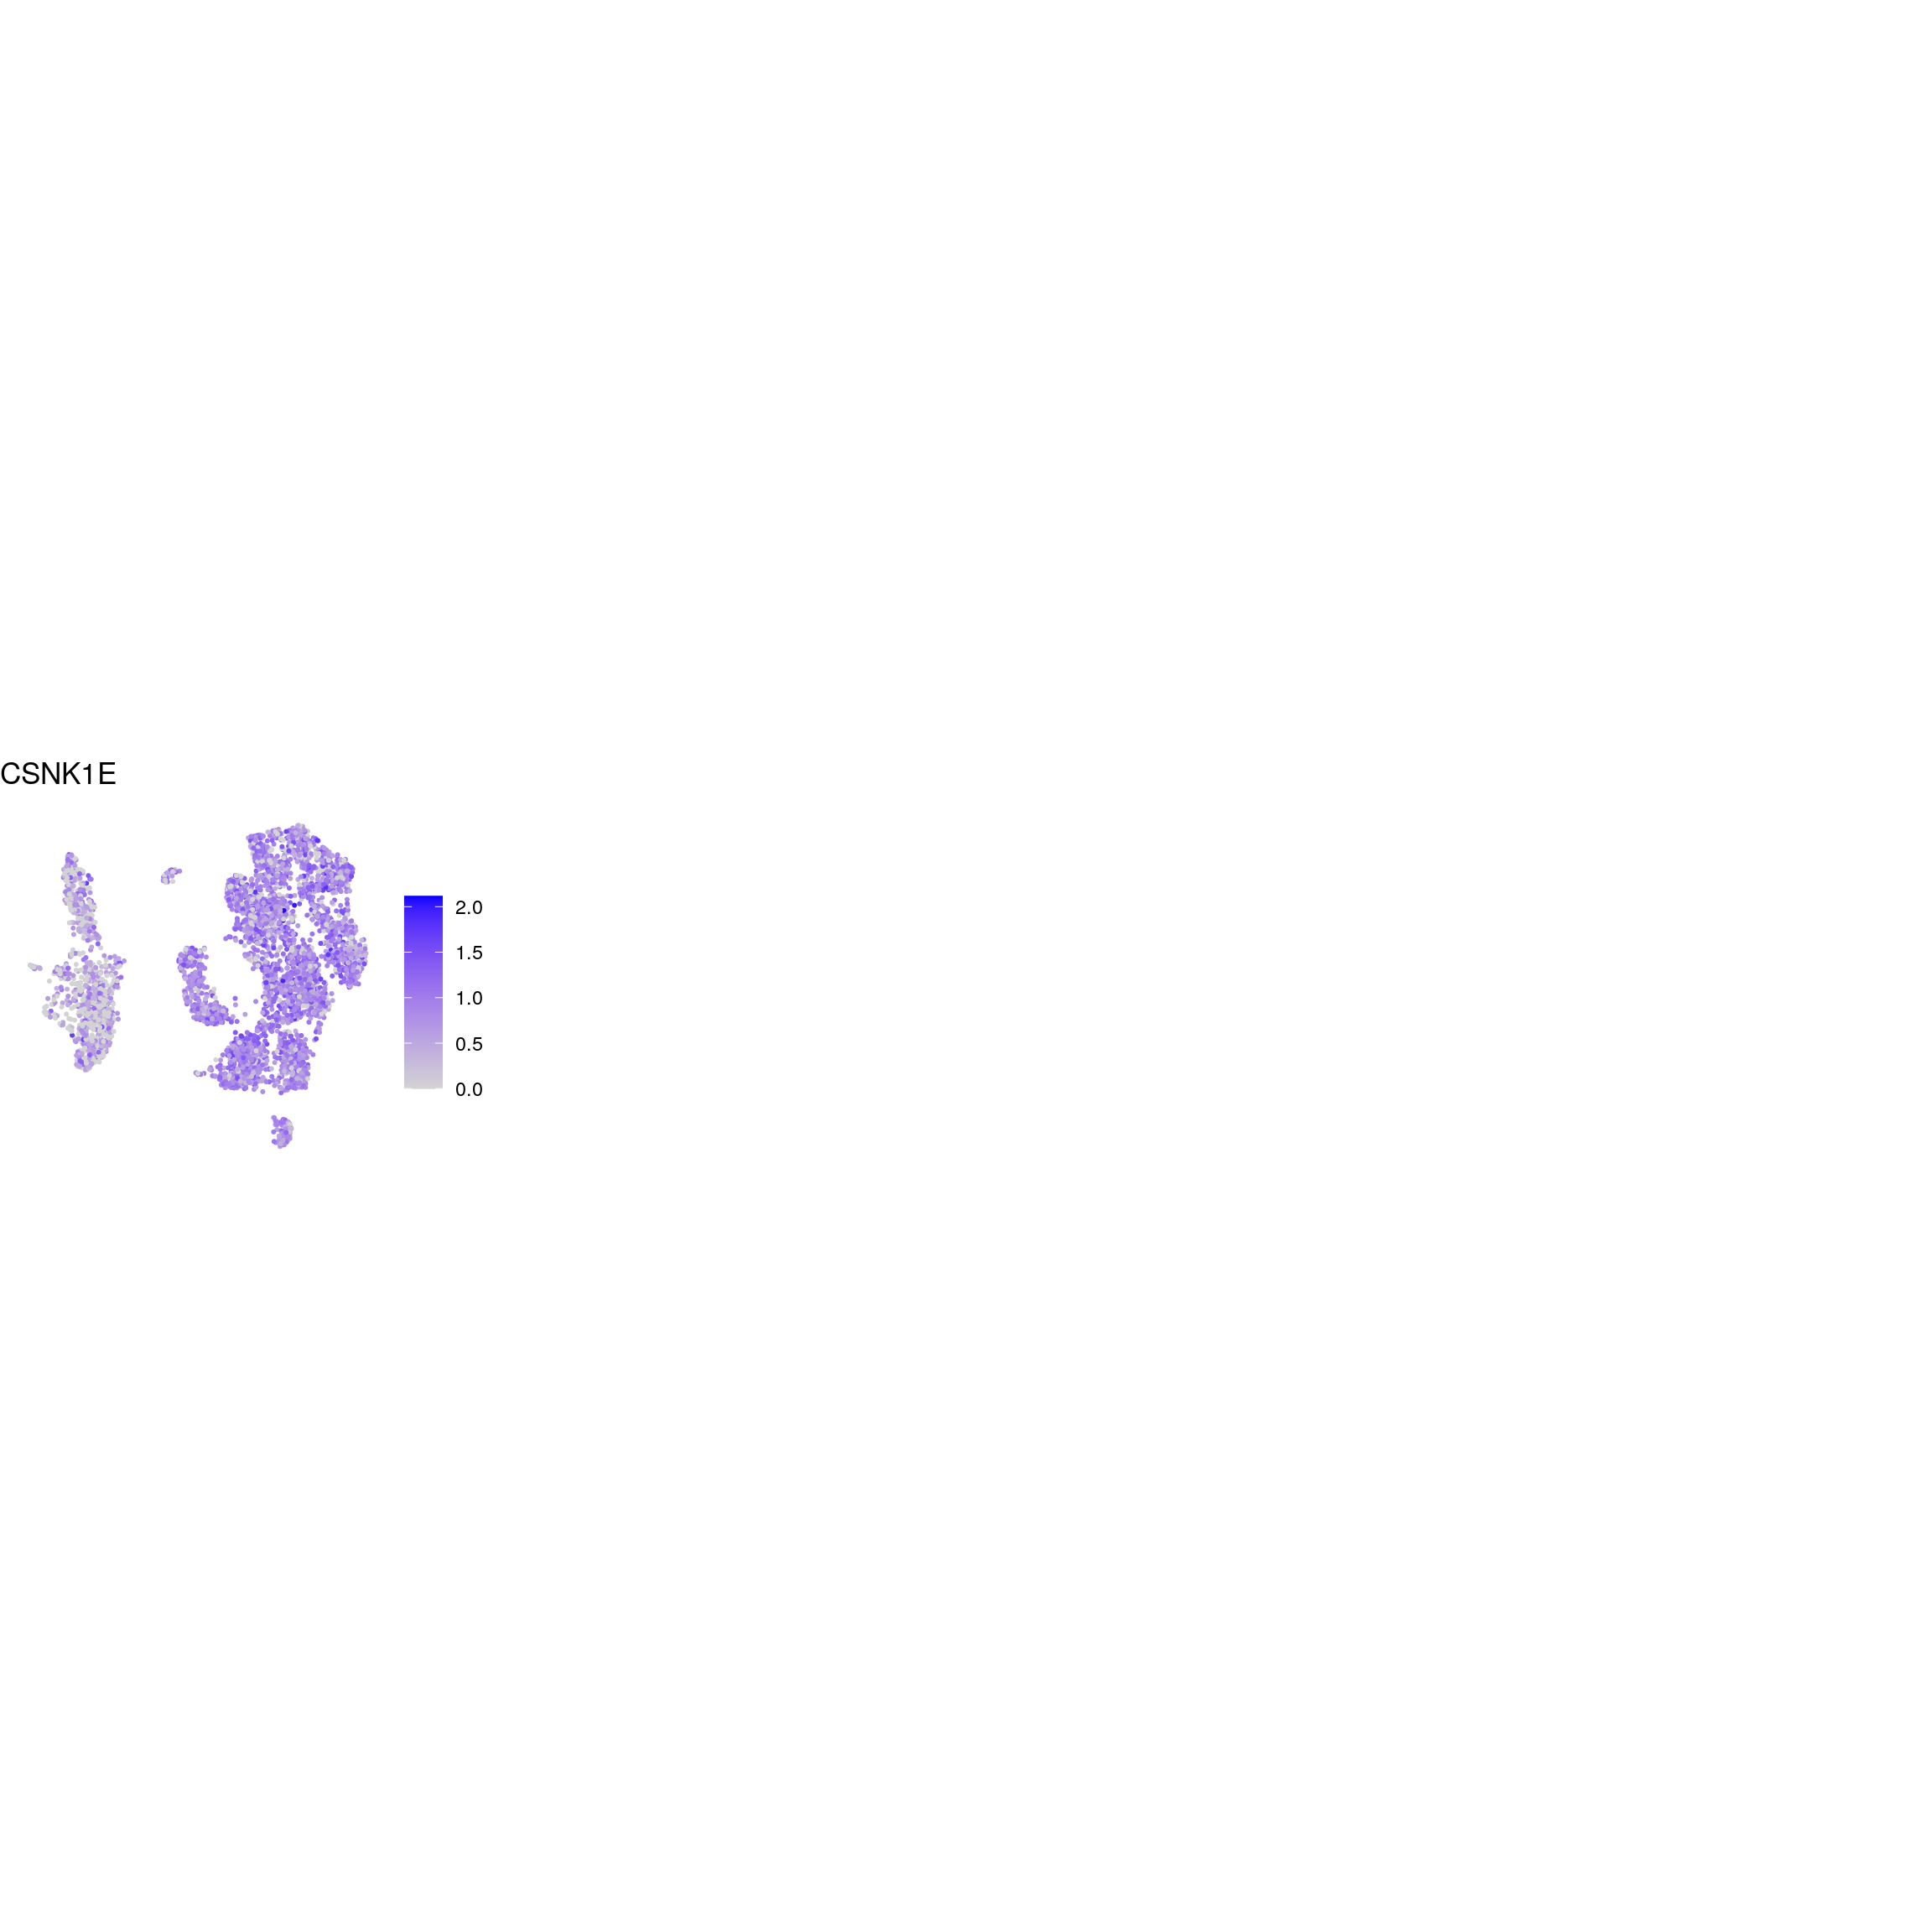
Known marker genes
Apart from the usual marker genes, we also want to analyse the expression of Casein Kinase 1 Epsilon (CSNK1E).
## source file with list of known marker genes
source(file.path("data", "known_cell_type_markers.R"))
fs[["kinase"]] <- "CSNK1E"
fs[["ALS-related"]] <- "UNC13A"

fs <- lapply(fs, sapply, function(g)
    grep(pattern = paste0("\\.", g, "$"), rownames(sce), value = TRUE)
  )

fs <- lapply(fs, function(x) unlist(x[lengths(x) !=0]) )

gs <- gsub(".*\\.", "", unlist(fs))
ns <- vapply(fs, length, numeric(1))
ks <- rep.int(names(fs), ns)
labs <- lapply(fs, function(x) gsub(".*\\.", "",x))
Heatmap of mean marker-exprs. by cluster
# split cells by cluster
cs_by_k <- split(colnames(sce), sce$cluster_id)
# compute cluster-marker means
ms_by_cluster <- lapply(fs, function(gs) vapply(cs_by_k, function(i)
        Matrix::rowMeans(logcounts(sce)[gs, i, drop = FALSE]),
        numeric(length(gs))))
# prep. for plotting & scale b/w 0 and 1
mat <- do.call("rbind", ms_by_cluster)
mat <- muscat:::.scale(mat)
rownames(mat) <- gs
cols <- muscat:::.cluster_colors[seq_along(fs)]
cols <- setNames(cols, names(fs))
row_anno <- rowAnnotation(
    df = data.frame(label = factor(ks, levels = names(fs))),
    col = list(label = cols), gp = gpar(col = "white"))
# percentage of cells from each of the samples per cluster
sample_props <- prop.table(n_cells, margin = 1)
col_mat <- as.matrix(unclass(sample_props))
sample_cols <- c("#882255", "#11588A",  "#117733", "#44AA99")
sample_cols <- setNames(sample_cols, colnames(col_mat))
col_anno <- HeatmapAnnotation(
    perc_sample = anno_barplot(col_mat, gp = gpar(fill = sample_cols),
                               height = unit(2, "cm"),
                               border = FALSE),
    annotation_label = "fraction of sample\nin cluster",
    gap = unit(10, "points"))
col_lgd <- Legend(labels = names(sample_cols),
       title = "sample",
       legend_gp = gpar(fill = sample_cols))

hm <- Heatmap(mat,
    name = "scaled avg.\nexpression",
    col = viridis(10),
    cluster_rows = FALSE,
    cluster_columns = FALSE,
    row_names_side = "left",
    column_title = "cluster_id",
    column_title_side = "bottom",
    column_names_side = "bottom",
    column_names_rot = 0,
    column_names_centered = TRUE,
    rect_gp = gpar(col = "white"),
    left_annotation = row_anno,
    top_annotation = col_anno)
draw(hm, annotation_legend_list = list(col_lgd))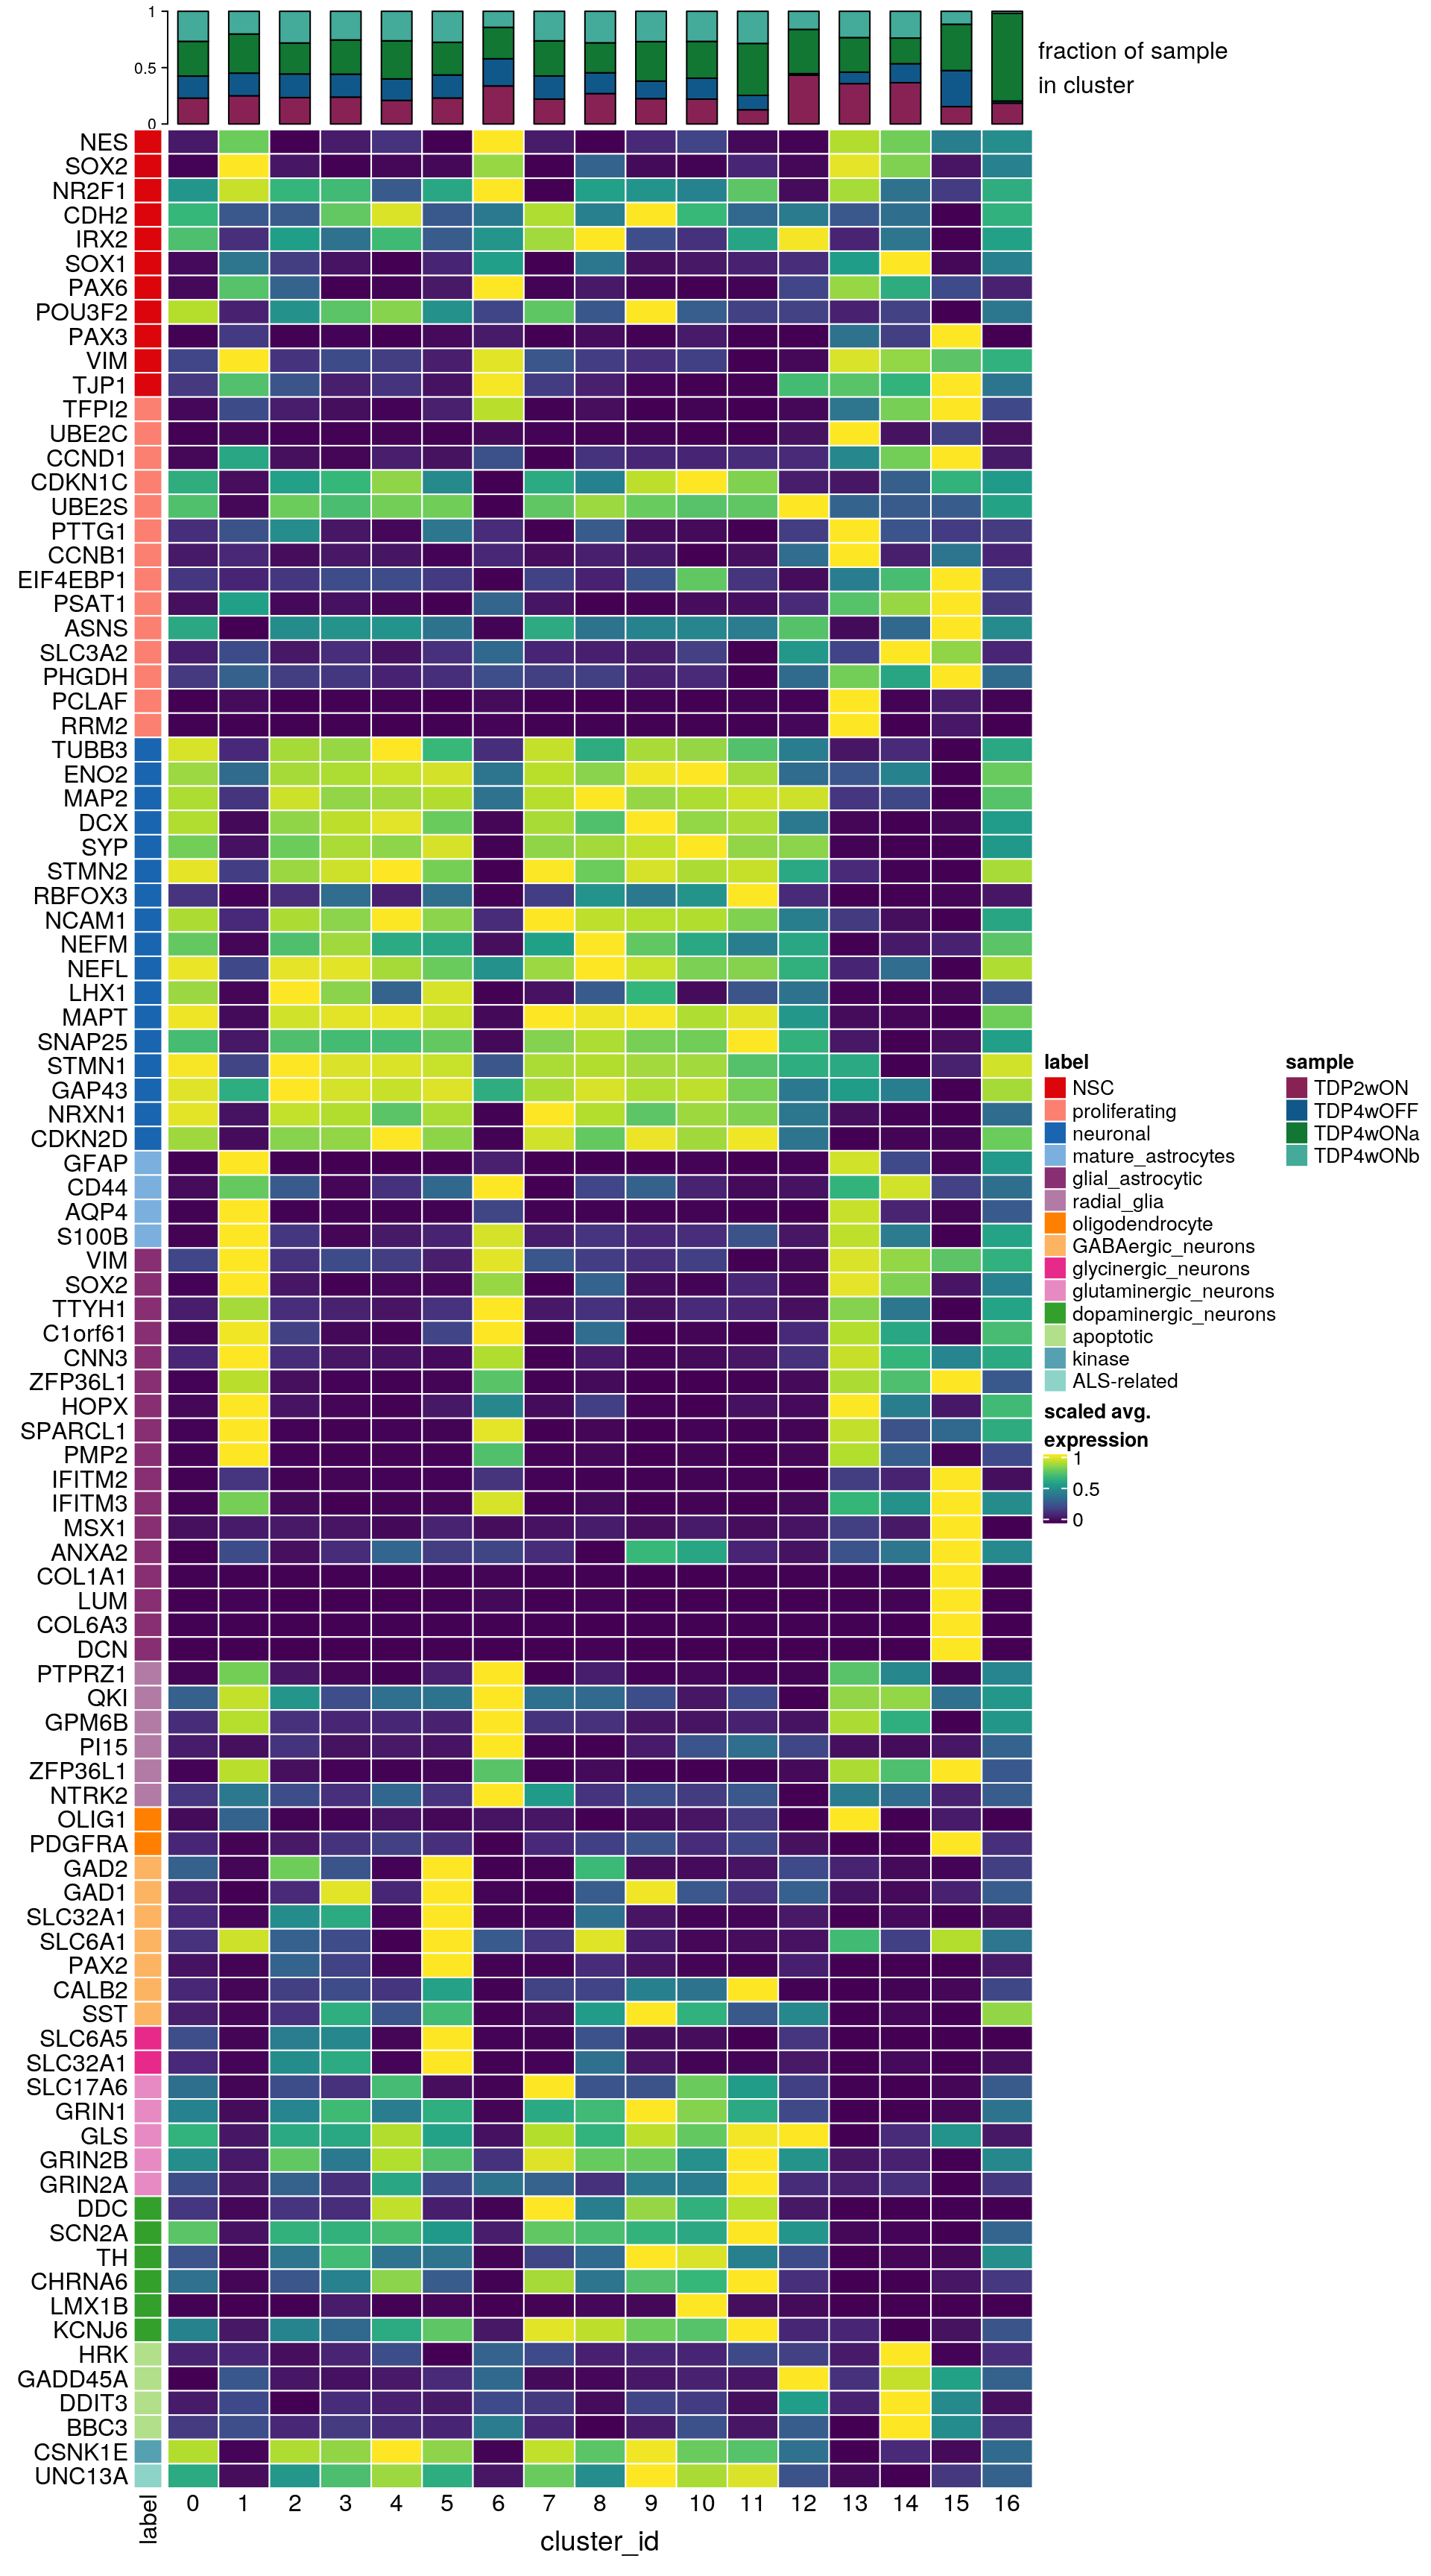
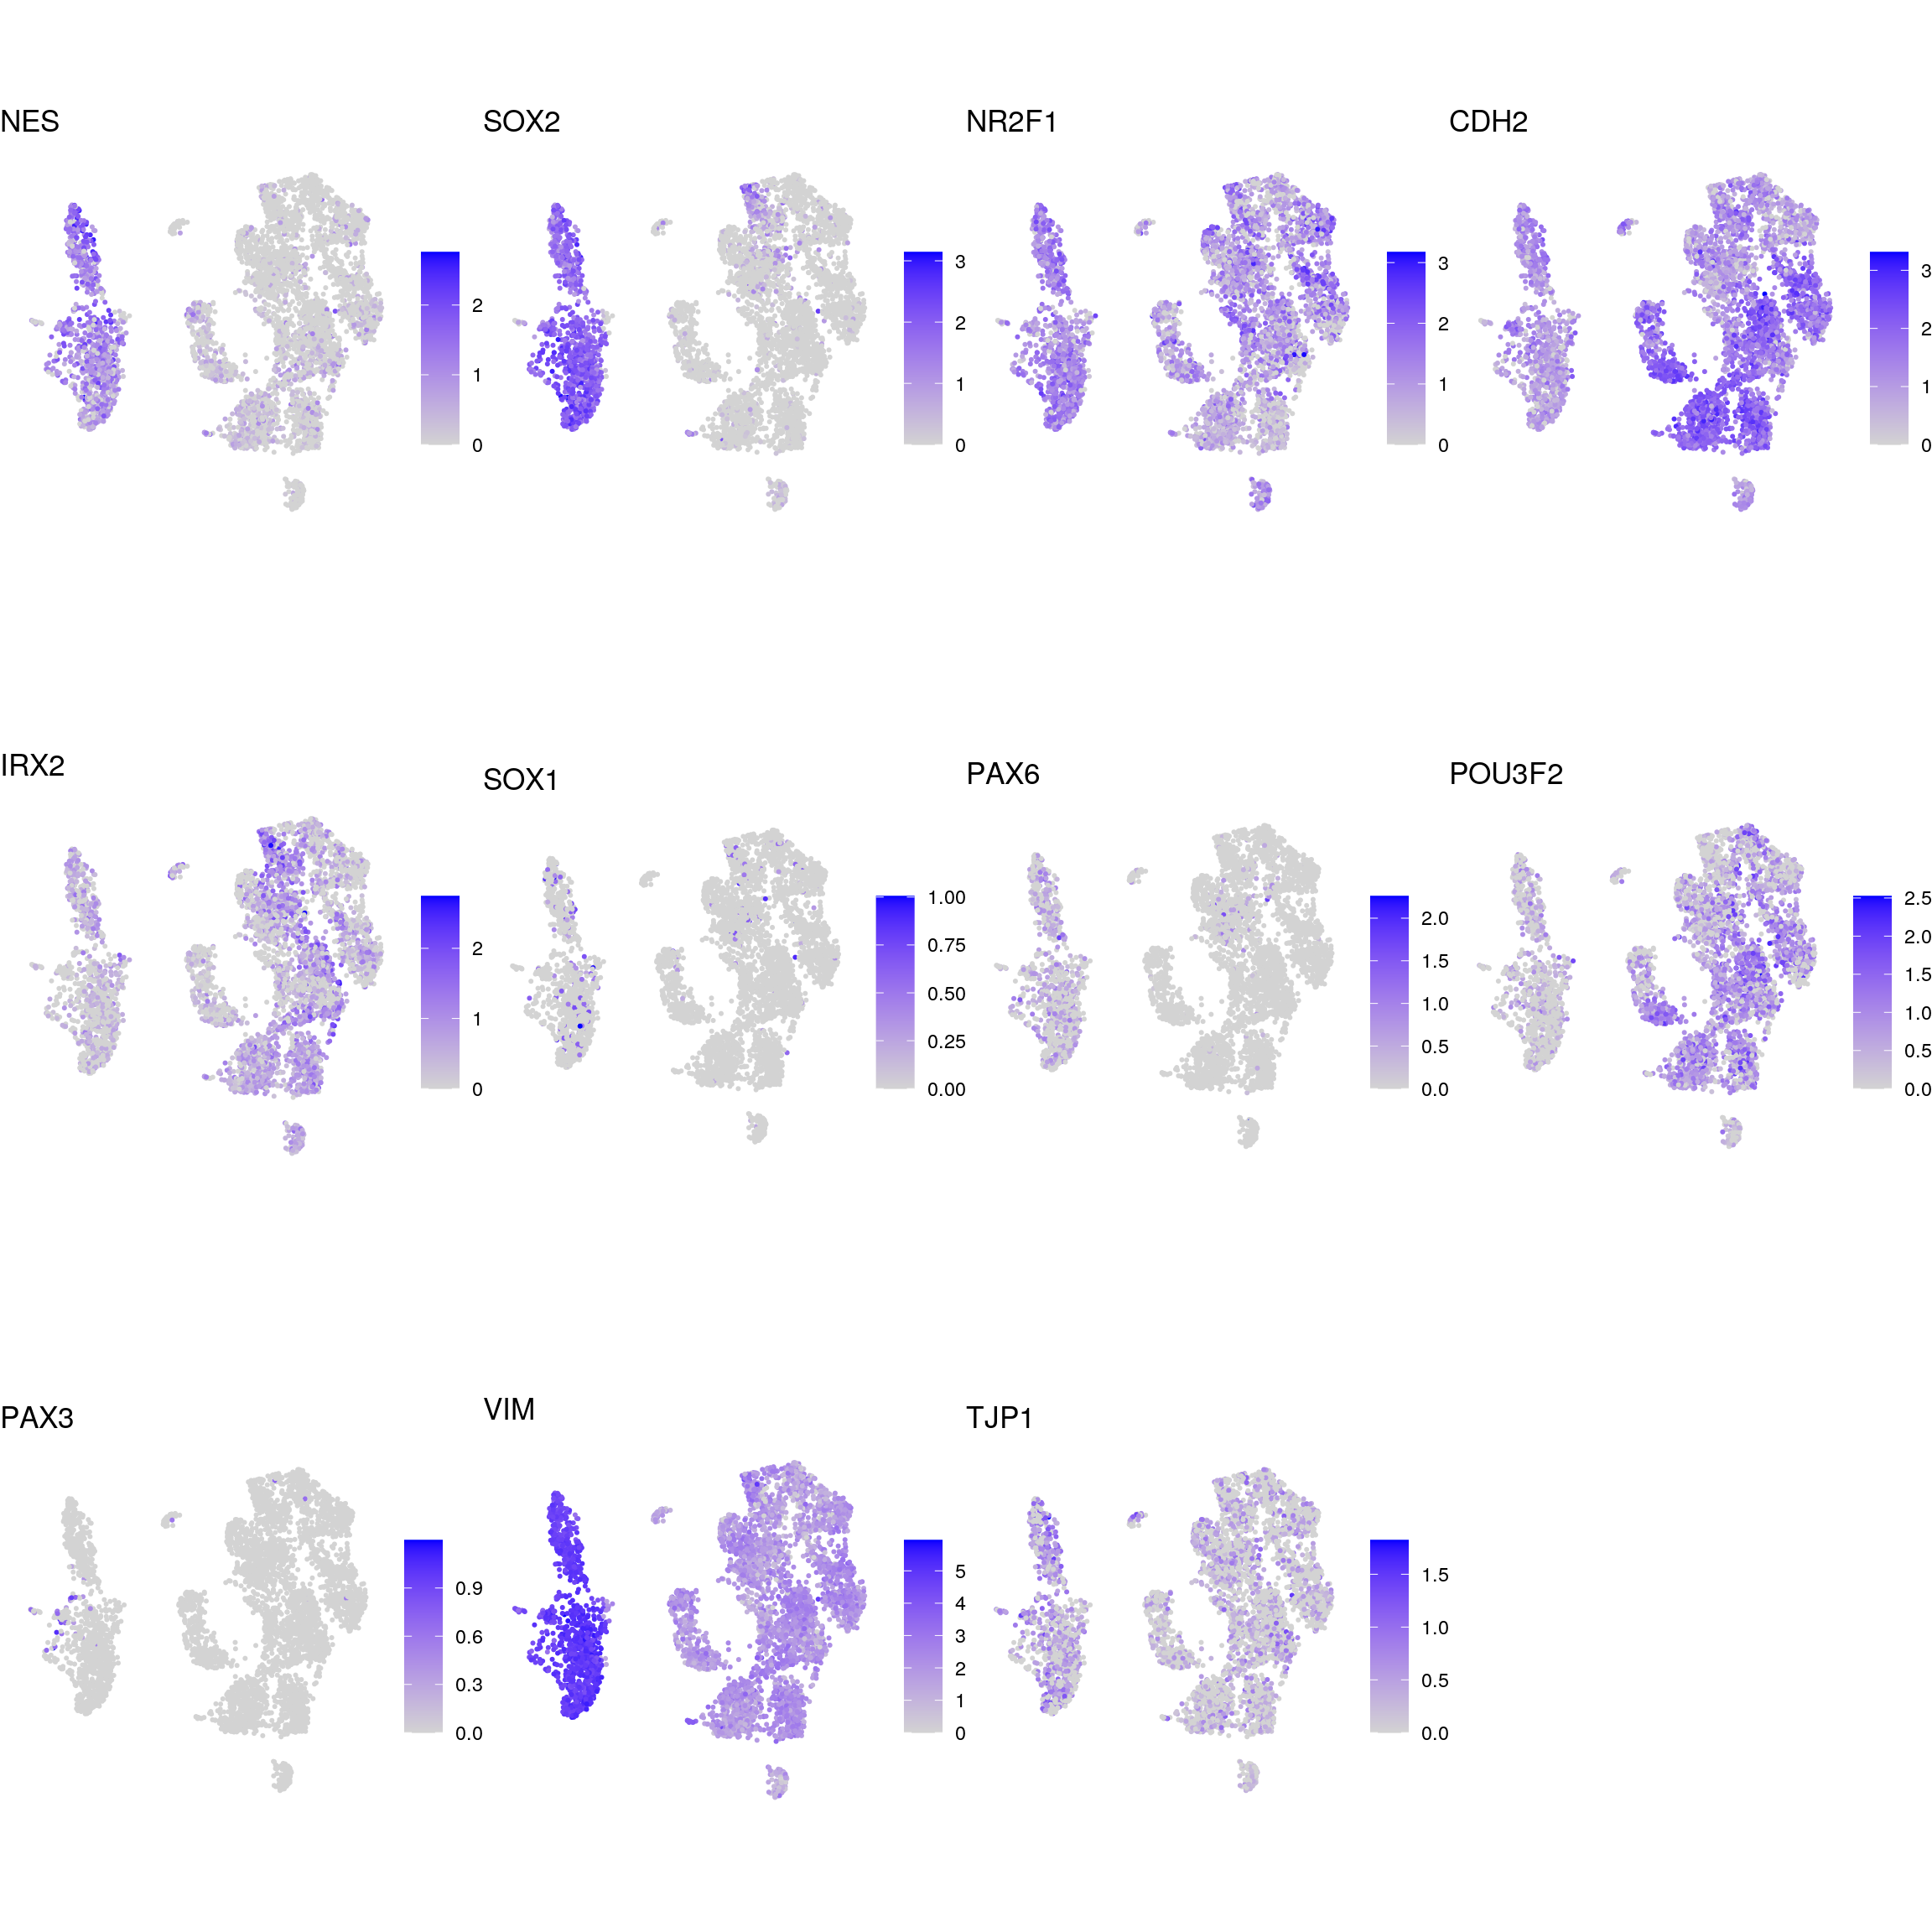
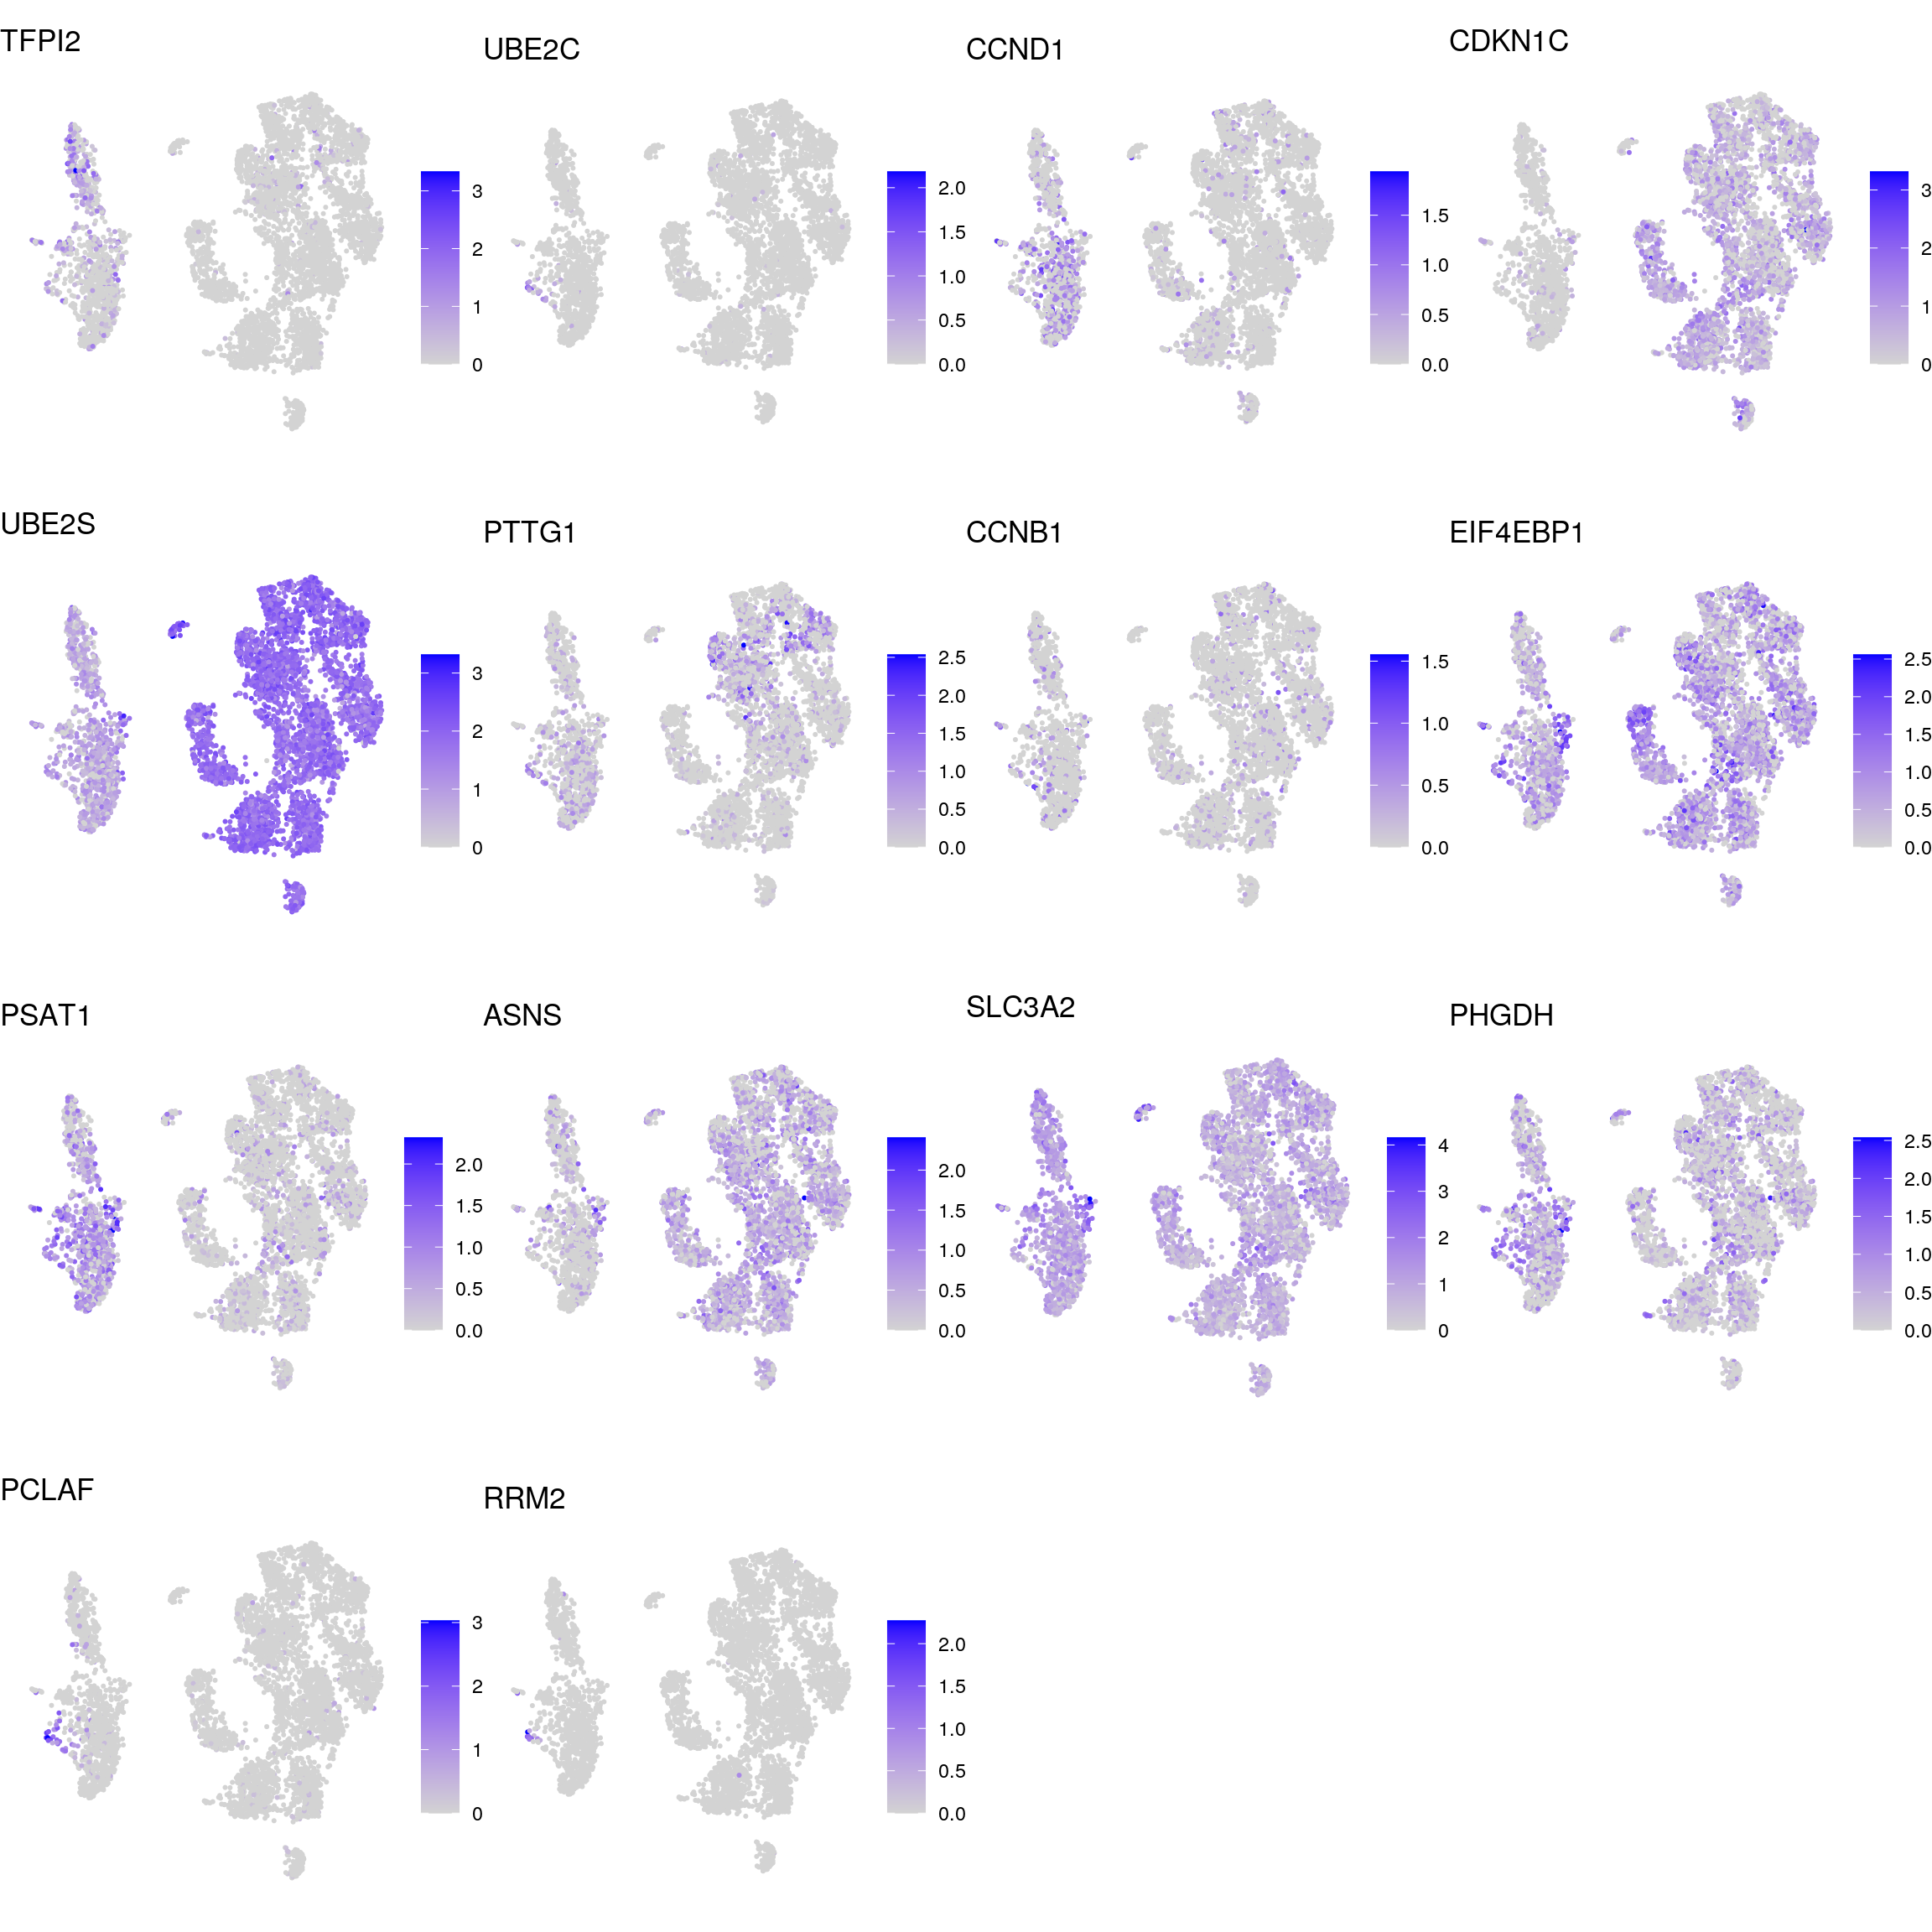
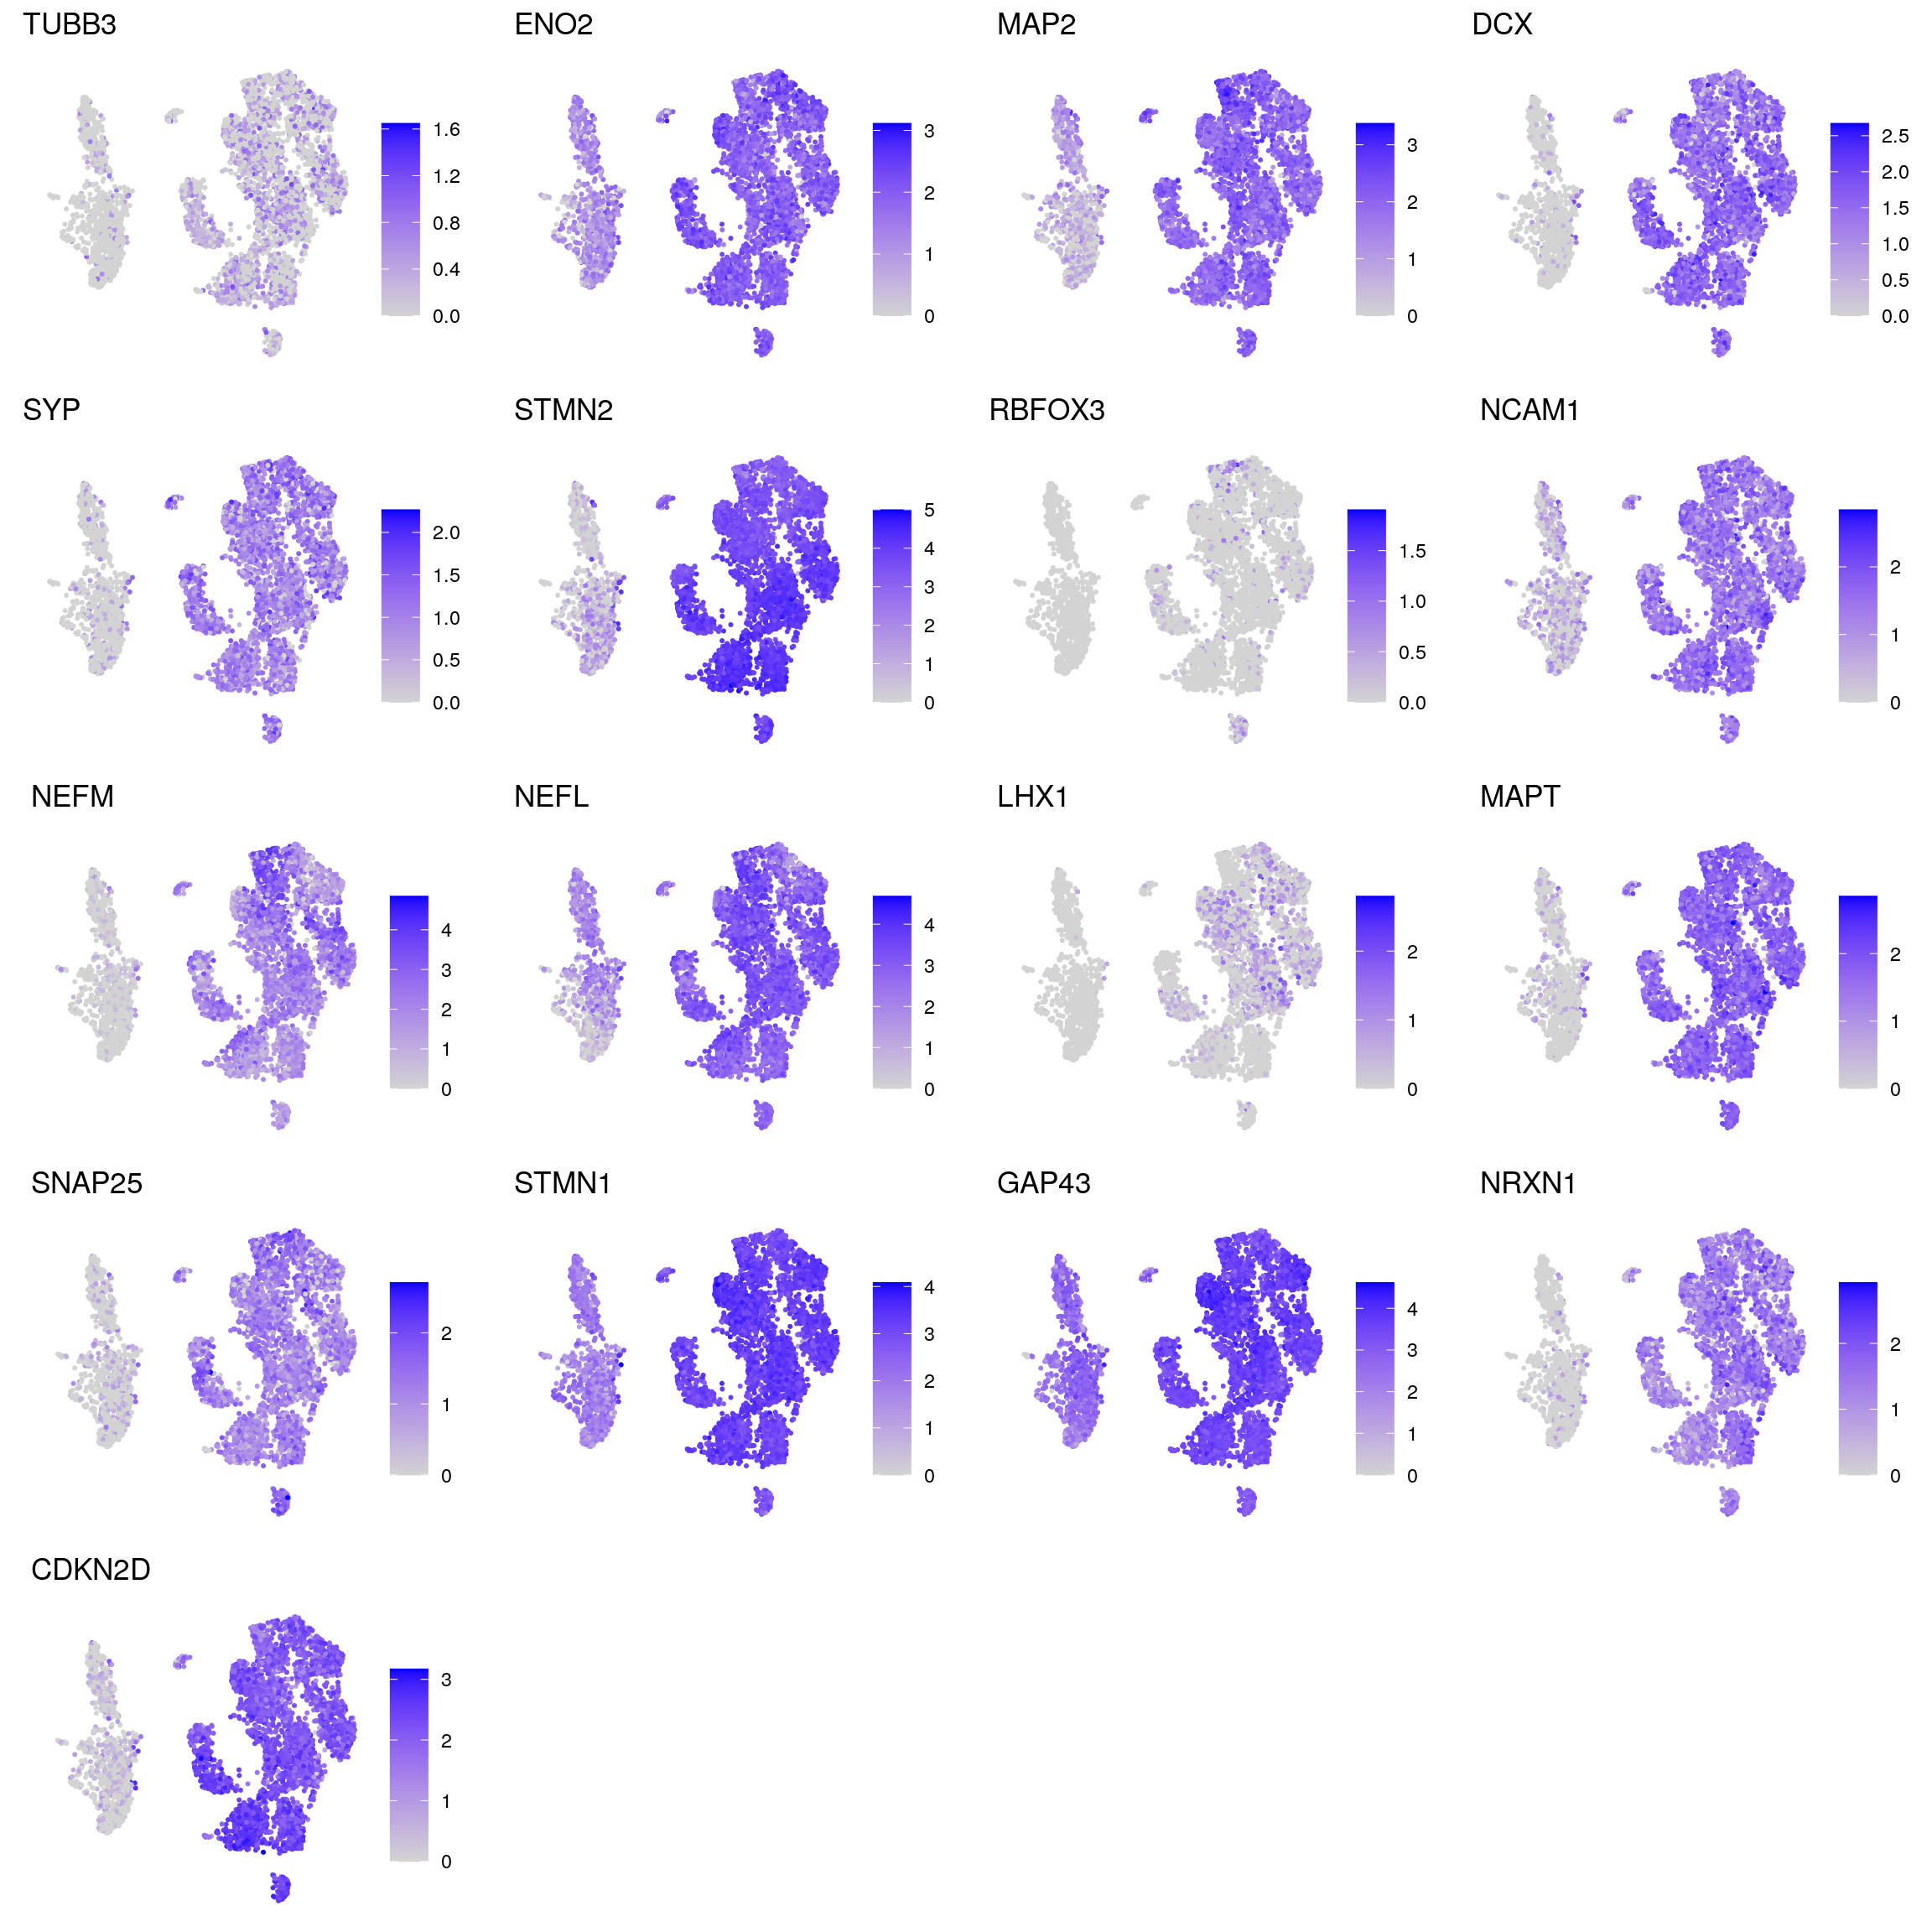
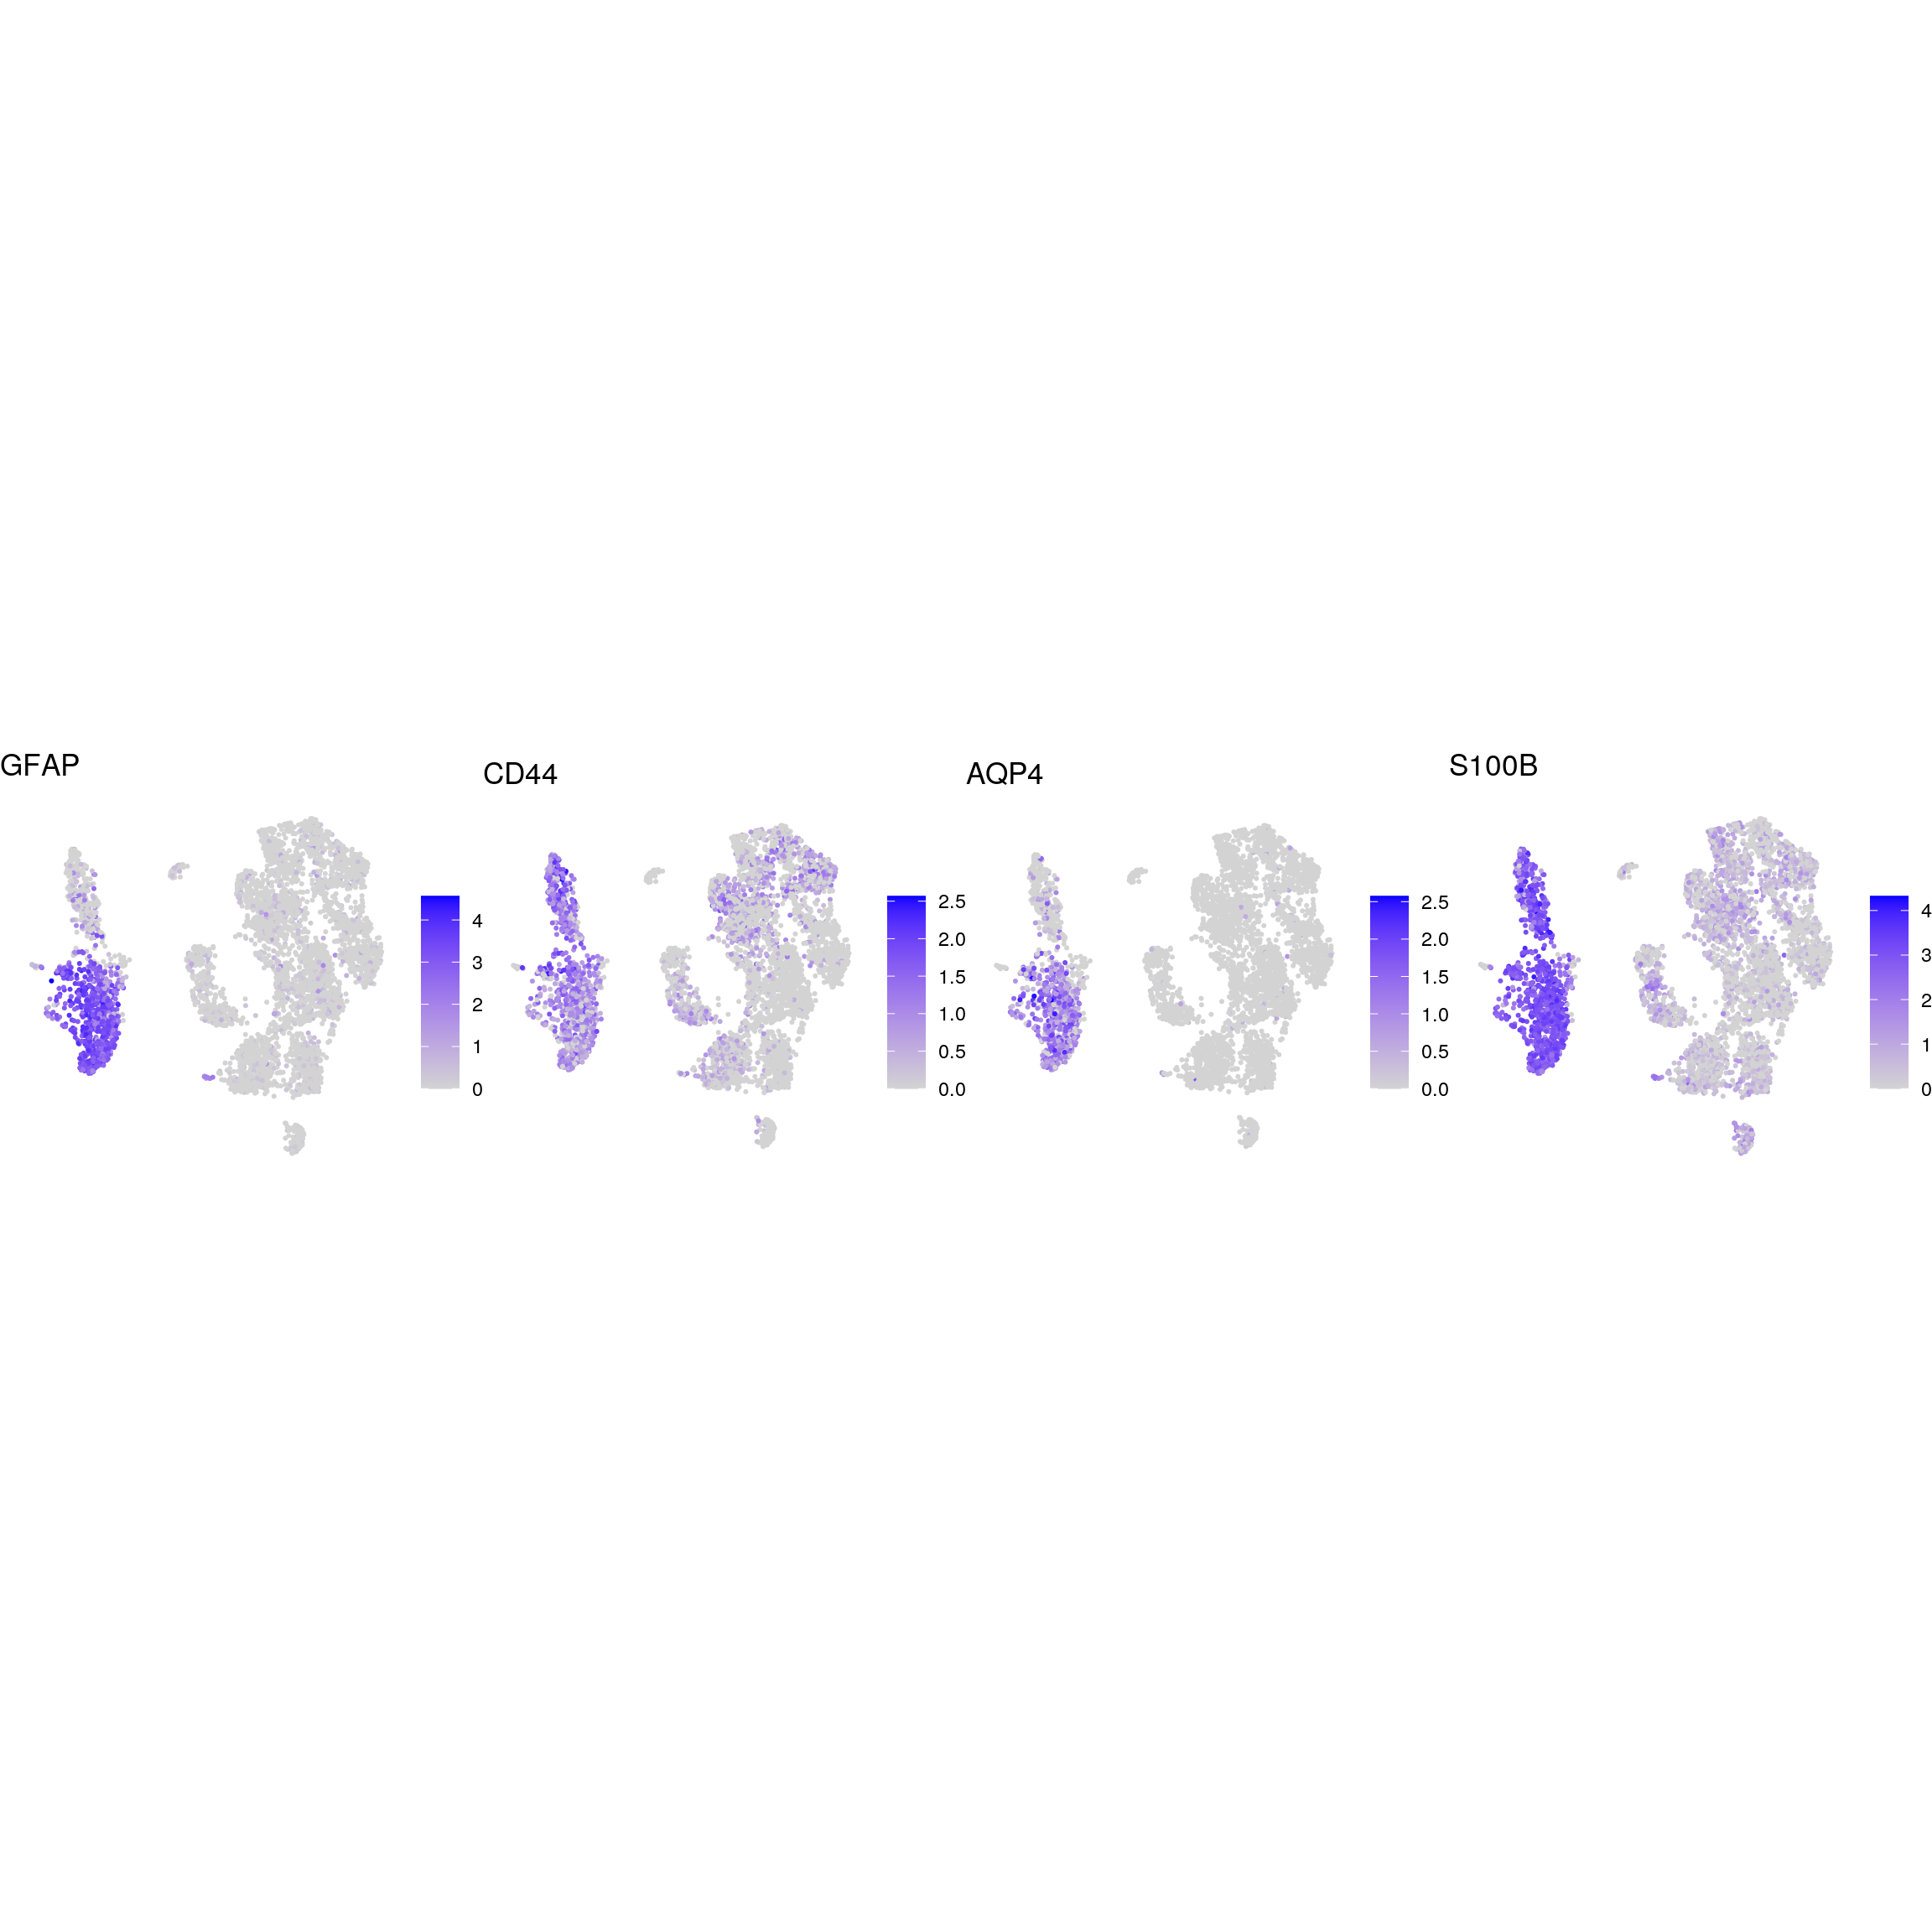
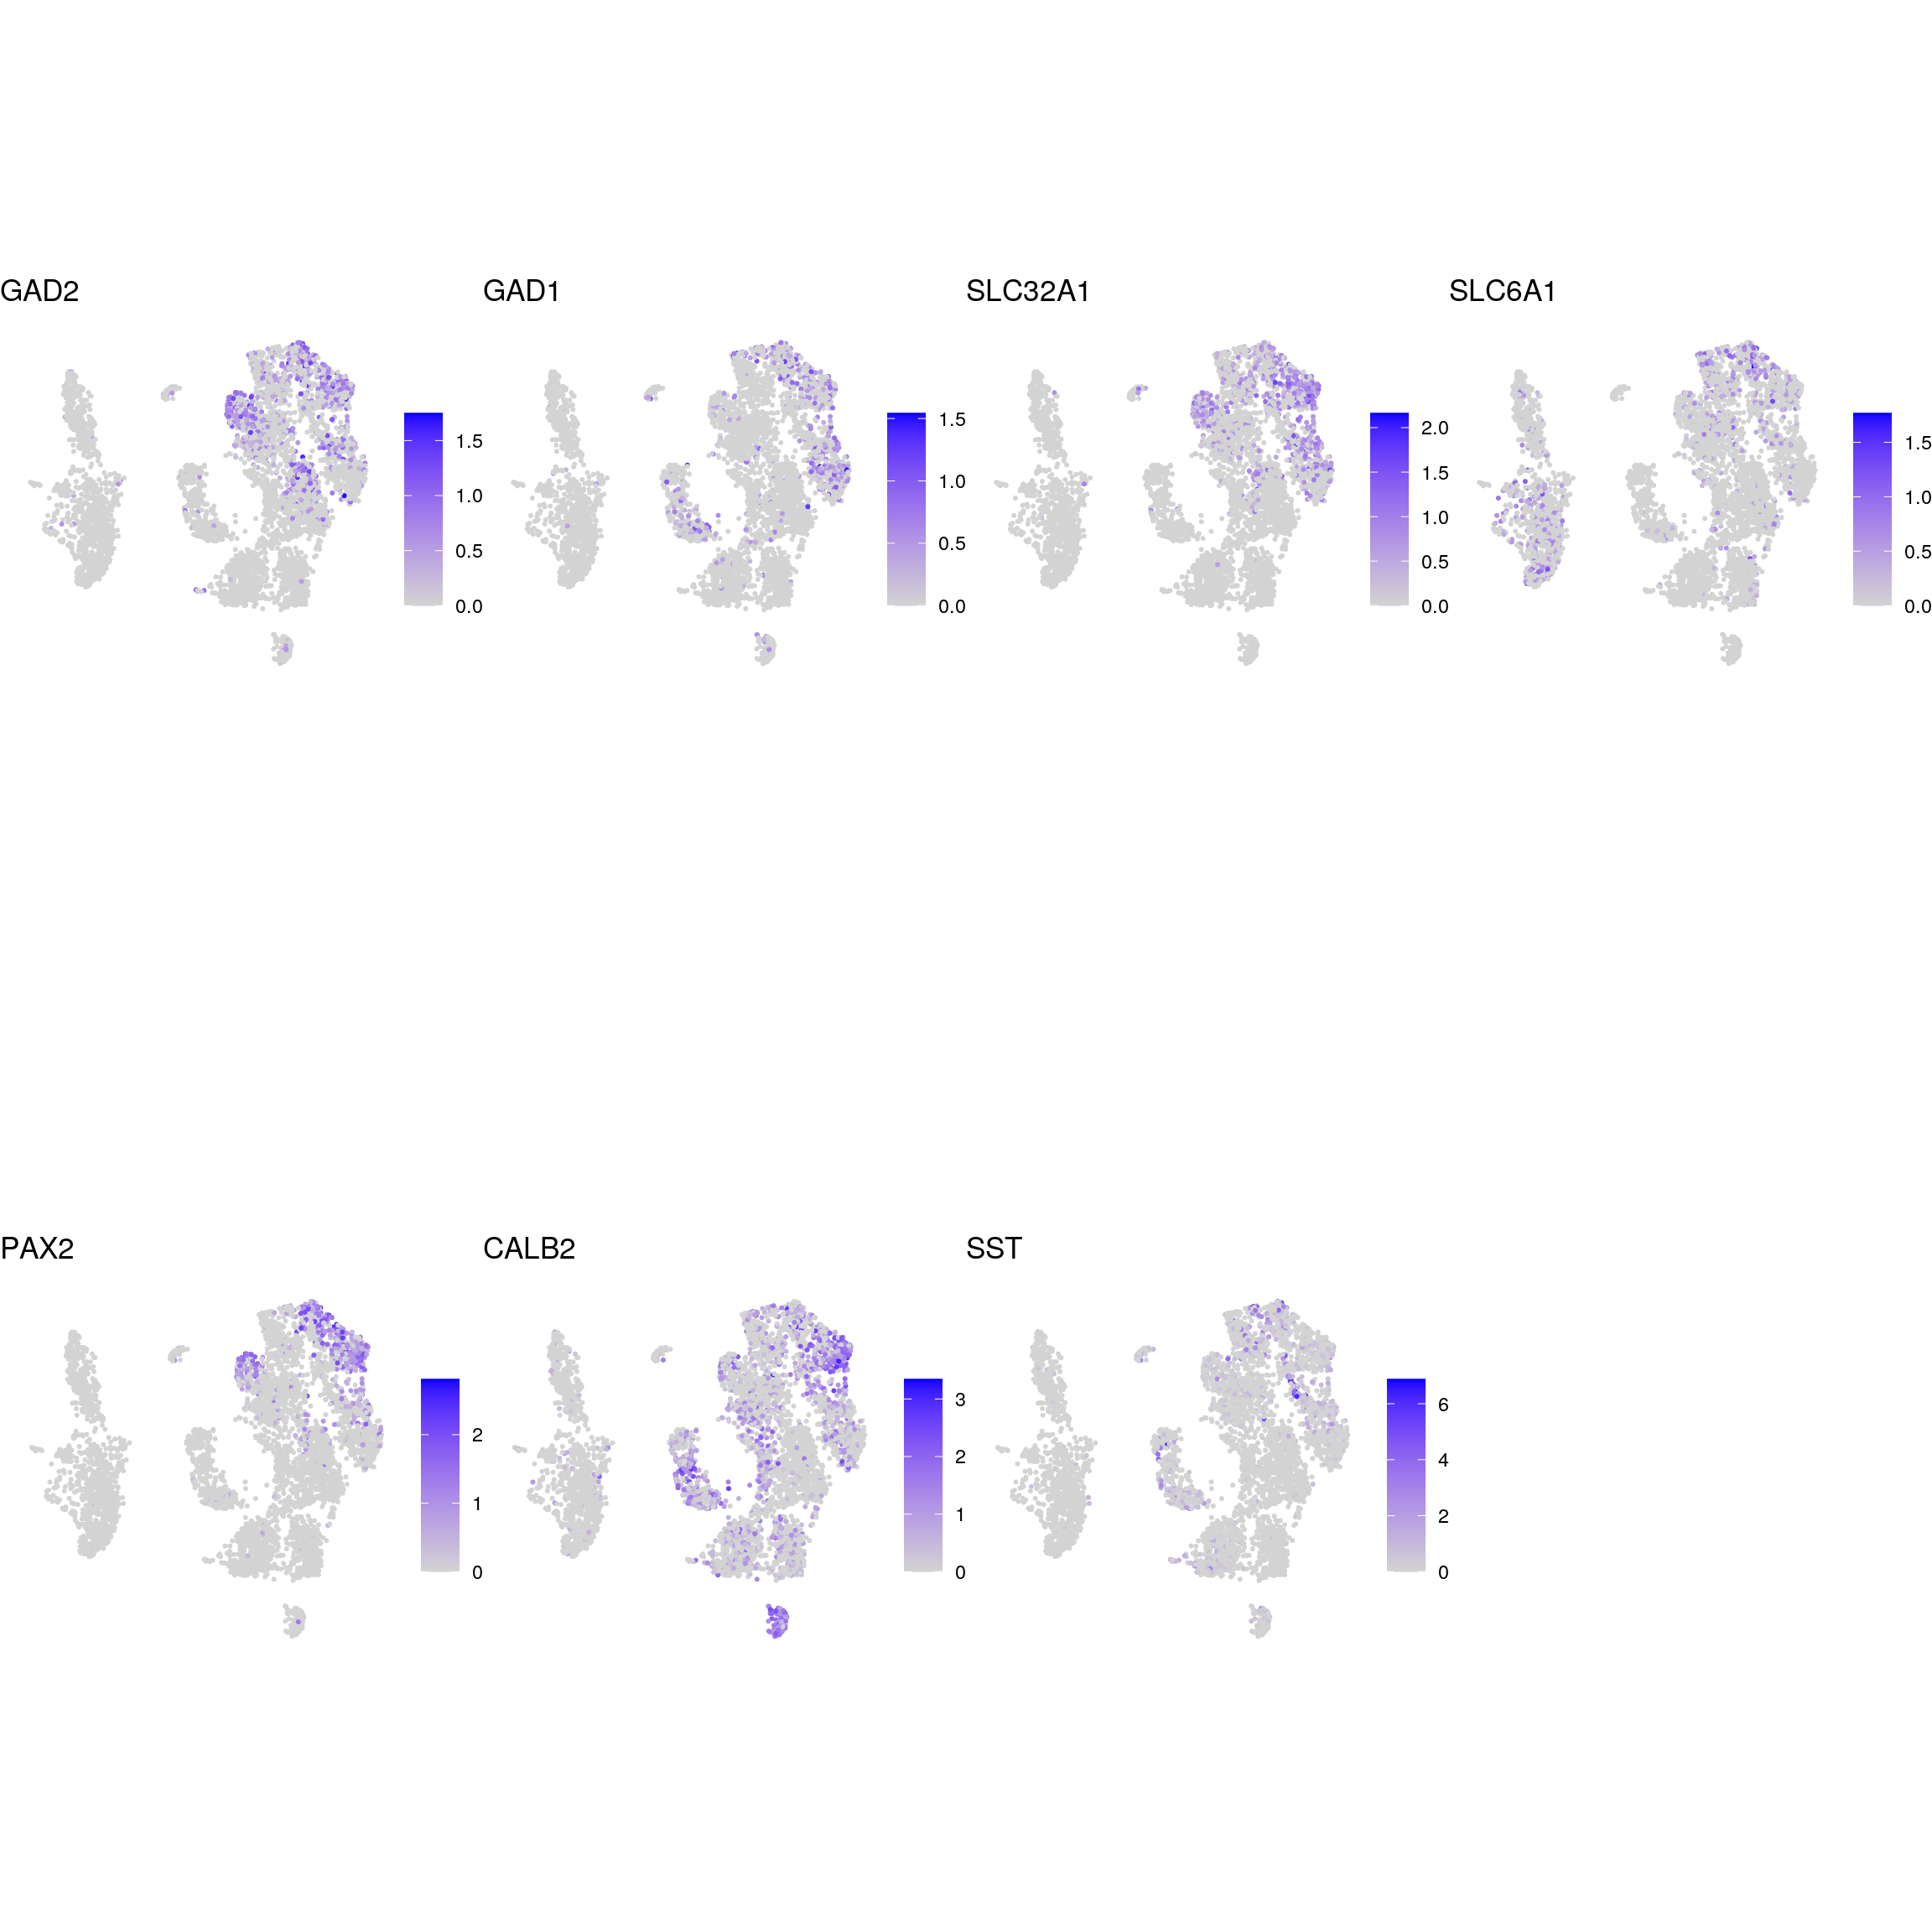
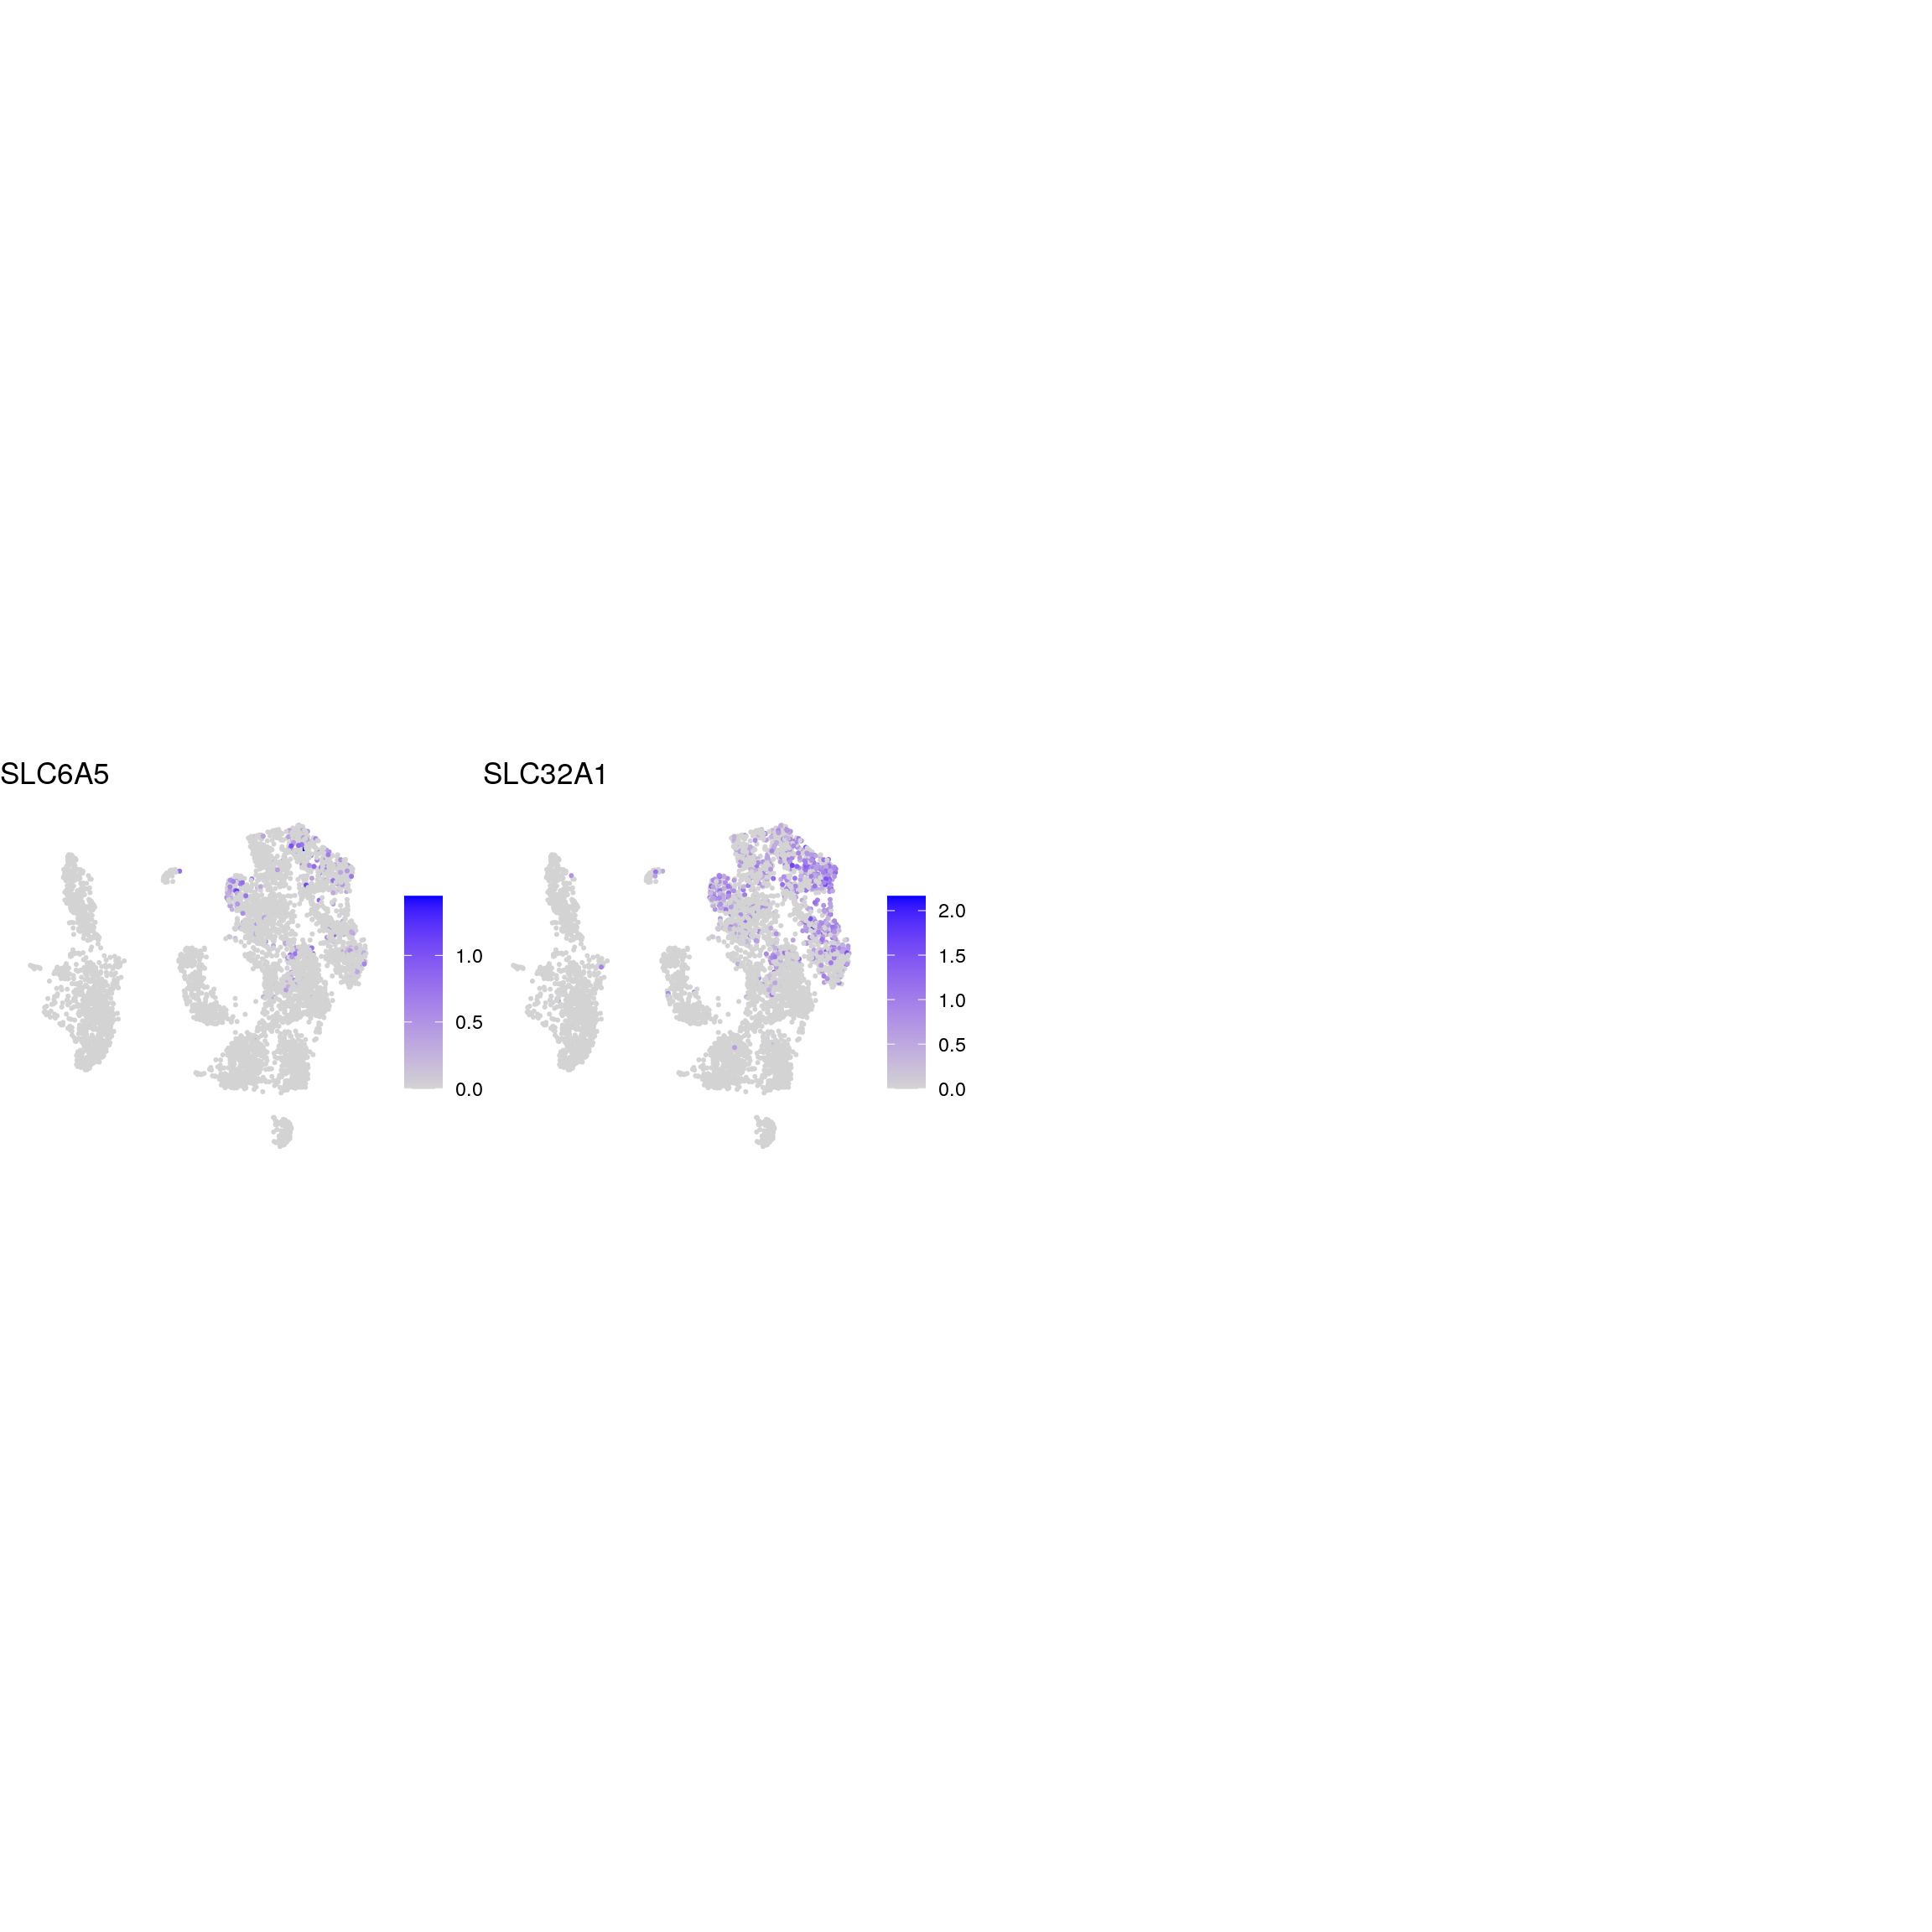
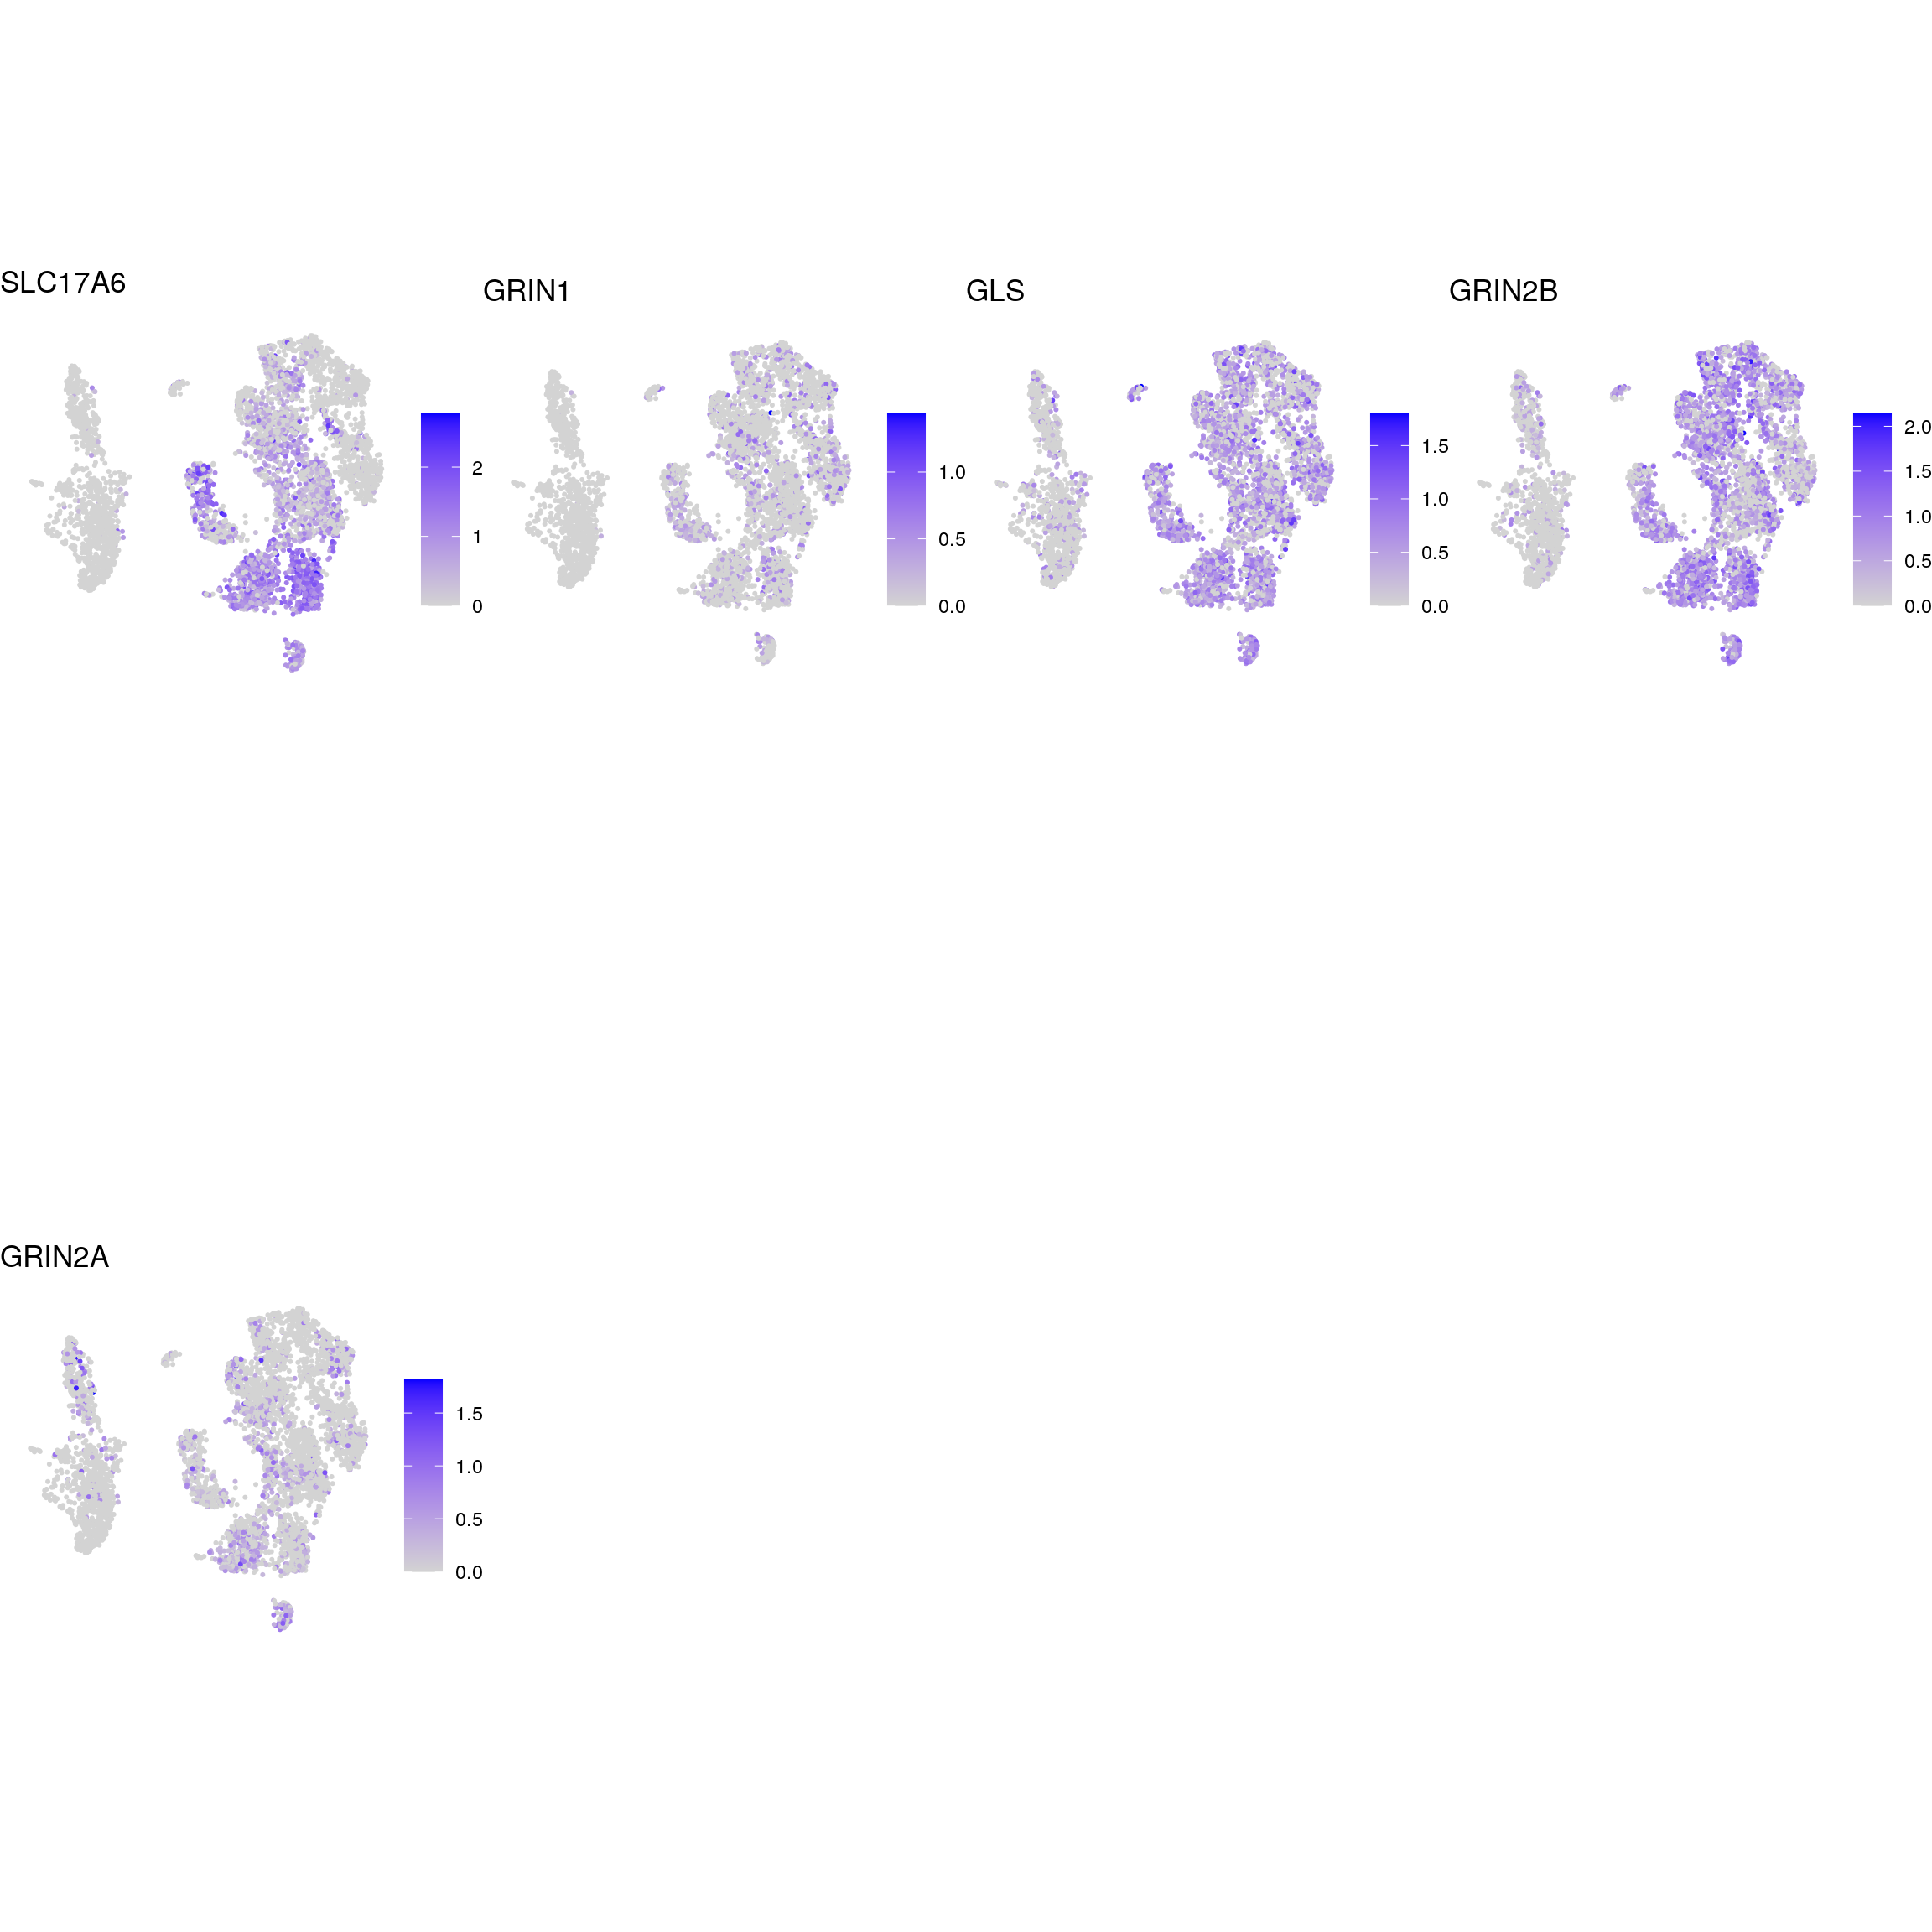
DR colored by marker expression
# downsample to 5000 cells
cs <- sample(colnames(sce), 5e3)
sub <- subset(so, cells = cs)
# UMAPs colored by marker-expression
for (m in seq_along(fs)) {
    cat("## ", names(fs)[m], "\n")
    ps <- lapply(seq_along(fs[[m]]), function(i) {
        if (!fs[[m]][i] %in% rownames(so)) return(NULL)
        FeaturePlot(sub, features = fs[[m]][i], reduction = "umap",
                    pt.size = 0.4) +
            theme(aspect.ratio = 1, legend.position = "none") +
            ggtitle(labs[[m]][i]) + theme_void() + theme(aspect.ratio = 1)
    })
    # arrange plots in grid
    ps <- ps[!vapply(ps, is.null, logical(1))]
    p <- plot_grid(plotlist = ps, ncol = 4, label_size = 10)
    print(p)
    cat("\n\n")
}
NSC
proliferating
neuronal
mature_astrocytes
glial_astrocytic
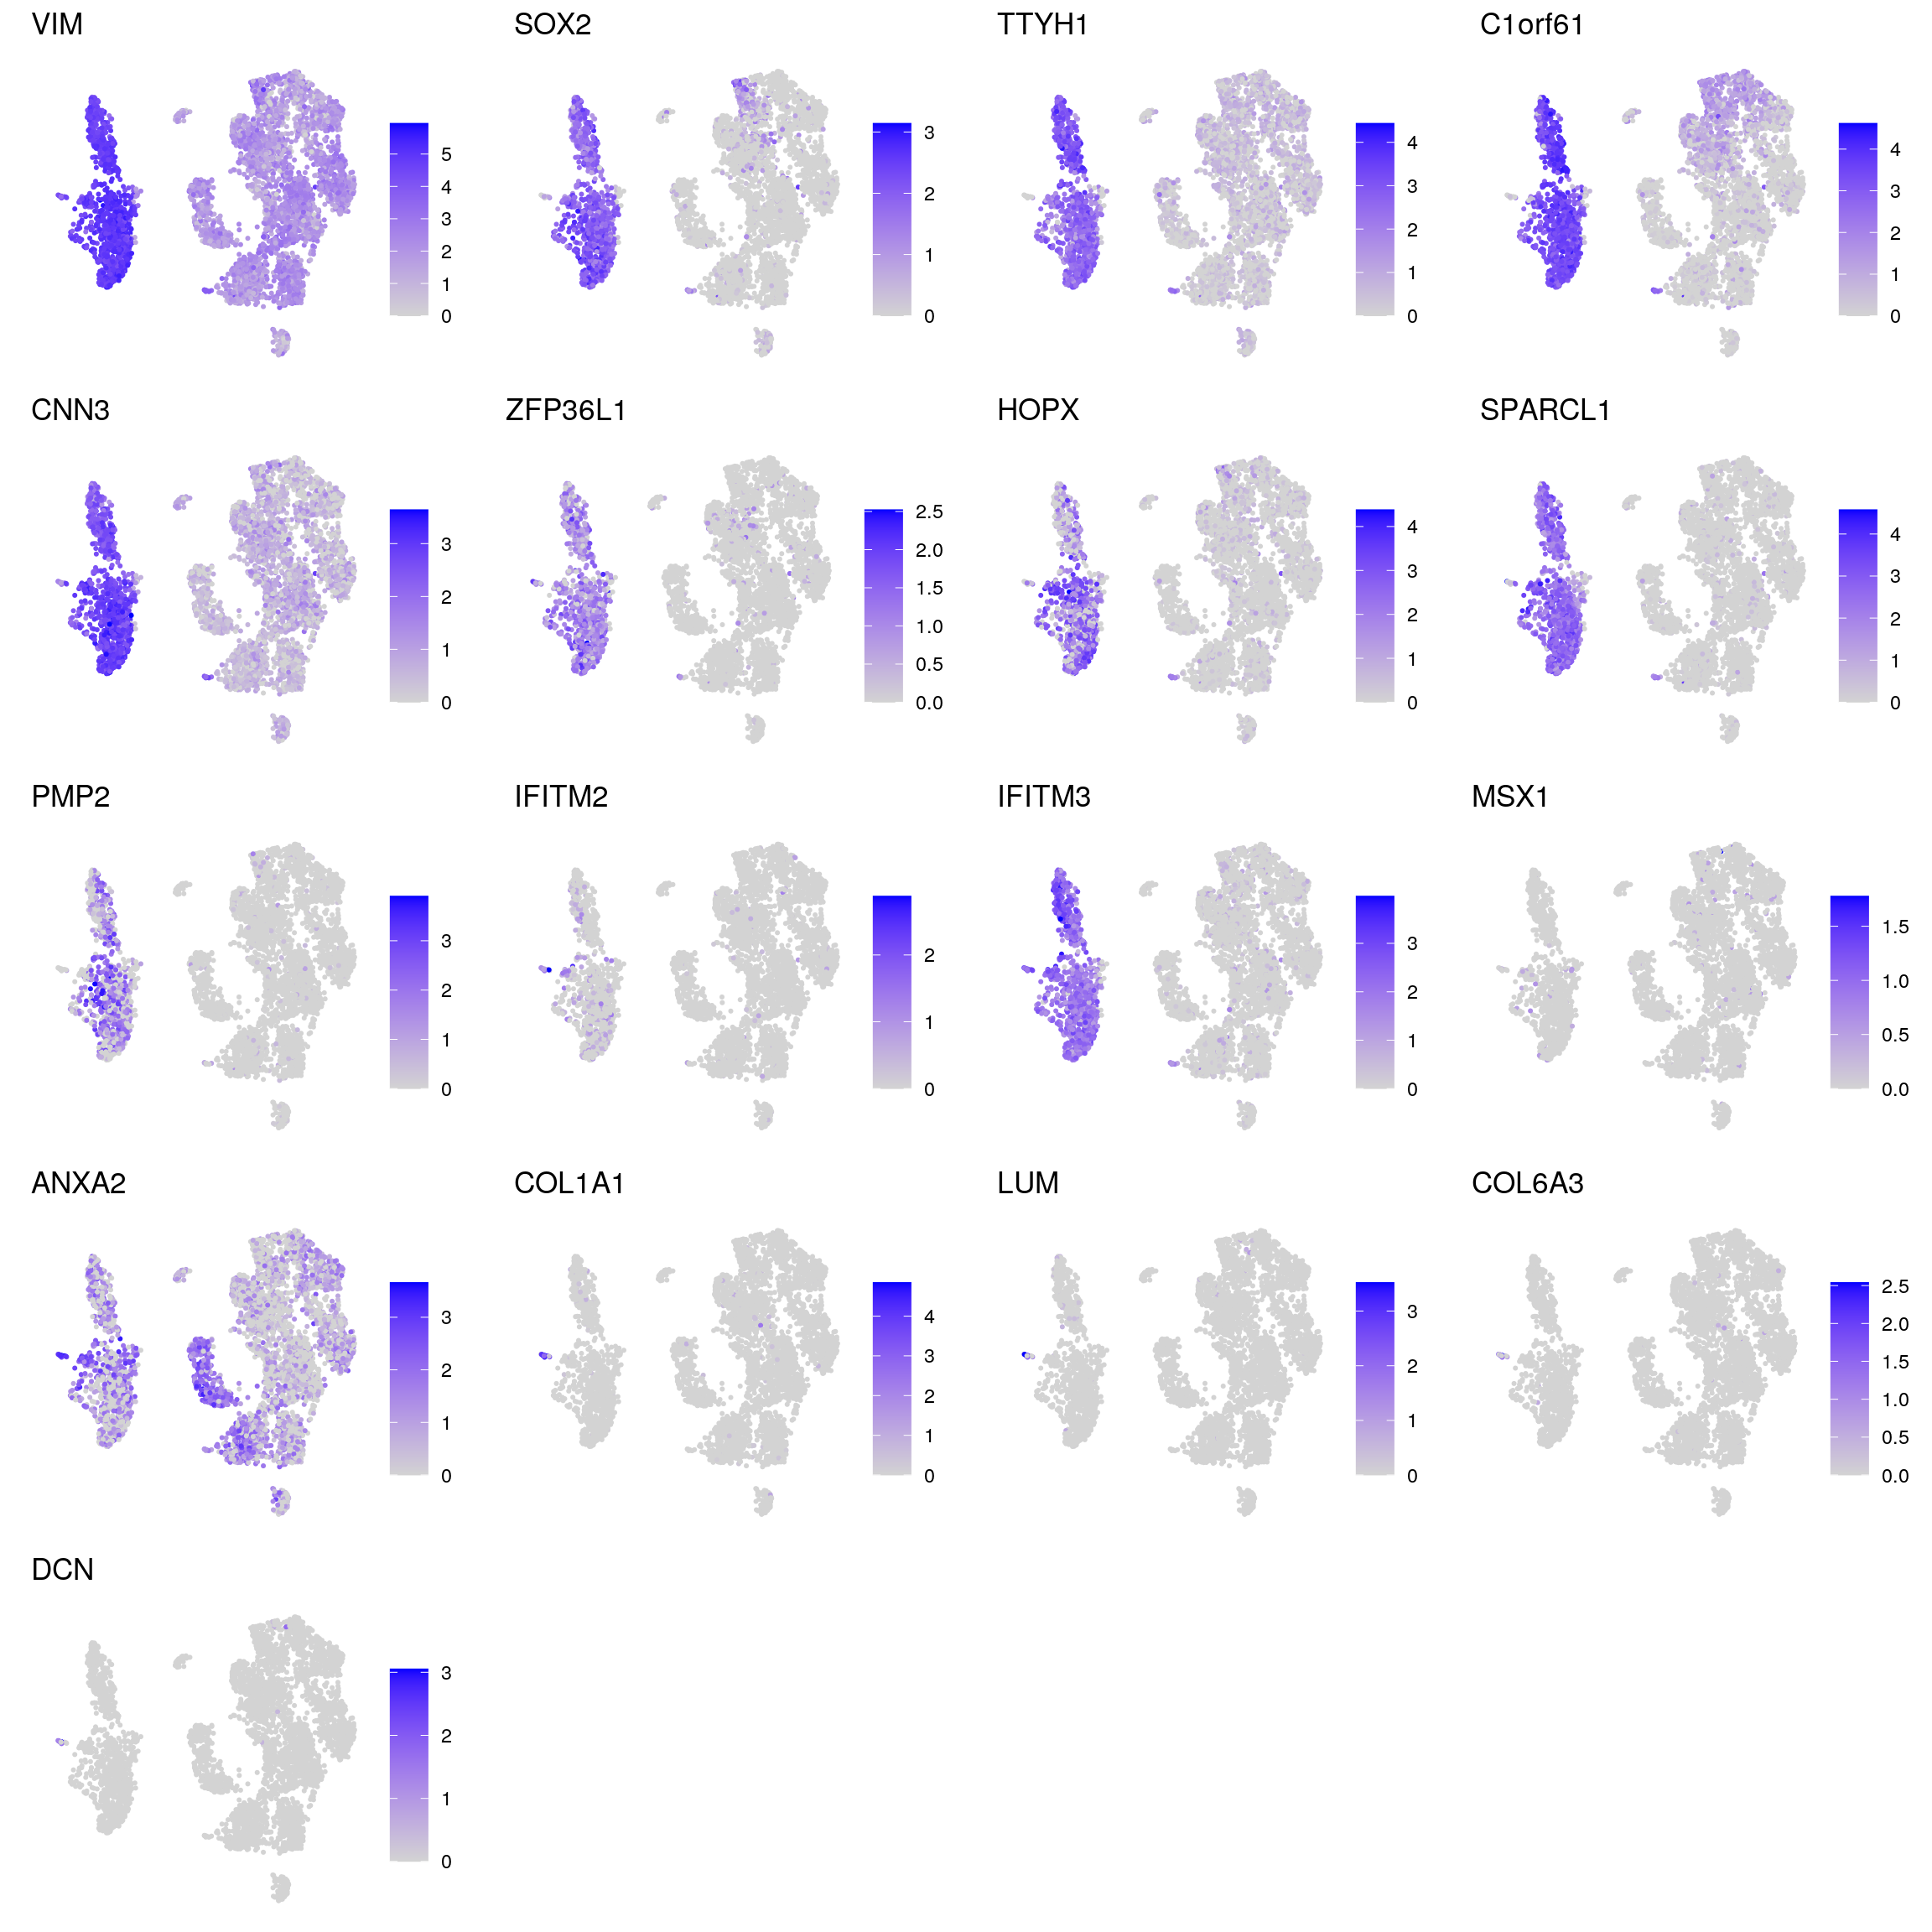
radial_glia
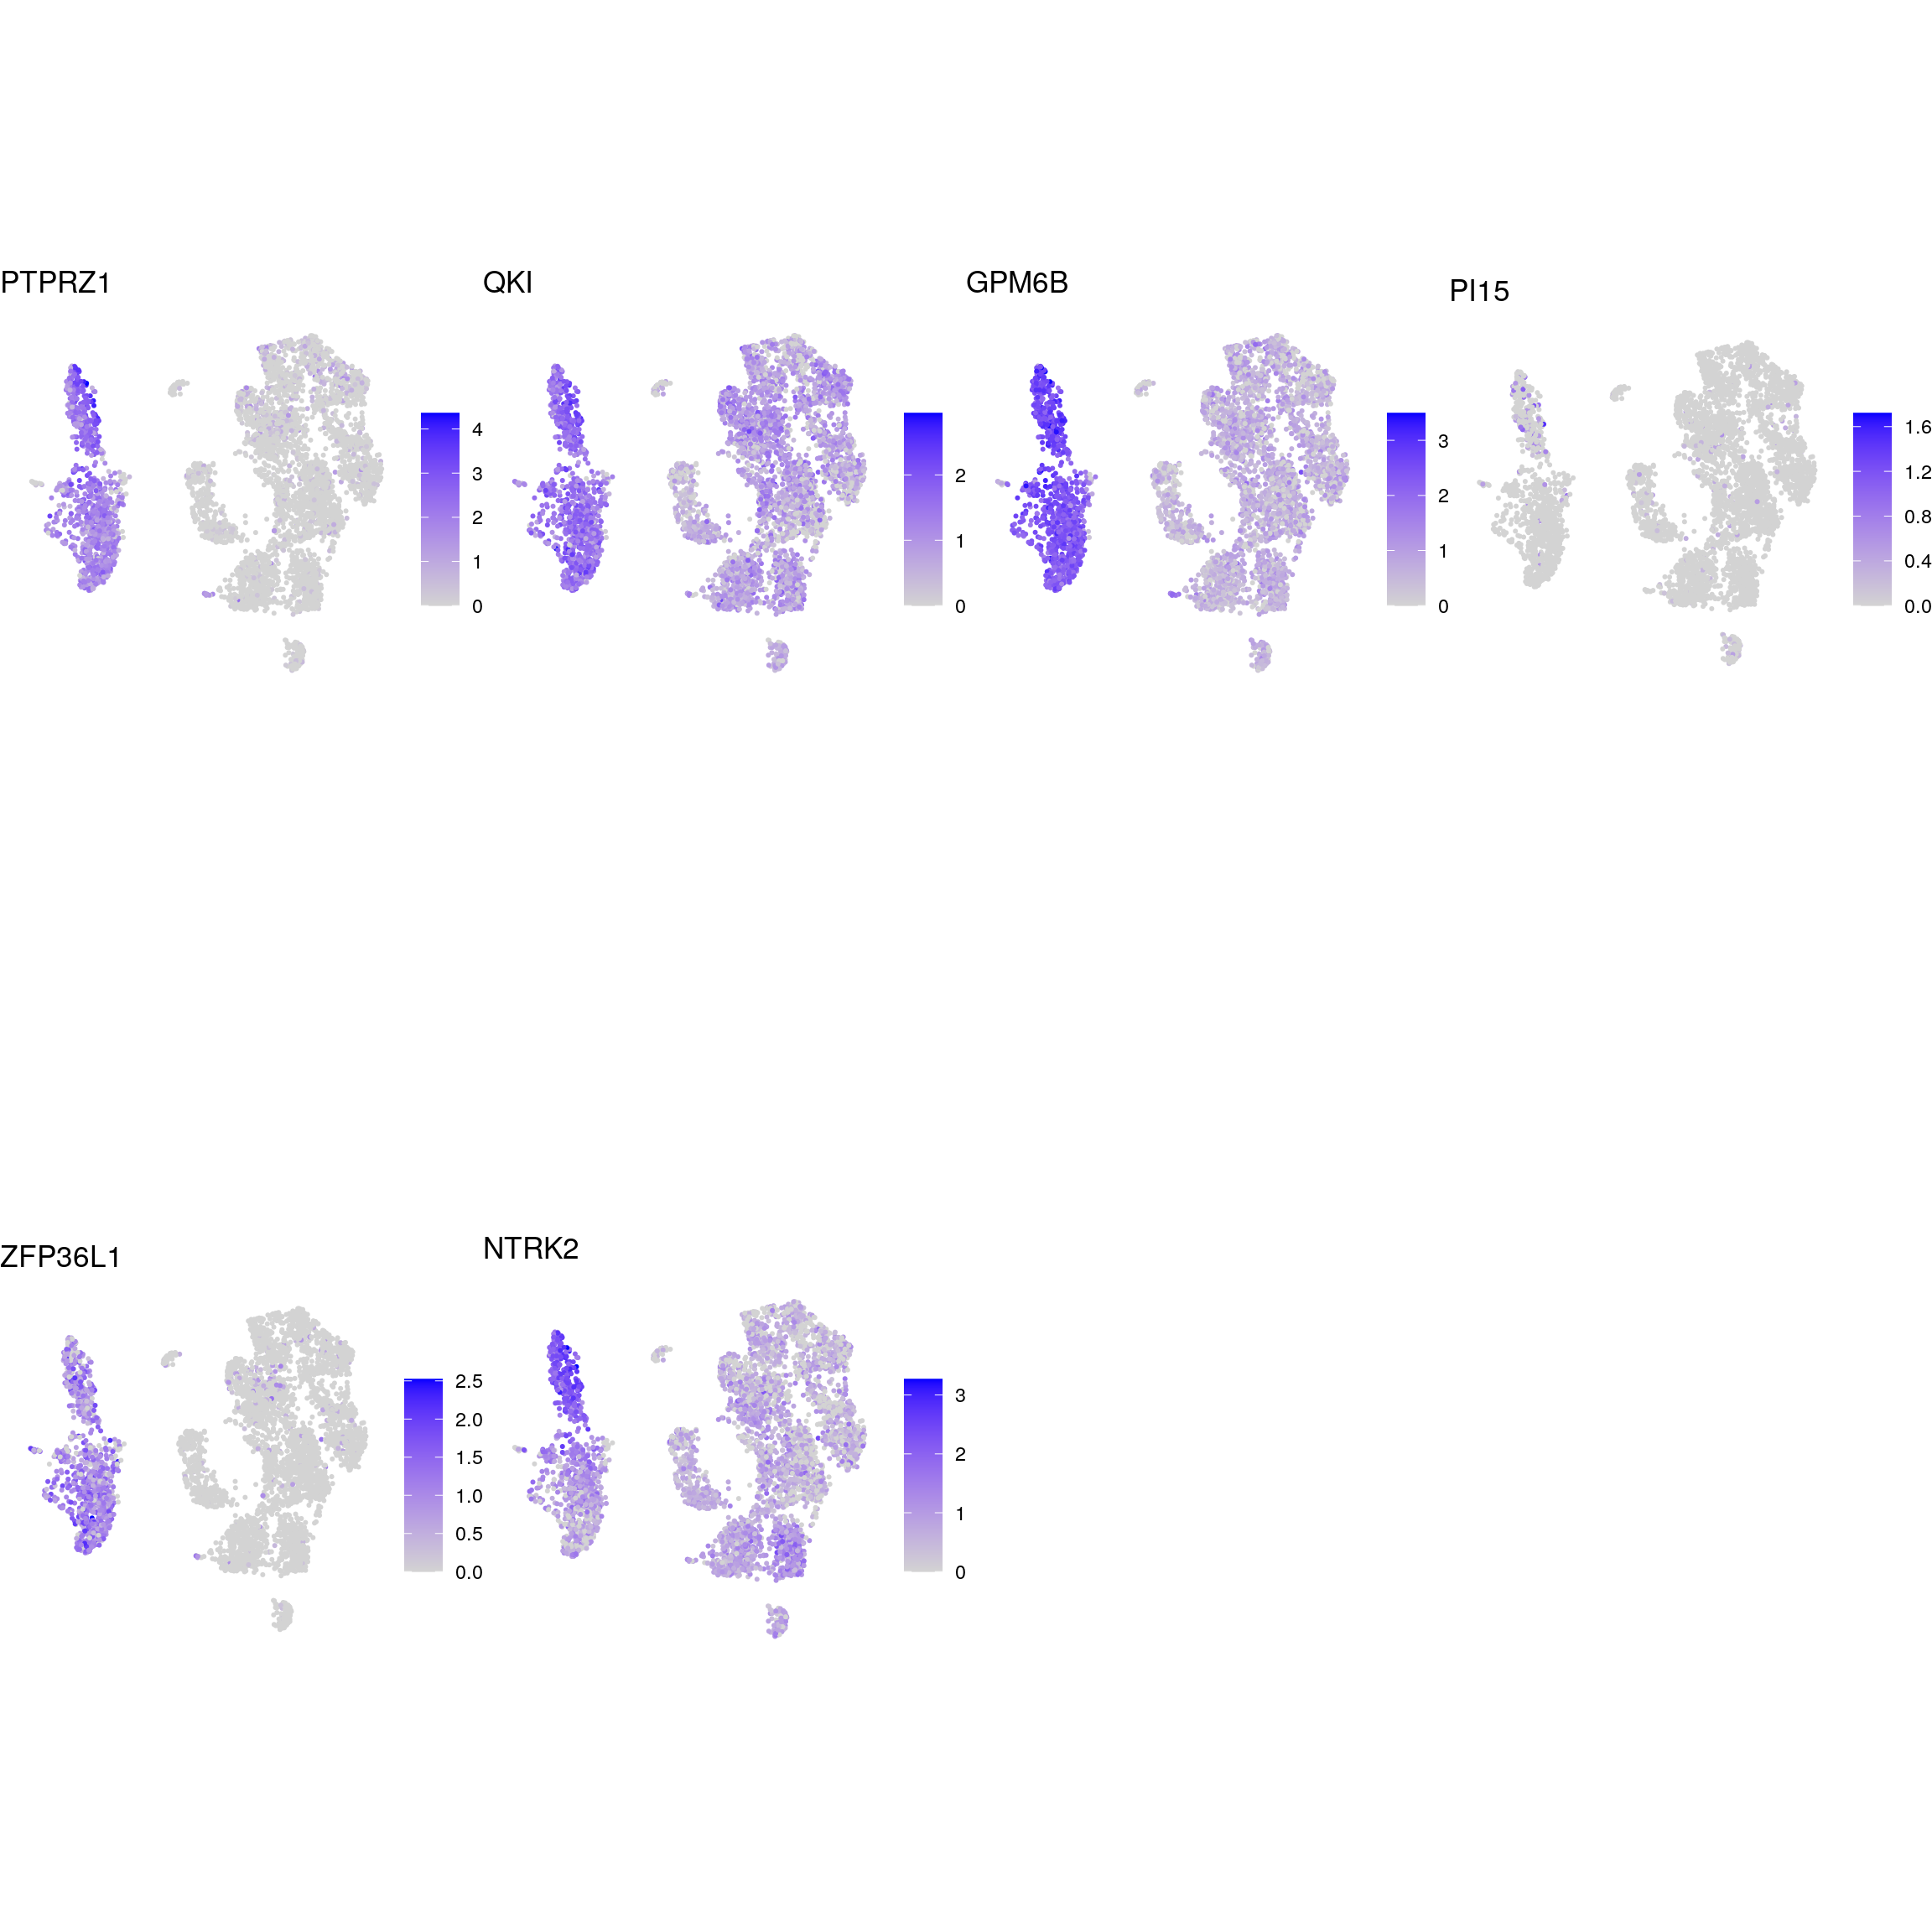
oligodendrocyte
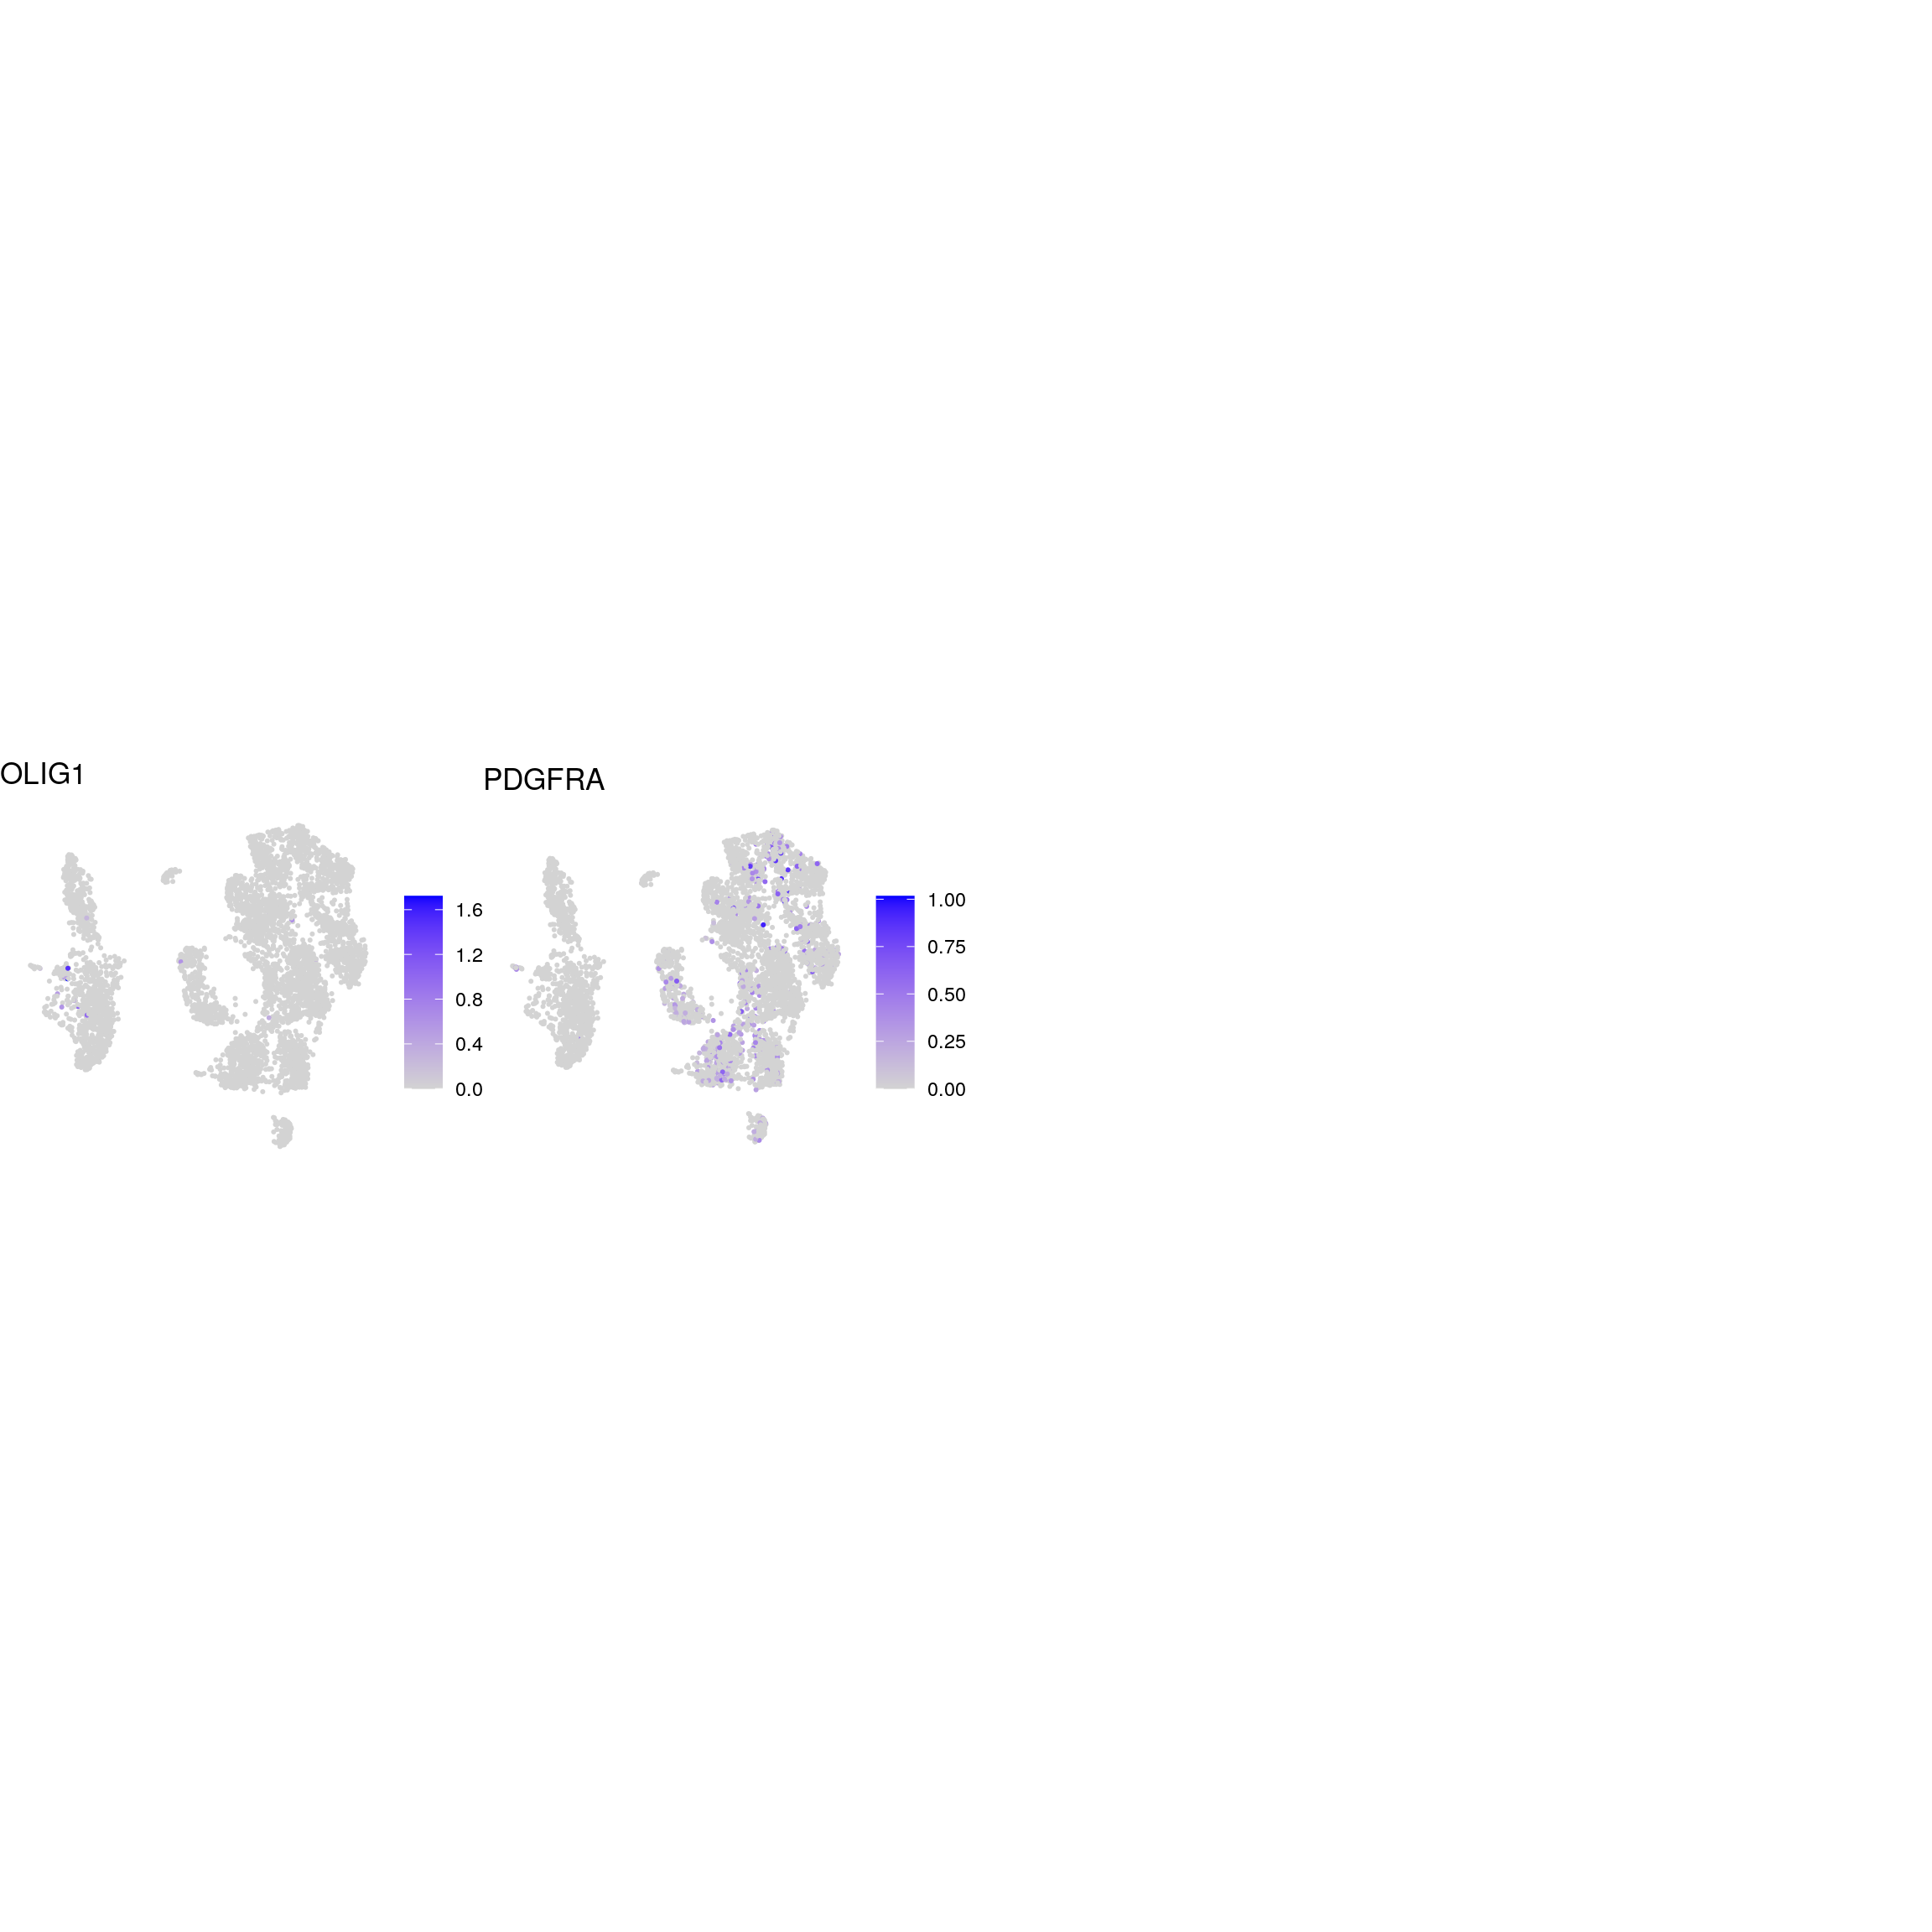
GABAergic_neurons
glycinergic_neurons
glutaminergic_neurons
dopaminergic_neurons
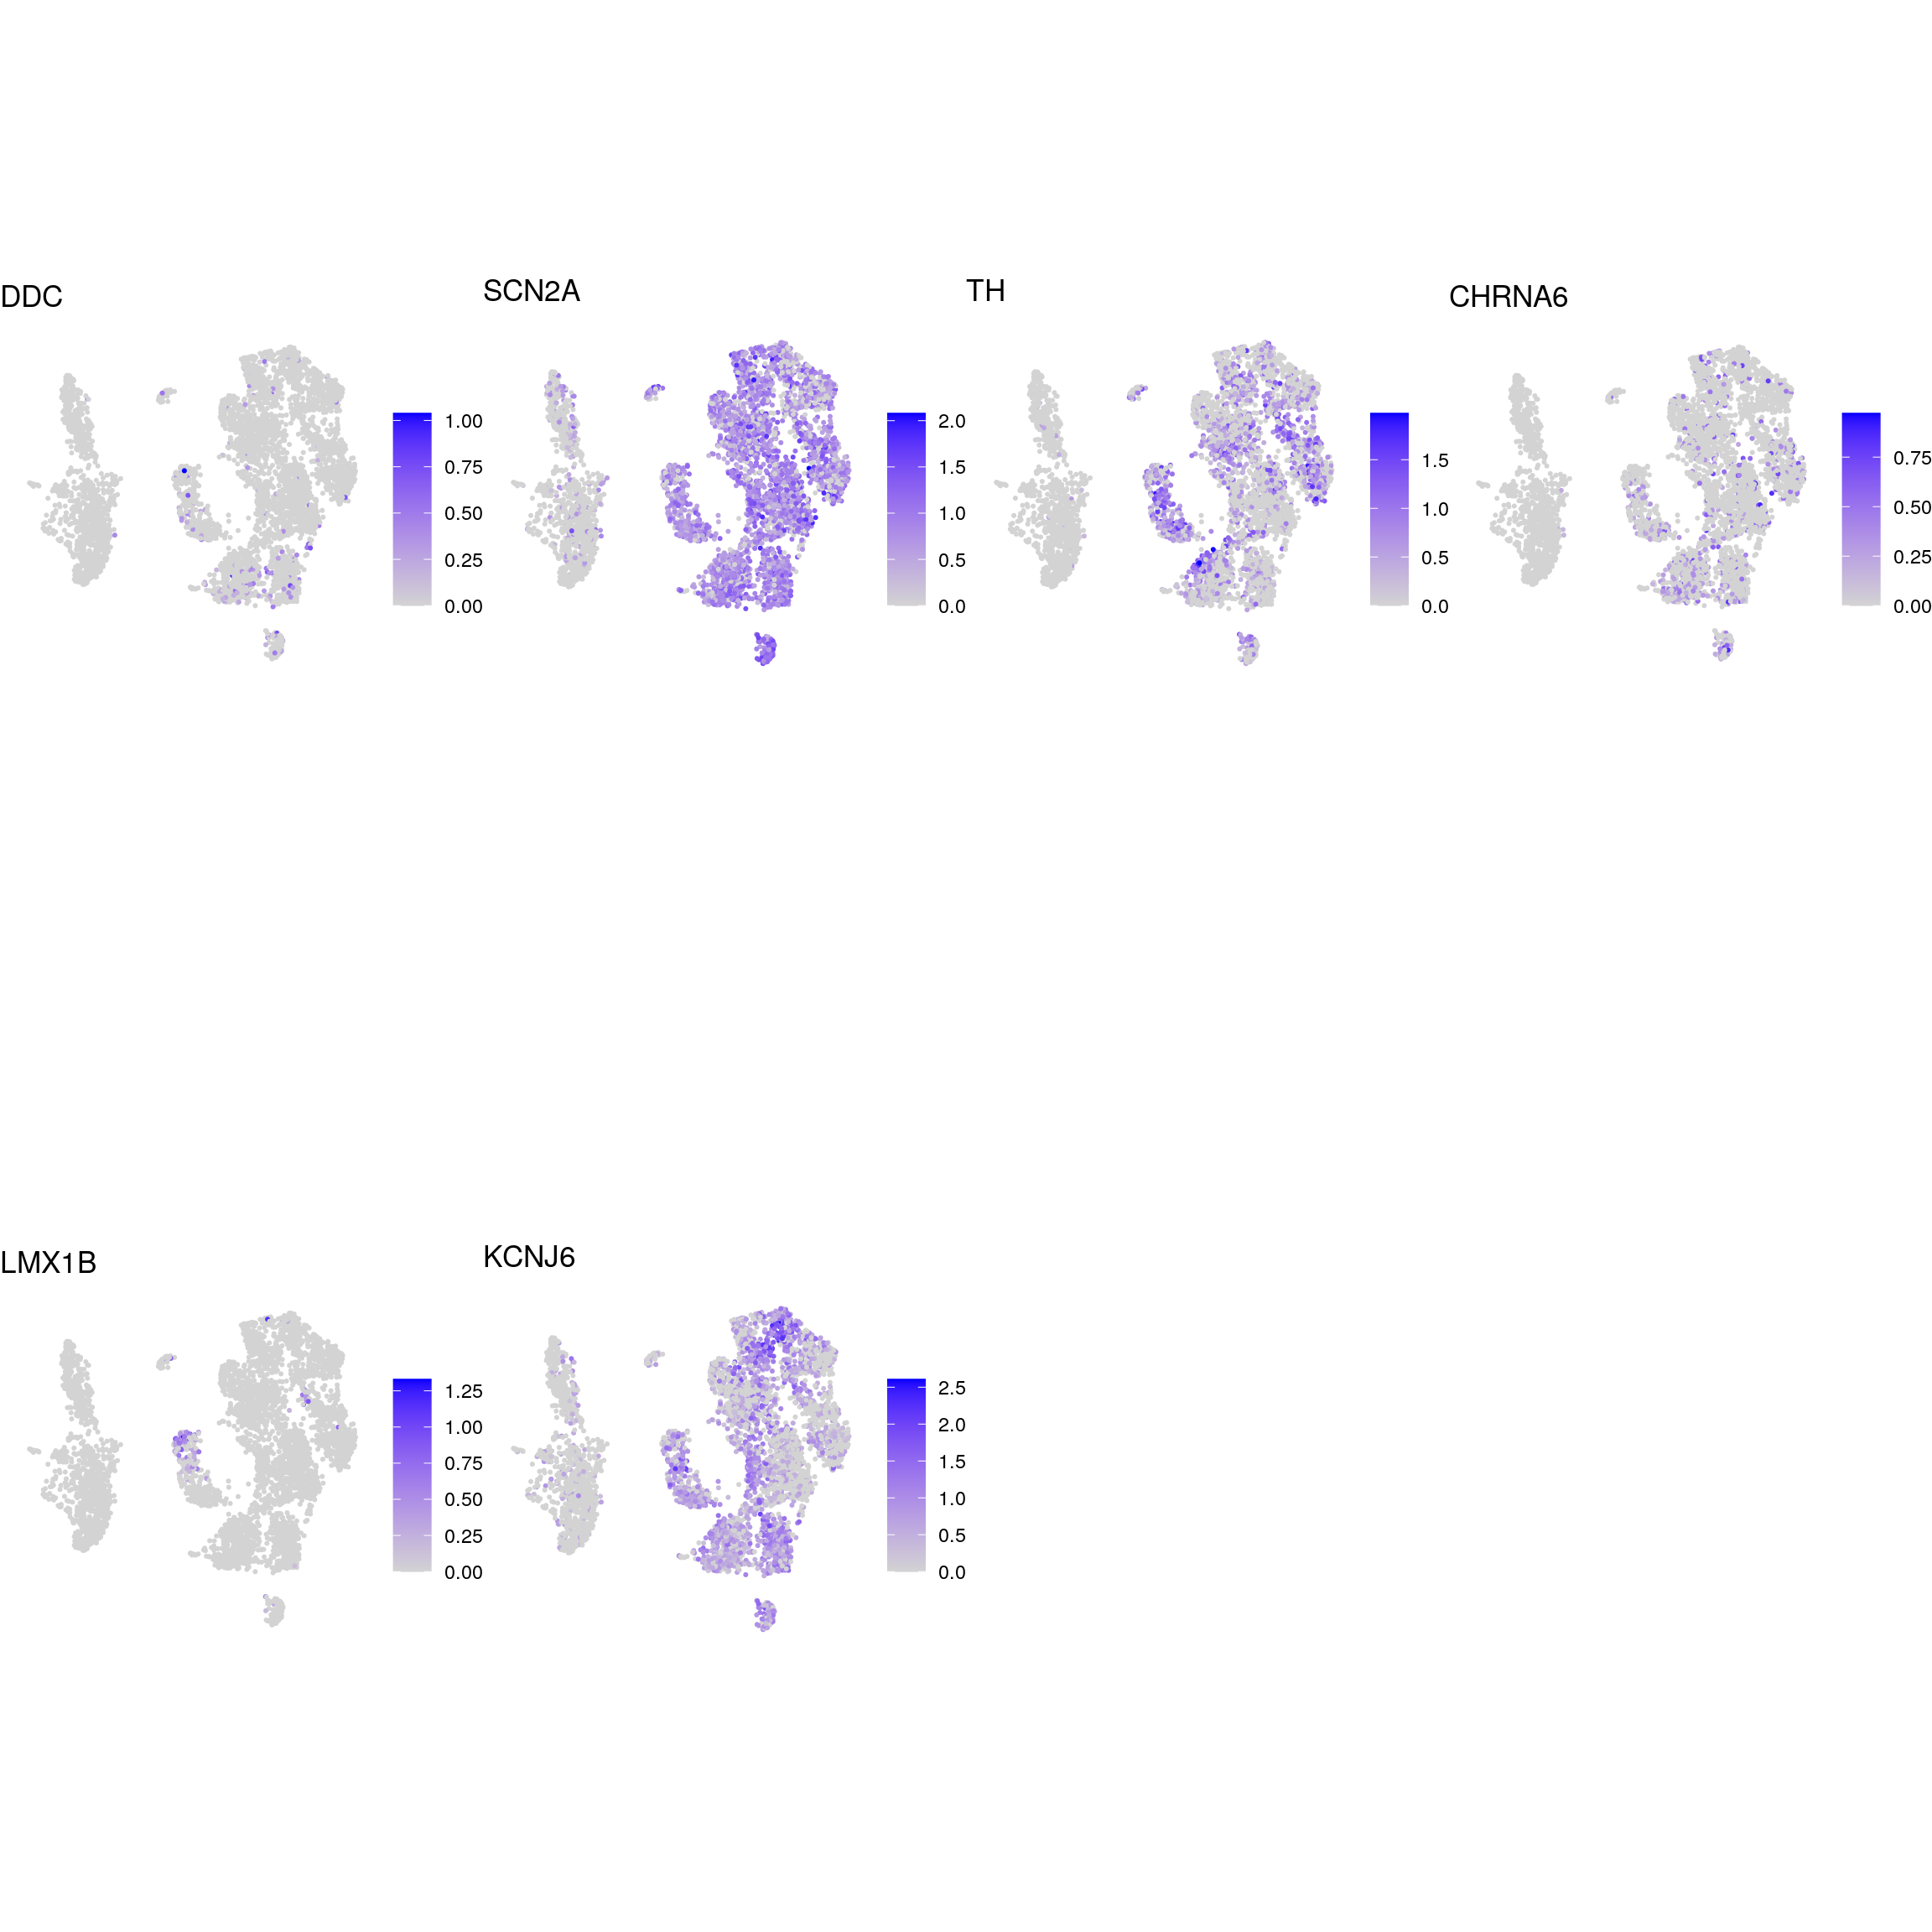
apoptotic
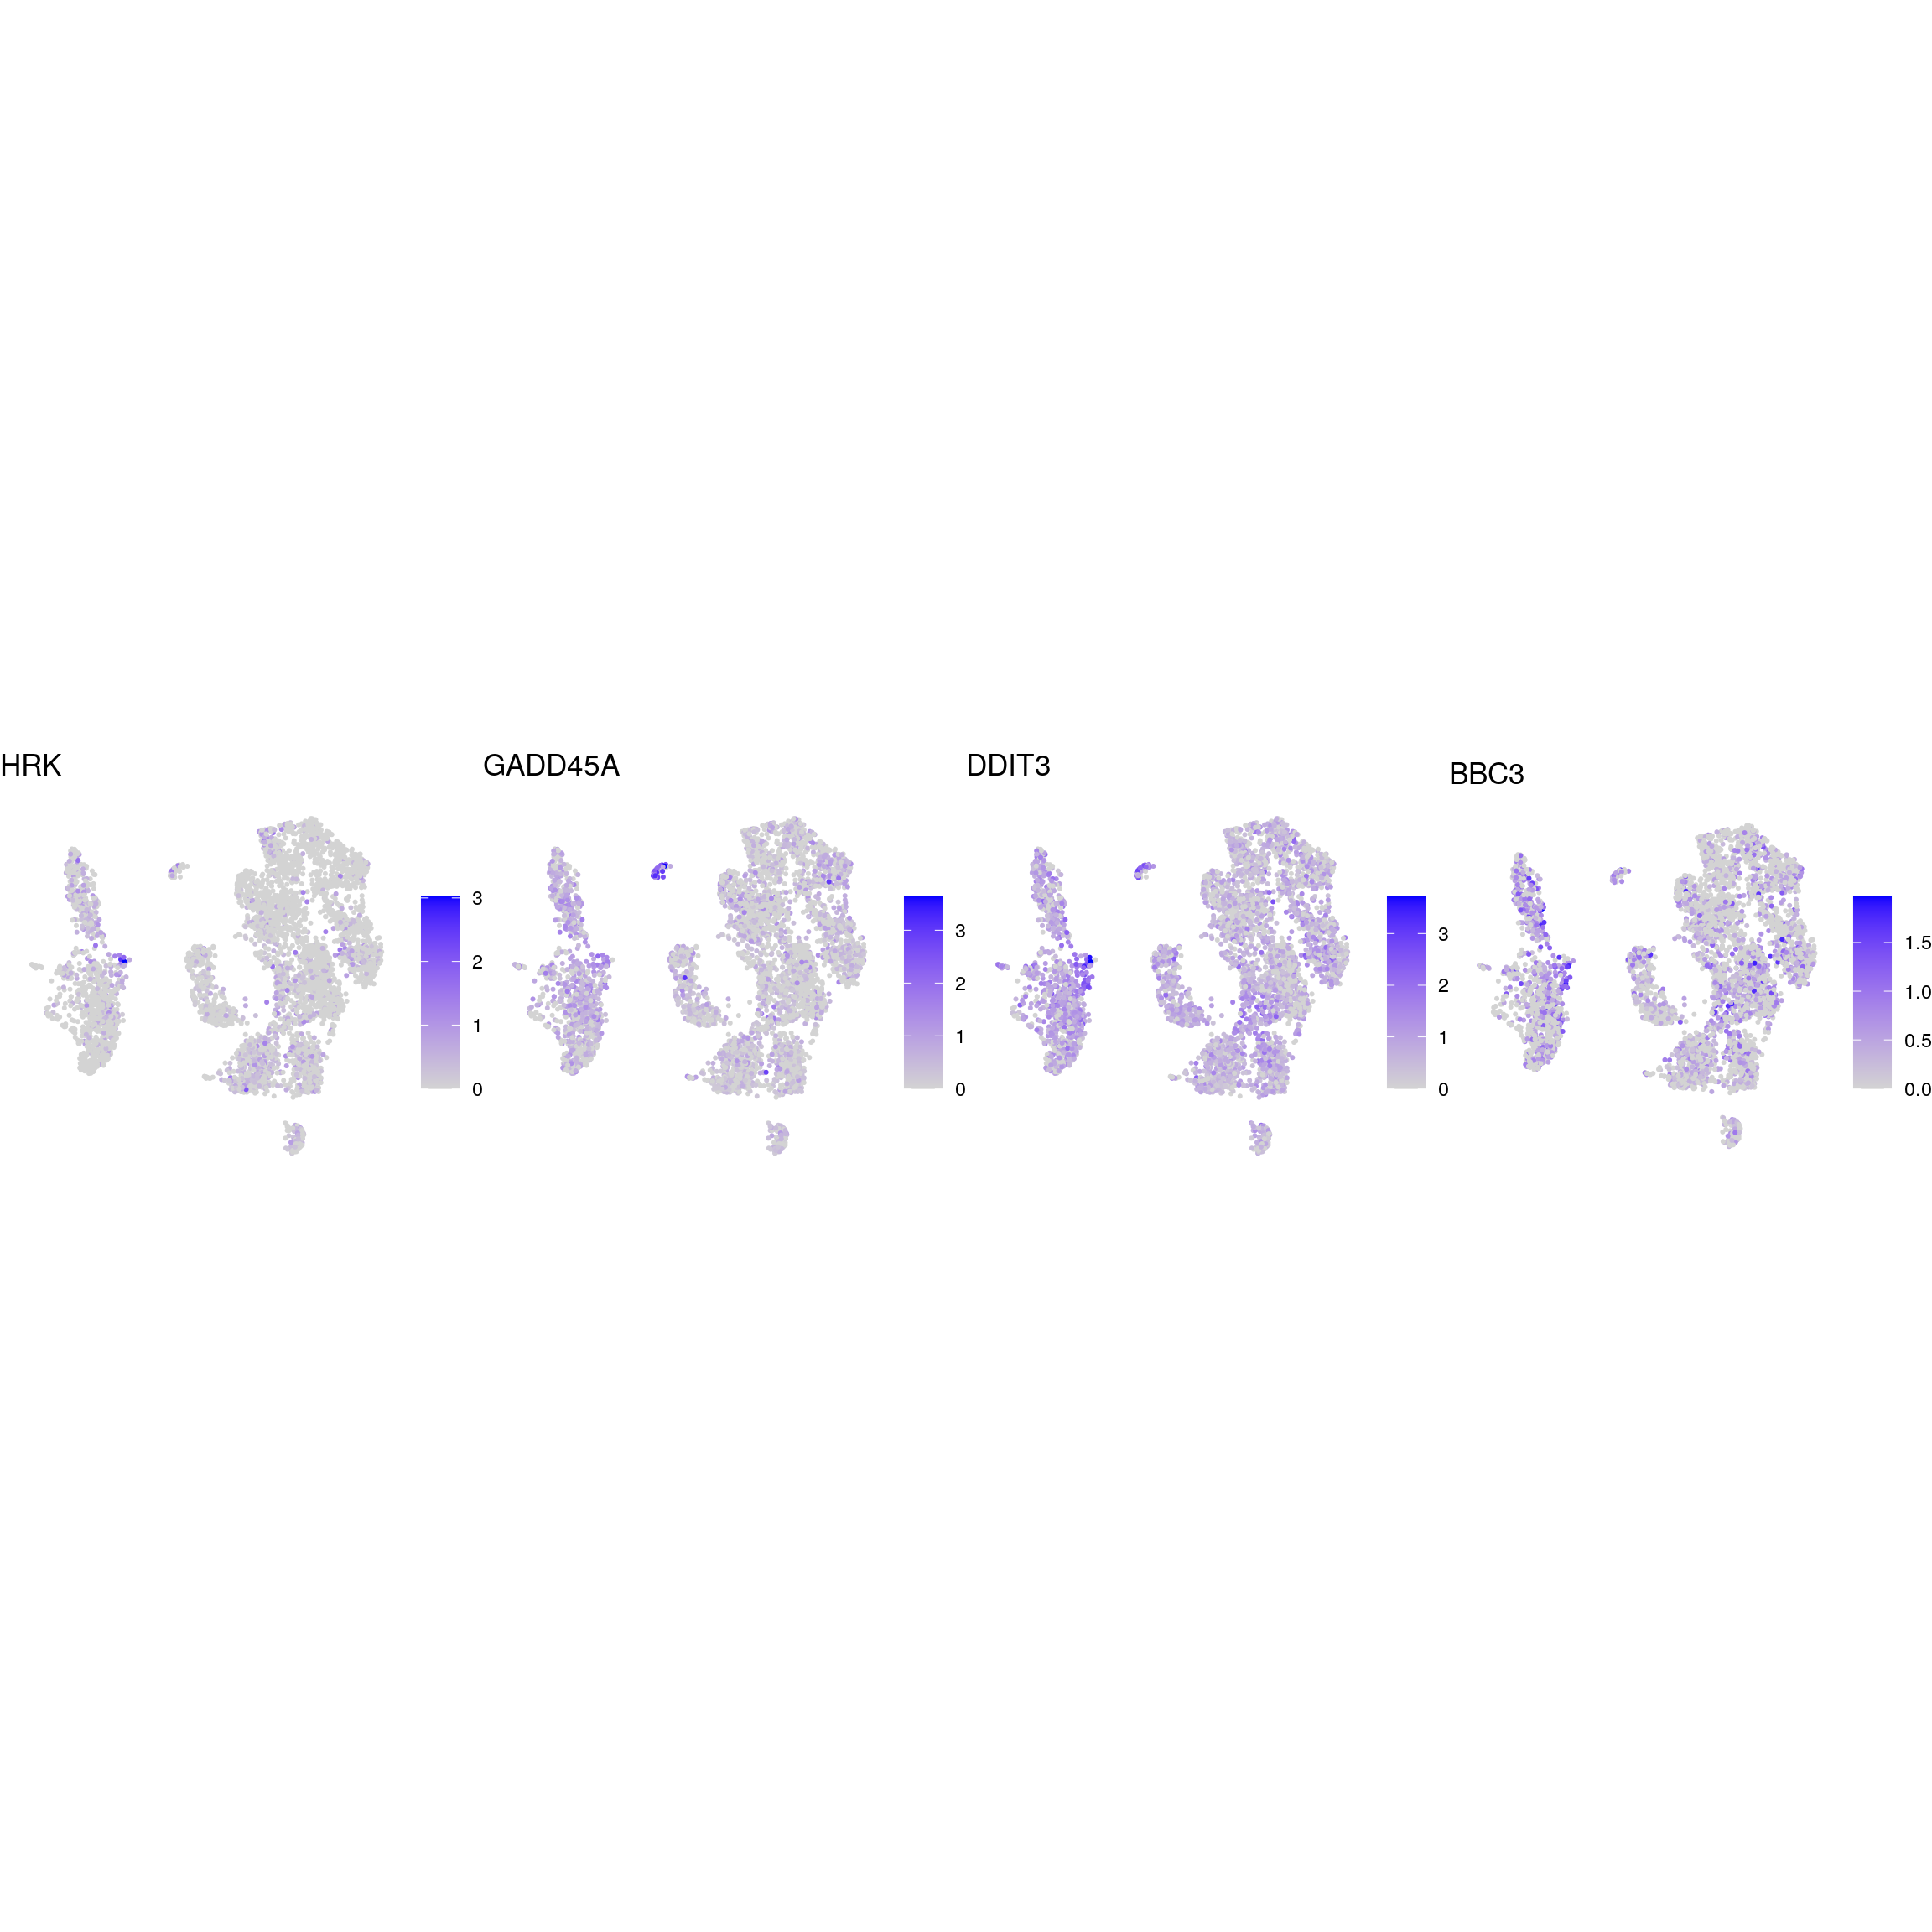
kinase
ALS-related
| Version | Author | Date |
|---|---|---|
| ecba9c2 | khembach | 2021-04-20 |
## plot the expression of the endogenous TDP-43 and TDP-HA
tdp <- c("ENSG00000120948.TARDBP", "ENSG00000120948.TARDBP-alevin", "TDP43-HA")
names(tdp) <- c("TARDBP", "TARDBP-alevin", "TDP-HA")
cat("## TDP-43\n")
TDP-43
ps <- lapply(seq_along(tdp), function(i) {
    if (!tdp[i] %in% rownames(so)) return(NULL)
    FeaturePlot(sub, features = tdp[i], reduction = "umap", pt.size = 0.4) +
        theme(aspect.ratio = 1, legend.position = "none") +
        ggtitle(names(tdp)[i]) + theme_void() + theme(aspect.ratio = 1)
})
# arrange plots in grid
ps <- ps[!vapply(ps, is.null, logical(1))]
p <- plot_grid(plotlist = ps, ncol = 4, label_size = 10)
print(p)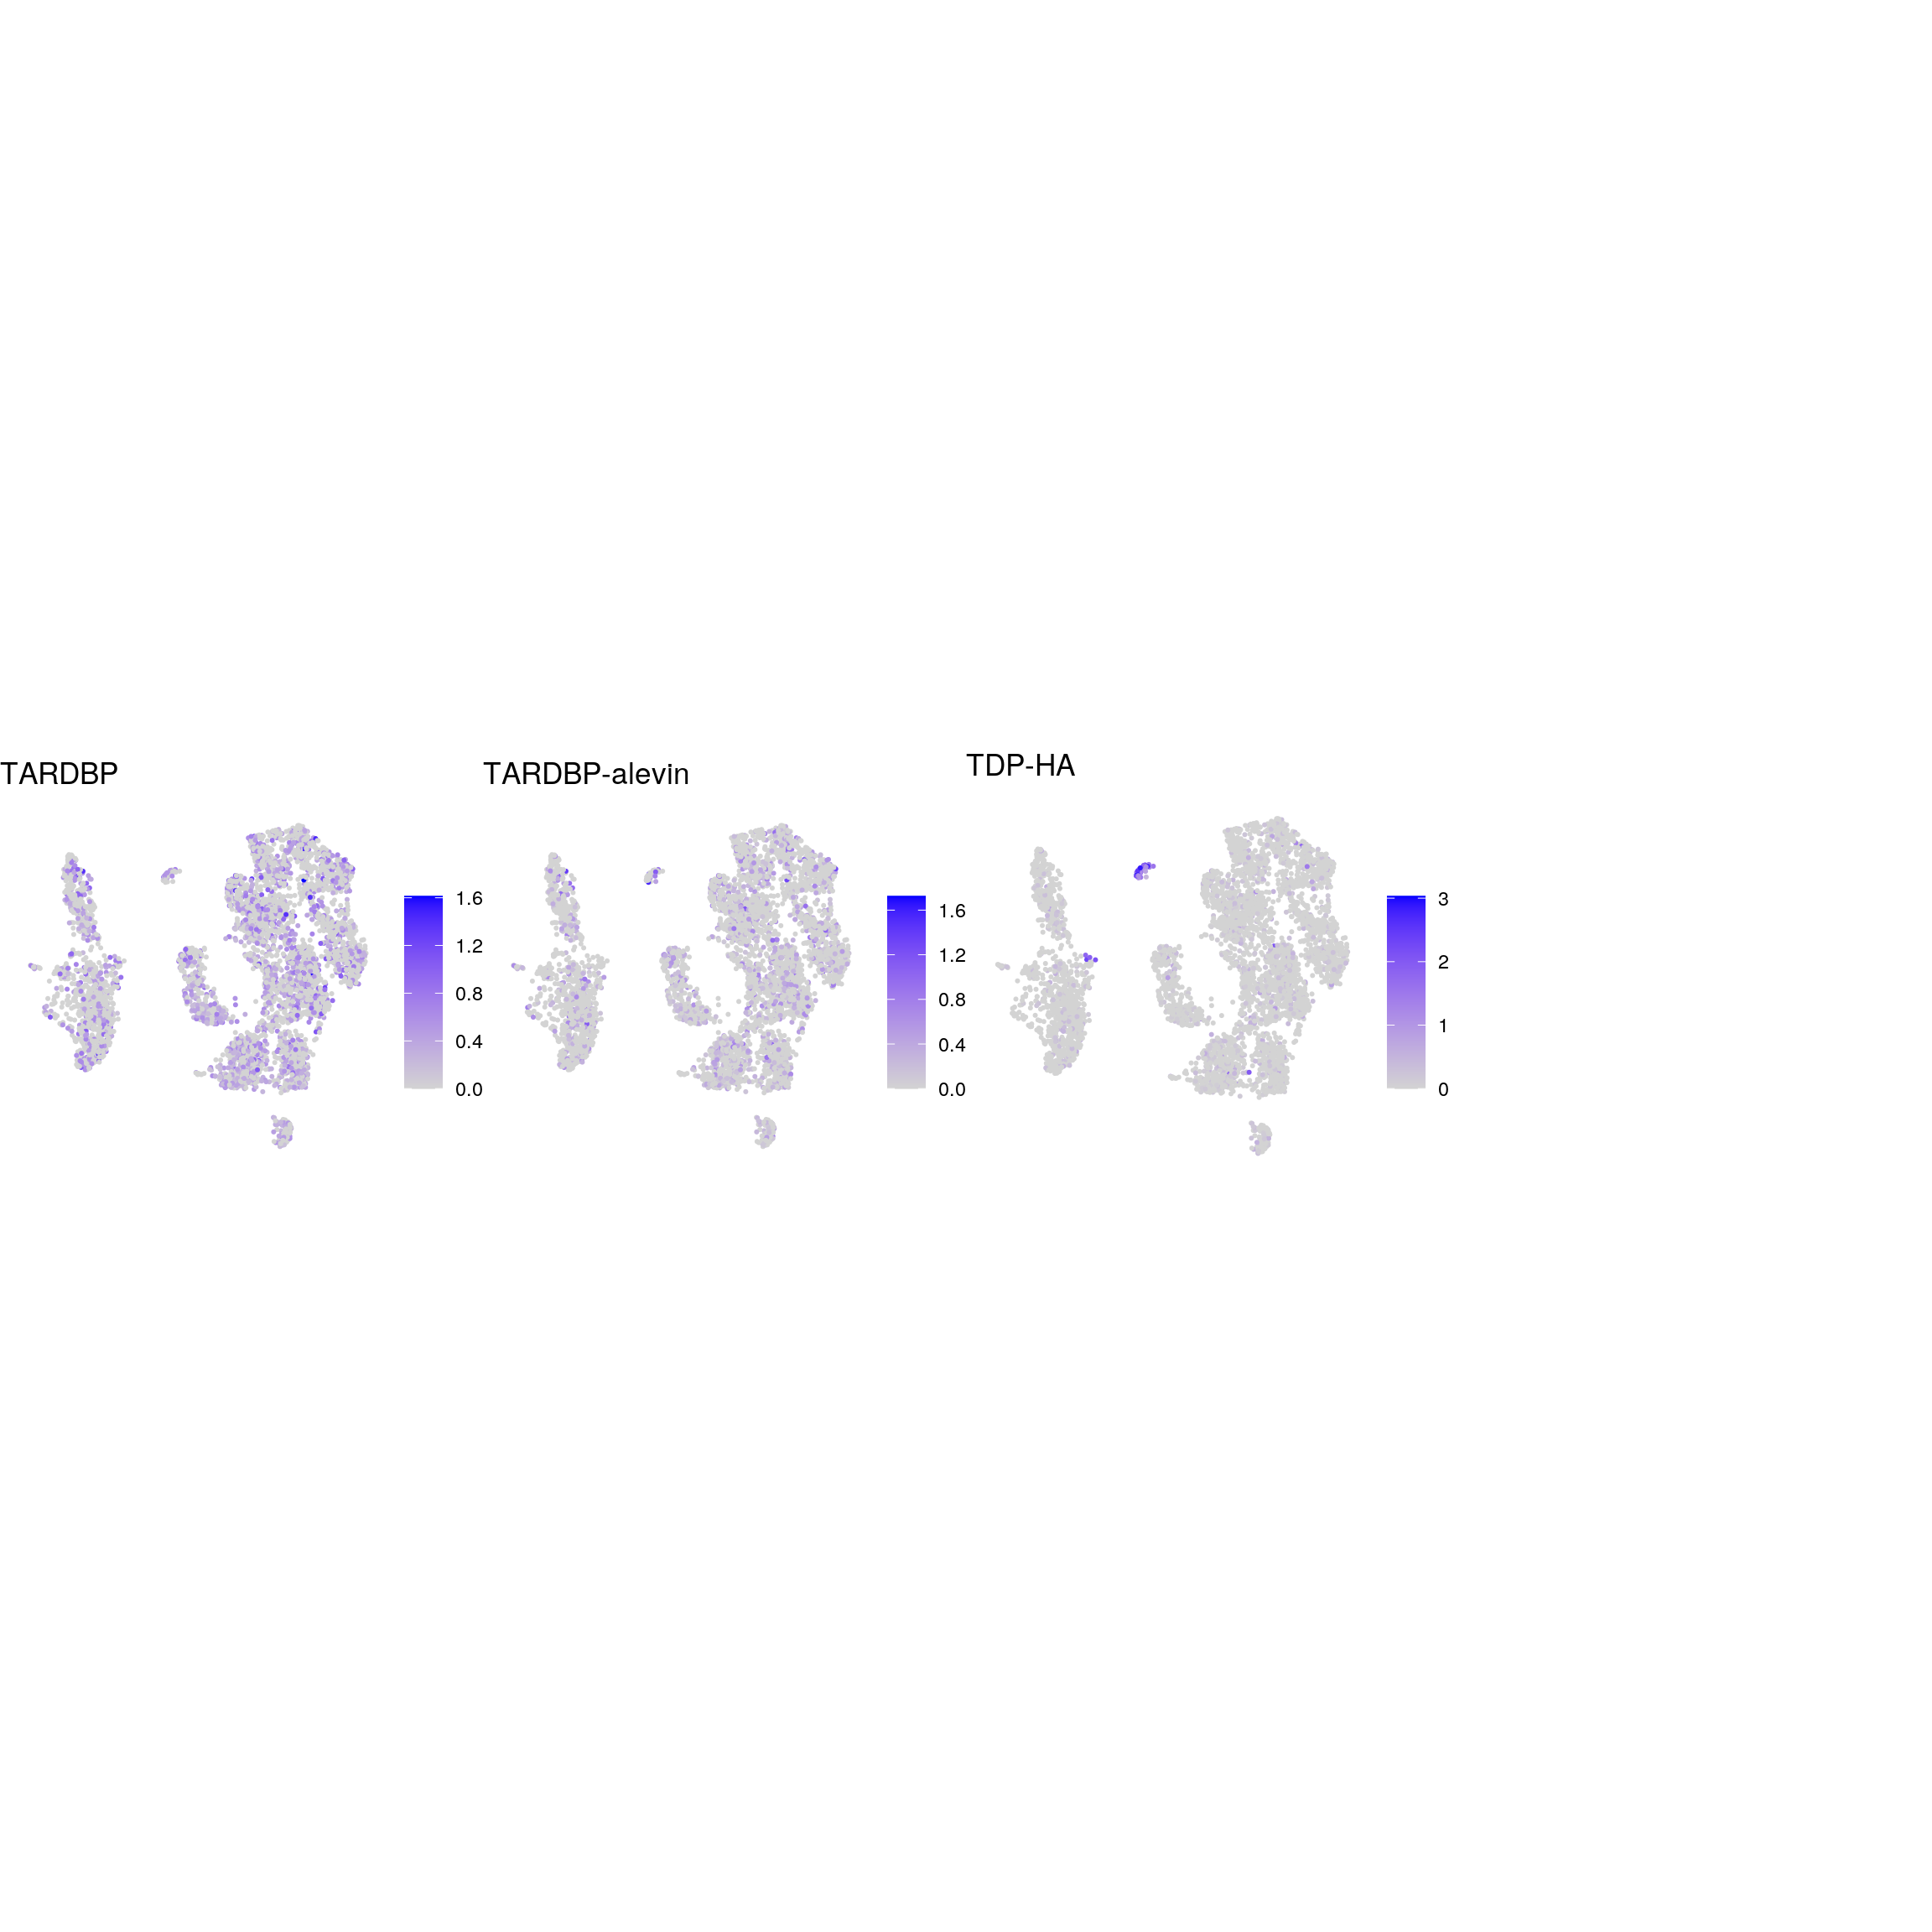
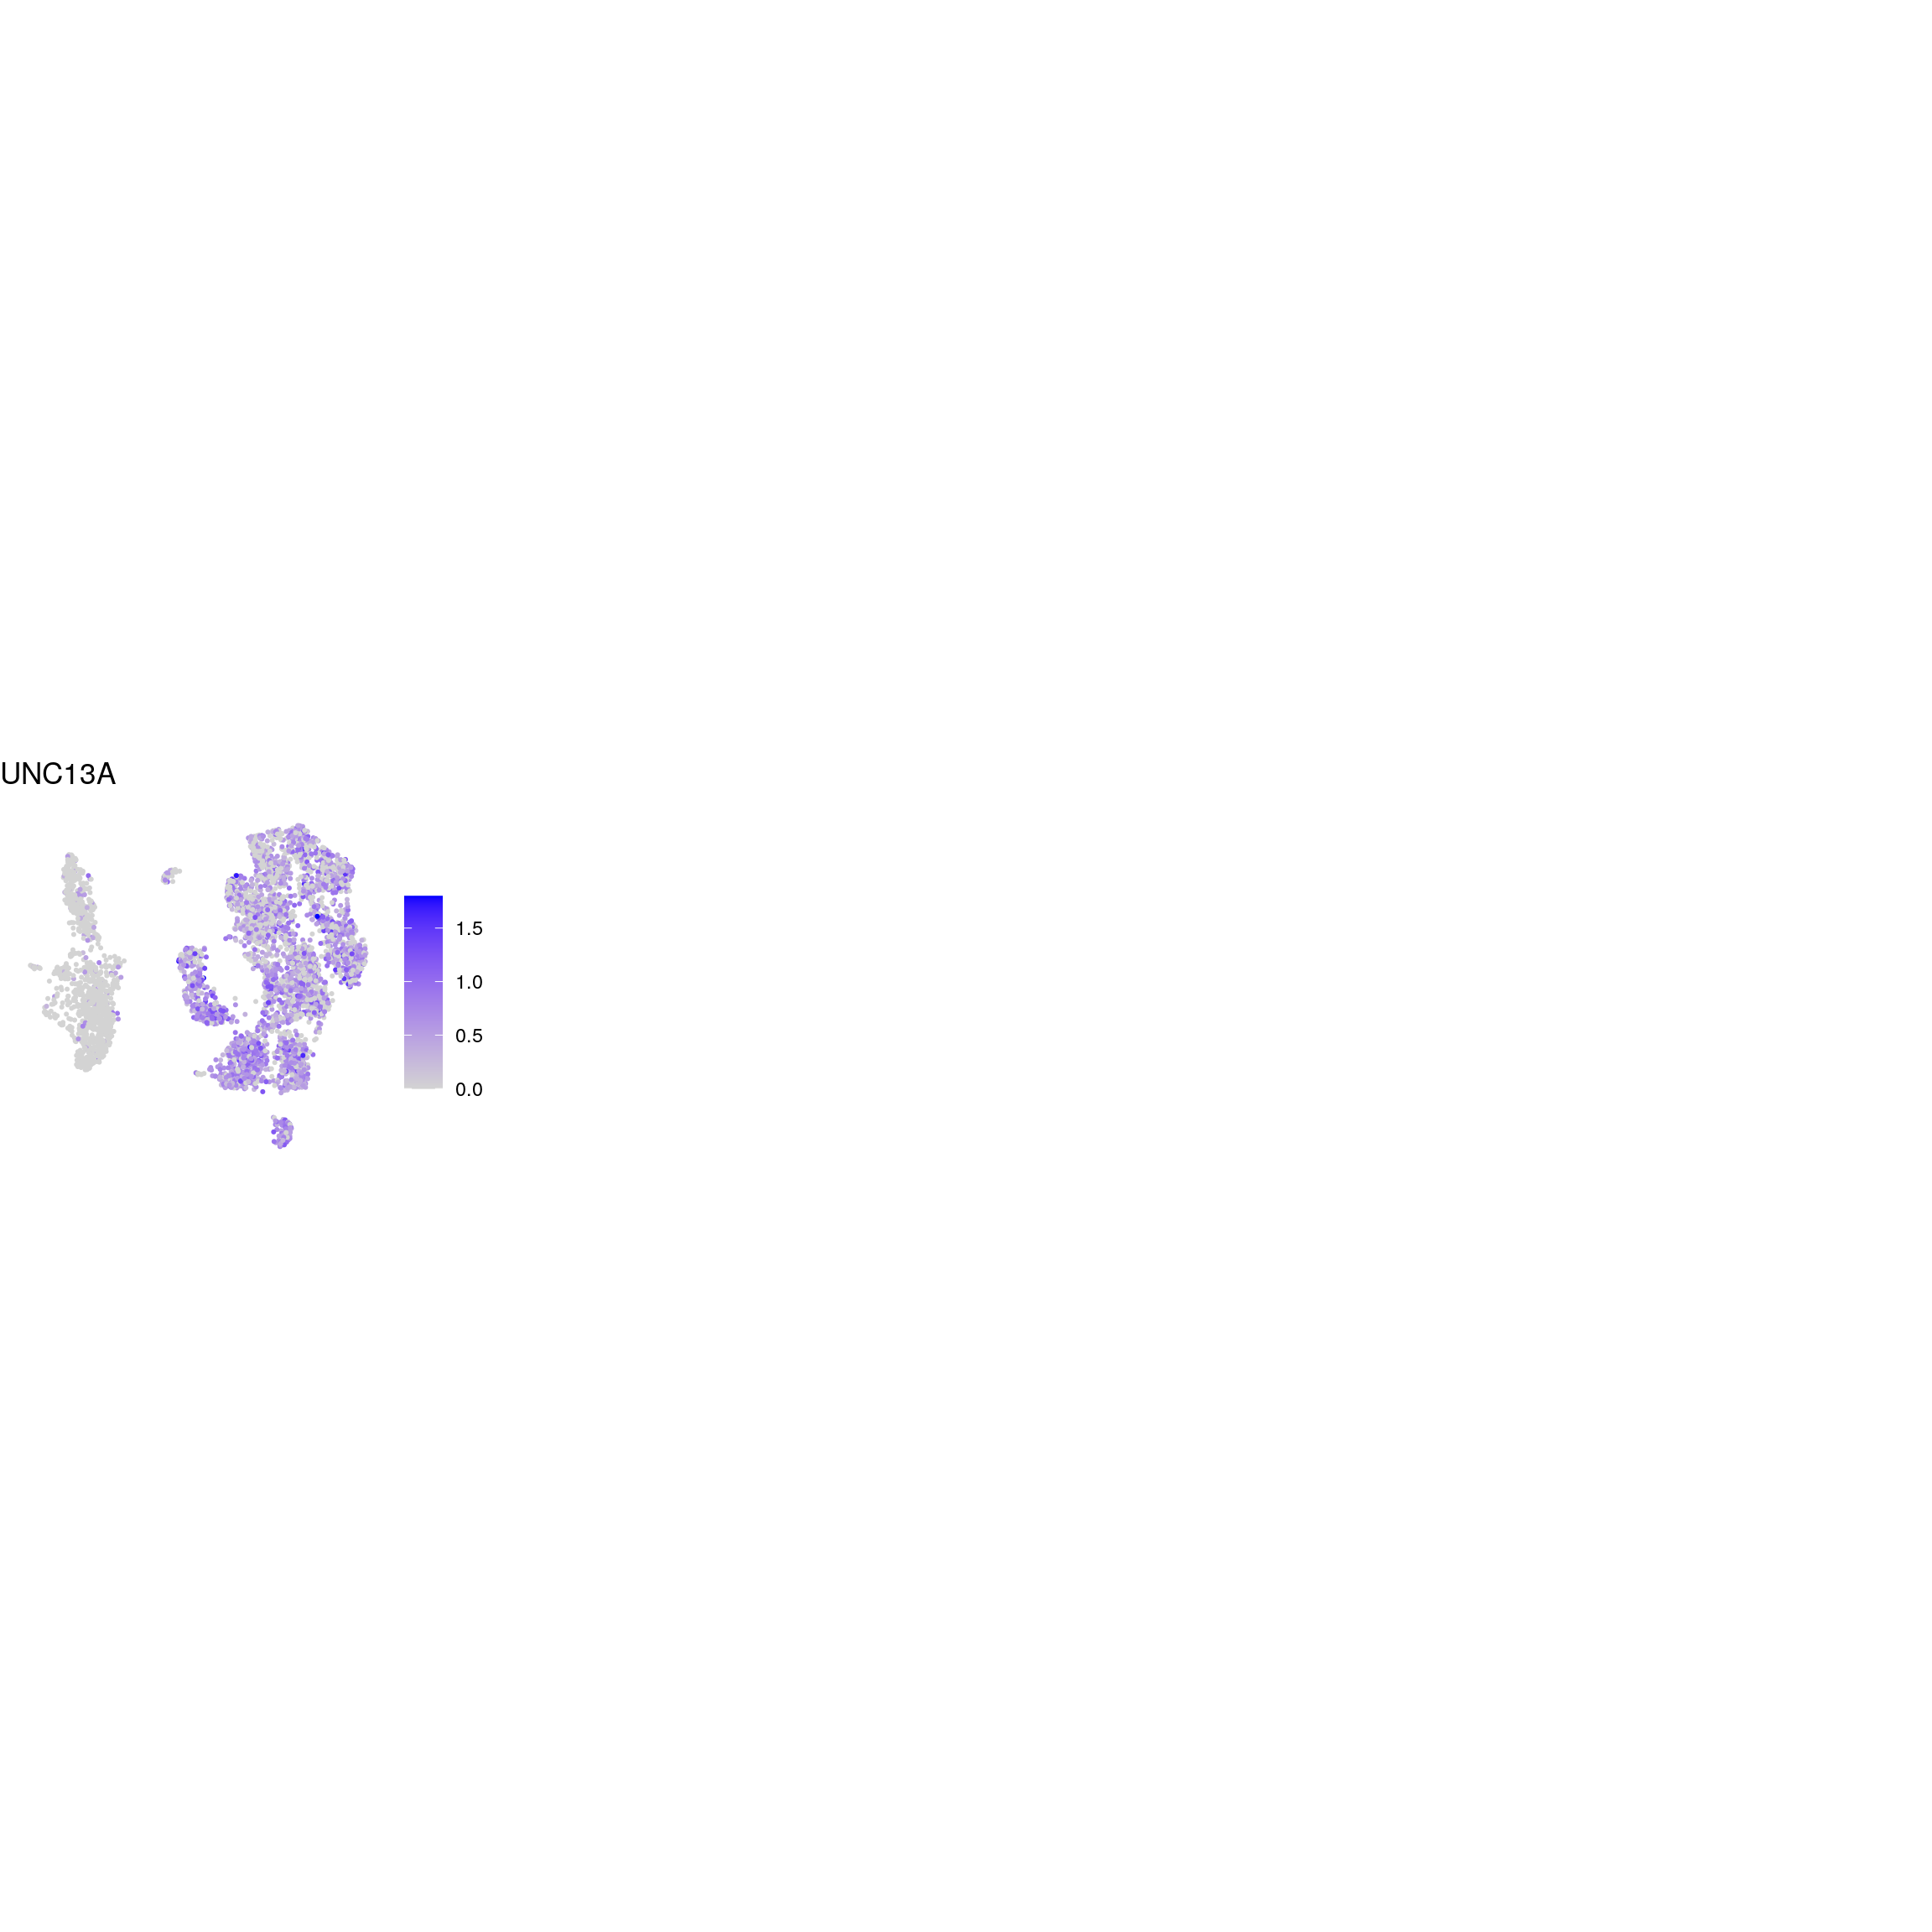
cat("\n\n")## UNC13A
cat("## UNC13A\n")UNC13A
FeaturePlot(sub, features = "ENSG00000130477.UNC13A", reduction = "umap",
            pt.size = 0.4) +
    theme(aspect.ratio = 1, legend.position = "none") +
    ggtitle("UNC13A") + theme_void() + theme(aspect.ratio = 1)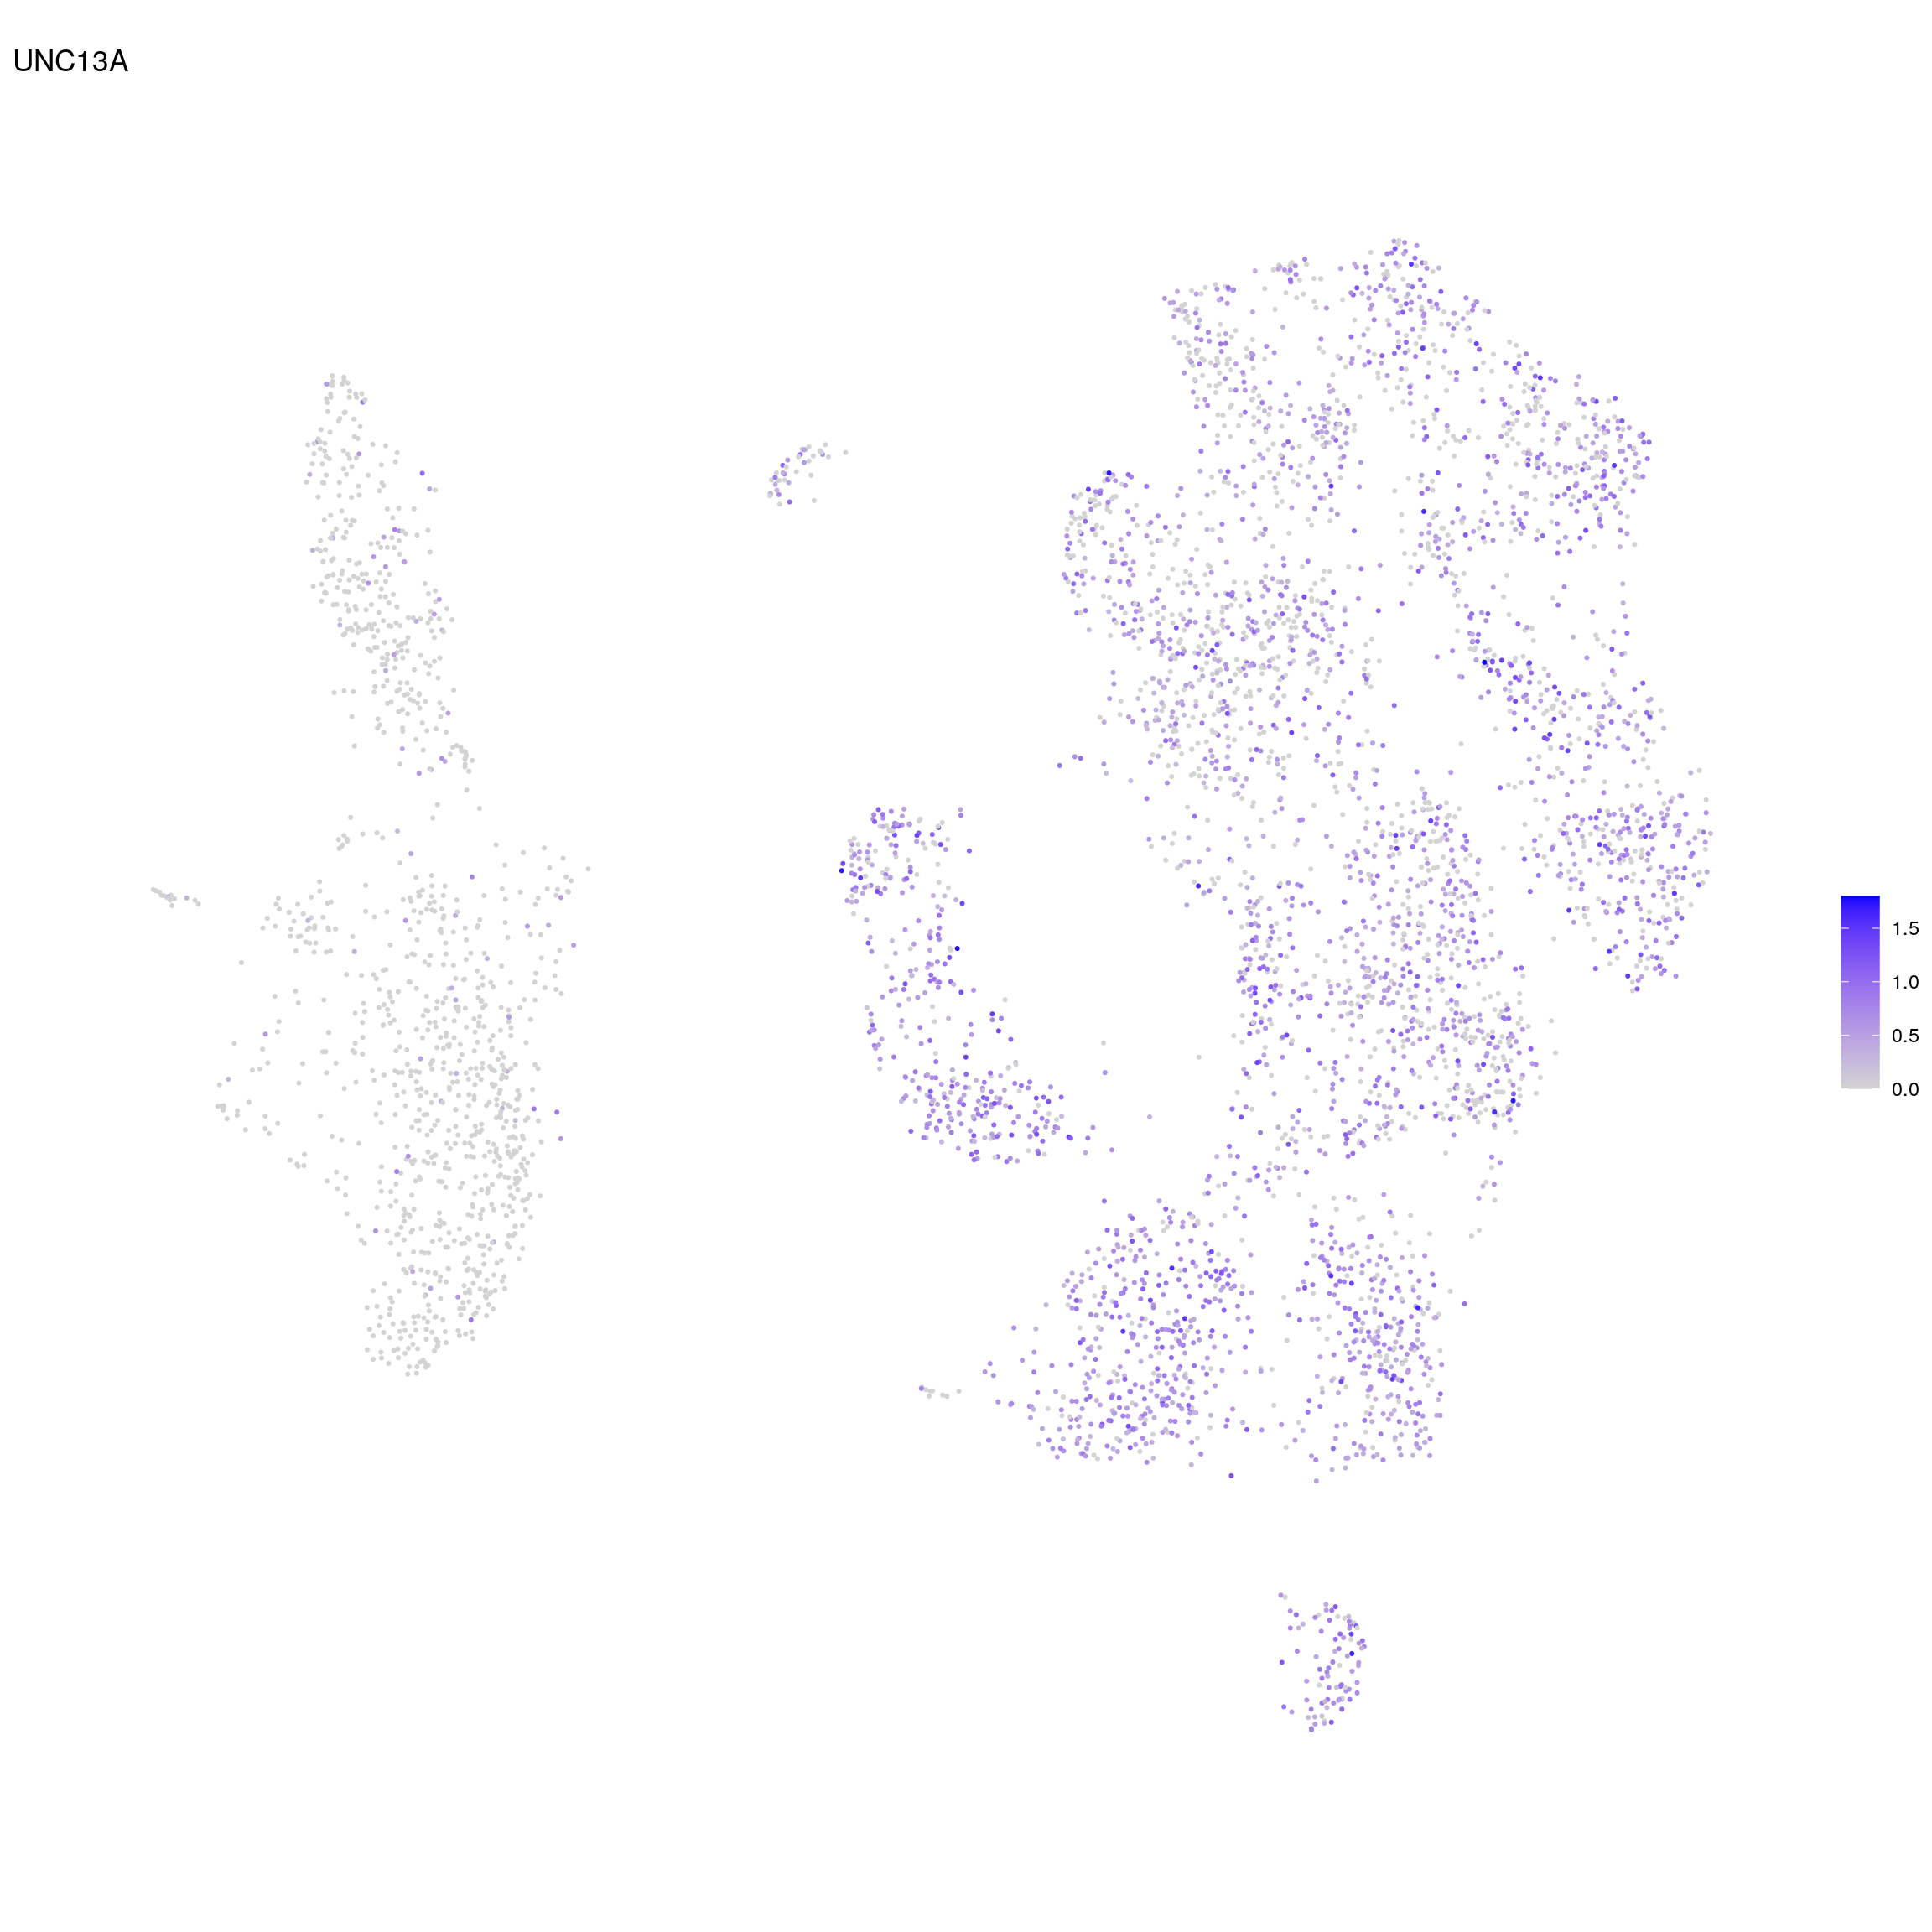
cat("\n\n")Reactive astrocyte markers
## source file with list of known marker genes
source(file.path("data", "reactive_astrocyte_markers.R"))
fs <- lapply(fs, sapply, function(g)
    grep(pattern = paste0("\\.", g, "$"), rownames(sce), value = TRUE)
  )

fs <- lapply(fs, function(x) unlist(x[lengths(x) !=0]) )

gs <- gsub(".*\\.", "", unlist(fs))
ns <- vapply(fs, length, numeric(1))
ks <- rep.int(names(fs), ns)
labs <- lapply(fs, function(x) gsub(".*\\.", "",x))
Heatmap of reactive astrocyte markers
# compute cluster-marker means
ms_by_cluster <- lapply(fs, function(gs) vapply(cs_by_k, function(i)
        Matrix::rowMeans(logcounts(sce)[gs, i, drop = FALSE]),
        numeric(length(gs))))
# prep. for plotting & scale b/w 0 and 1
mat <- do.call("rbind", ms_by_cluster)
mat <- muscat:::.scale(mat)
rownames(mat) <- gs
cols <- muscat:::.cluster_colors[seq_along(fs)]
cols <- setNames(cols, names(fs))
row_anno <- rowAnnotation(
    df = data.frame(label = factor(ks, levels = names(fs))),
    col = list(label = cols), gp = gpar(col = "white"))
# percentage of cells from each of the samples per cluster
sample_props <- prop.table(n_cells, margin = 1)
col_mat <- as.matrix(unclass(sample_props))
sample_cols <- c("#882255", "#11588A",  "#117733", "#44AA99")
sample_cols <- setNames(sample_cols, colnames(col_mat))
col_anno <- HeatmapAnnotation(
    perc_sample = anno_barplot(col_mat, gp = gpar(fill = sample_cols),
                               height = unit(2, "cm"),
                               border = FALSE),
    annotation_label = "fraction of sample\nin cluster",
    gap = unit(10, "points"))
col_lgd <- Legend(labels = names(sample_cols),
       title = "sample",
       legend_gp = gpar(fill = sample_cols))

hm <- Heatmap(mat,
    name = "scaled avg.\nexpression",
    col = viridis(10),
    cluster_rows = FALSE,
    cluster_columns = FALSE,
    row_names_side = "left",
    column_title = "cluster_id",
    column_title_side = "bottom",
    column_names_side = "bottom",
    column_names_rot = 0,
    column_names_centered = TRUE,
    rect_gp = gpar(col = "white"),
    left_annotation = row_anno,
    top_annotation = col_anno)
draw(hm, annotation_legend_list = list(col_lgd))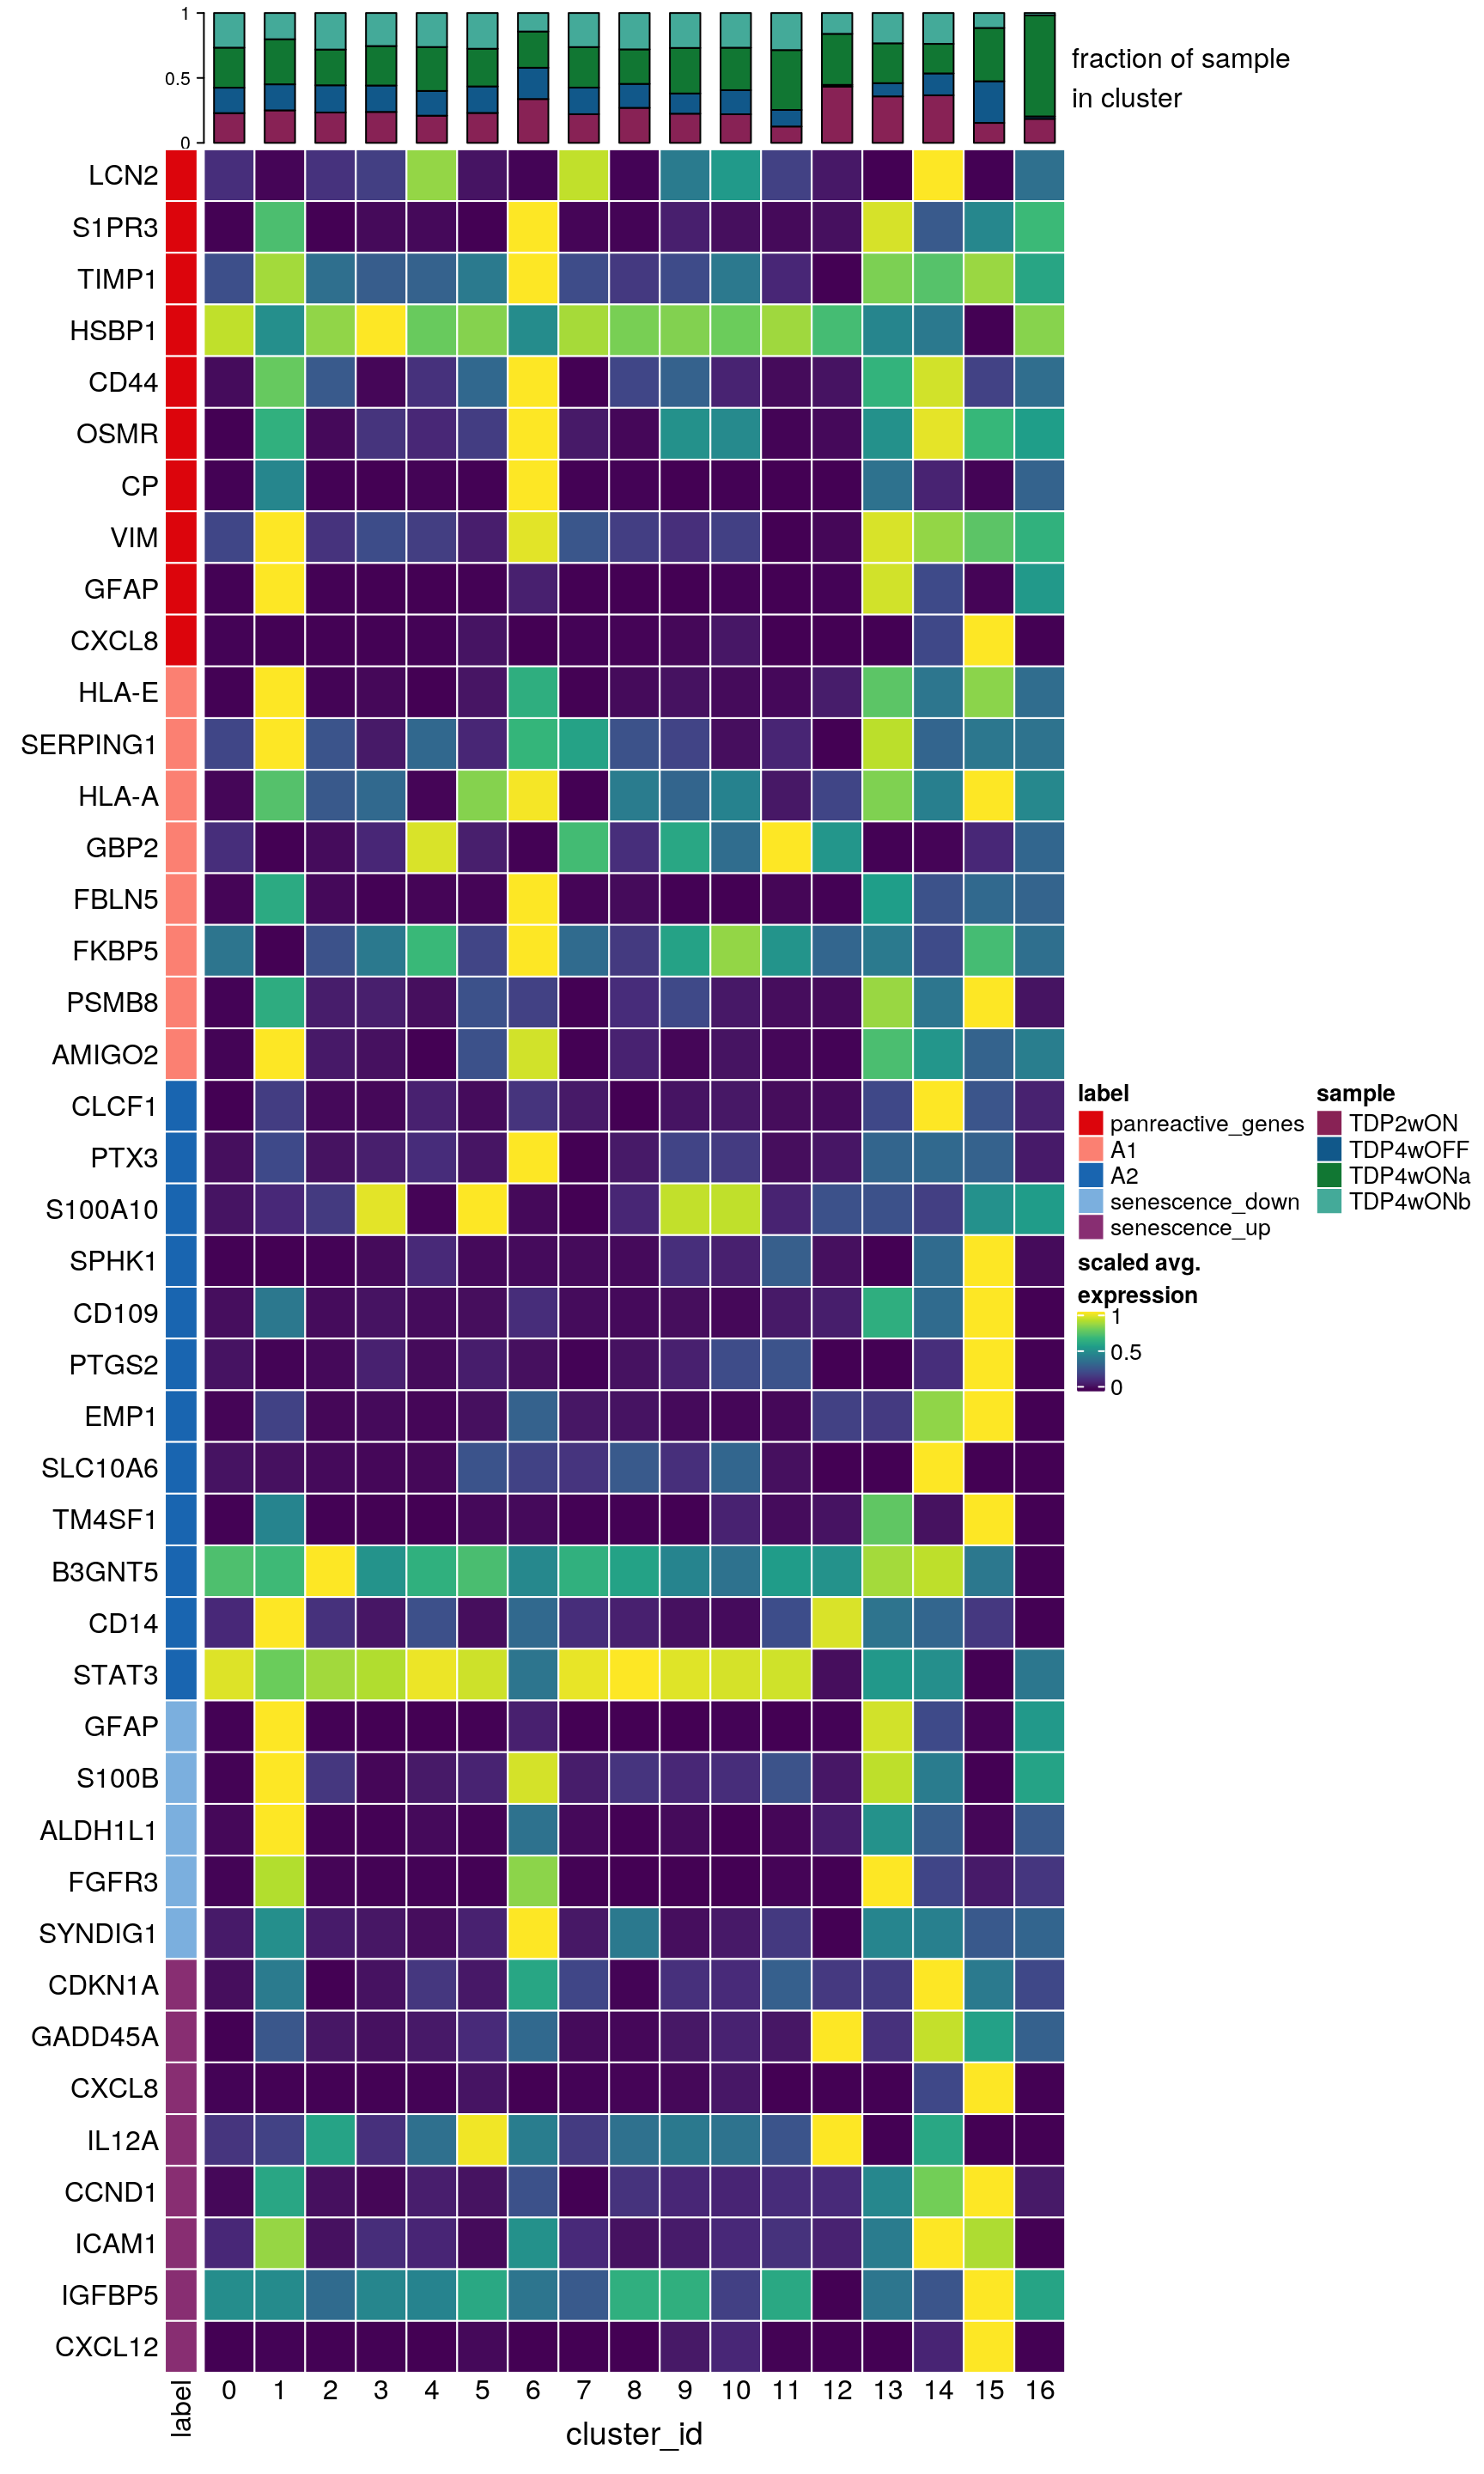
Subset to only the glial cell clusters
## subset to glial clusters
subs <- c("1", "6", "13", "14", "15", "16")
cs_by_k_sub <- cs_by_k[subs]
# compute cluster-marker means
ms_by_cluster <- lapply(fs, function(gs) vapply(cs_by_k_sub, function(i)
        Matrix::rowMeans(logcounts(sce)[gs, i, drop = FALSE]),
        numeric(length(gs))))
# prep. for plotting & scale b/w 0 and 1
mat <- do.call("rbind", ms_by_cluster)
mat <- muscat:::.scale(mat)
rownames(mat) <- gs
cols <- muscat:::.cluster_colors[seq_along(fs)]
cols <- setNames(cols, names(fs))
row_anno <- rowAnnotation(
    df = data.frame(label = factor(ks, levels = names(fs))),
    col = list(label = cols), gp = gpar(col = "white"))
# percentage of cells from each of the samples per cluster
sample_props <- prop.table(n_cells, margin = 1)
col_mat <- as.matrix(unclass(sample_props[subs,]))
sample_cols <- c("#882255", "#11588A",  "#117733", "#44AA99")
sample_cols <- setNames(sample_cols, colnames(col_mat))
col_anno <- HeatmapAnnotation(
    perc_sample = anno_barplot(col_mat, gp = gpar(fill = sample_cols),
                               height = unit(2, "cm"),
                               border = FALSE),
    annotation_label = "fraction of sample\nin cluster",
    gap = unit(10, "points"))
col_lgd <- Legend(labels = names(sample_cols),
       title = "sample",
       legend_gp = gpar(fill = sample_cols))

hm <- Heatmap(mat,
    name = "scaled avg.\nexpression",
    col = viridis(10),
    cluster_rows = FALSE,
    cluster_columns = FALSE,
    row_names_side = "left",
    column_title = "cluster_id",
    column_title_side = "bottom",
    column_names_side = "bottom",
    column_names_rot = 0,
    column_names_centered = TRUE,
    rect_gp = gpar(col = "white"),
    left_annotation = row_anno,
    top_annotation = col_anno)
draw(hm, annotation_legend_list = list(col_lgd))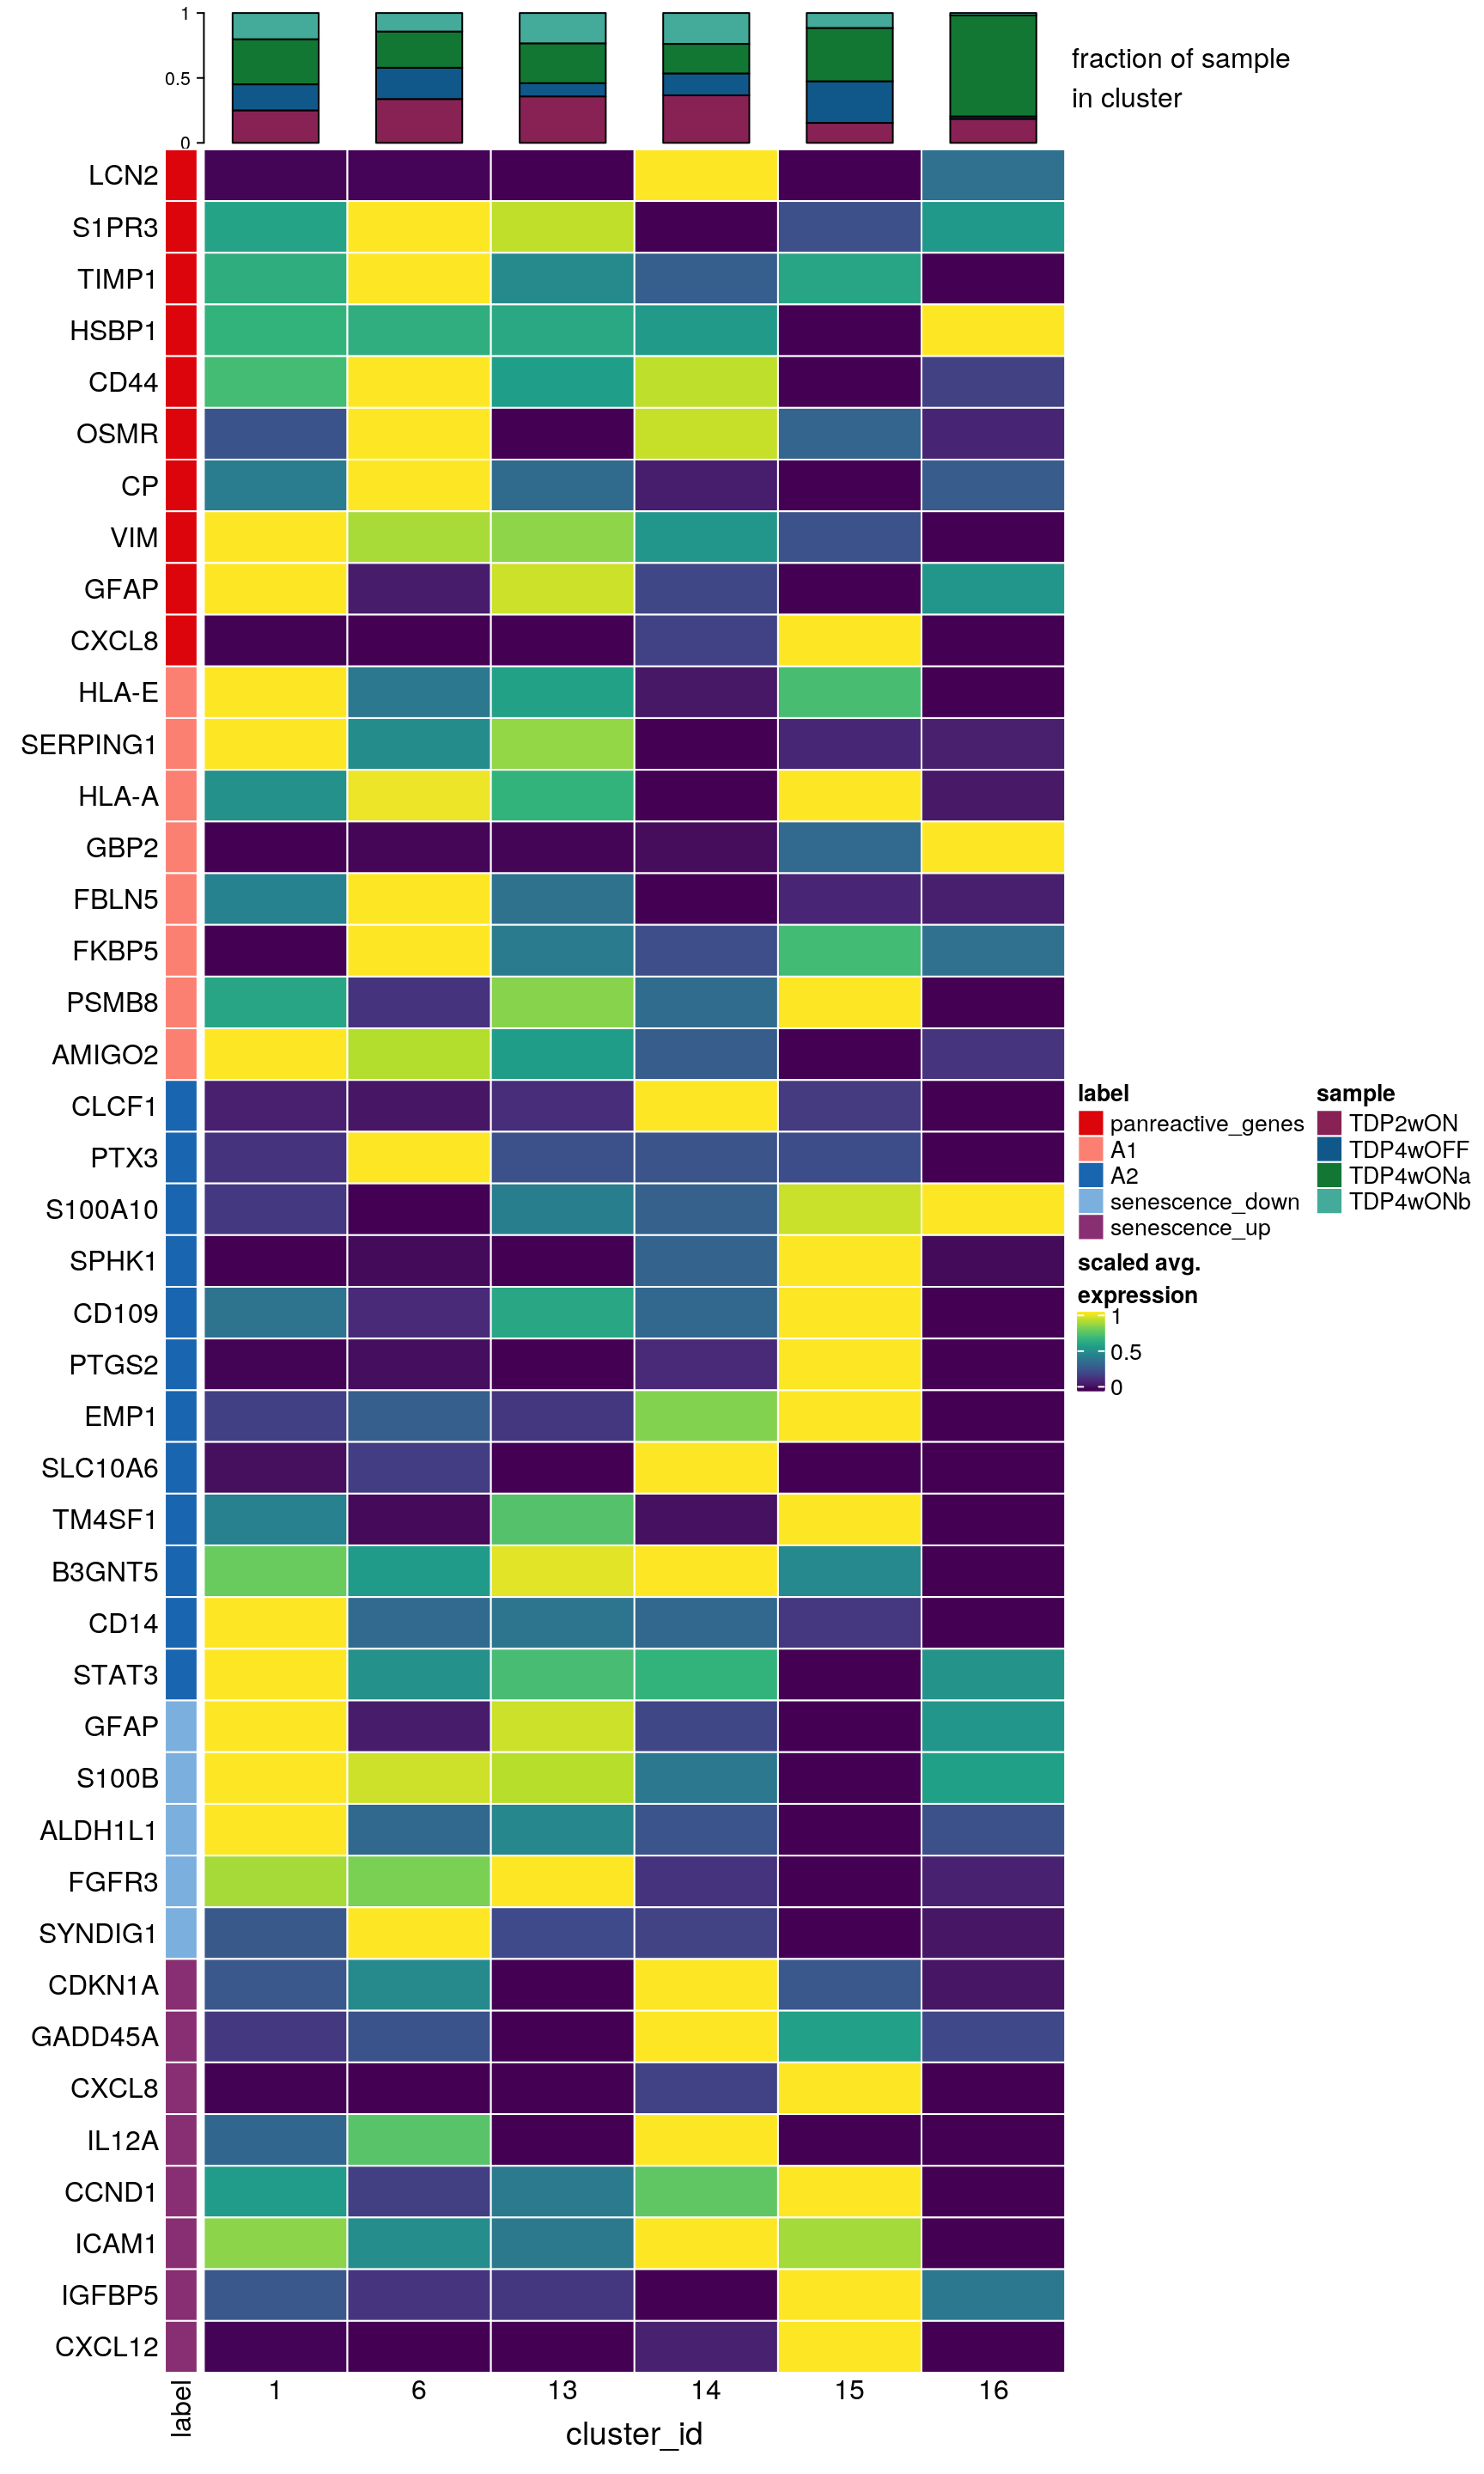
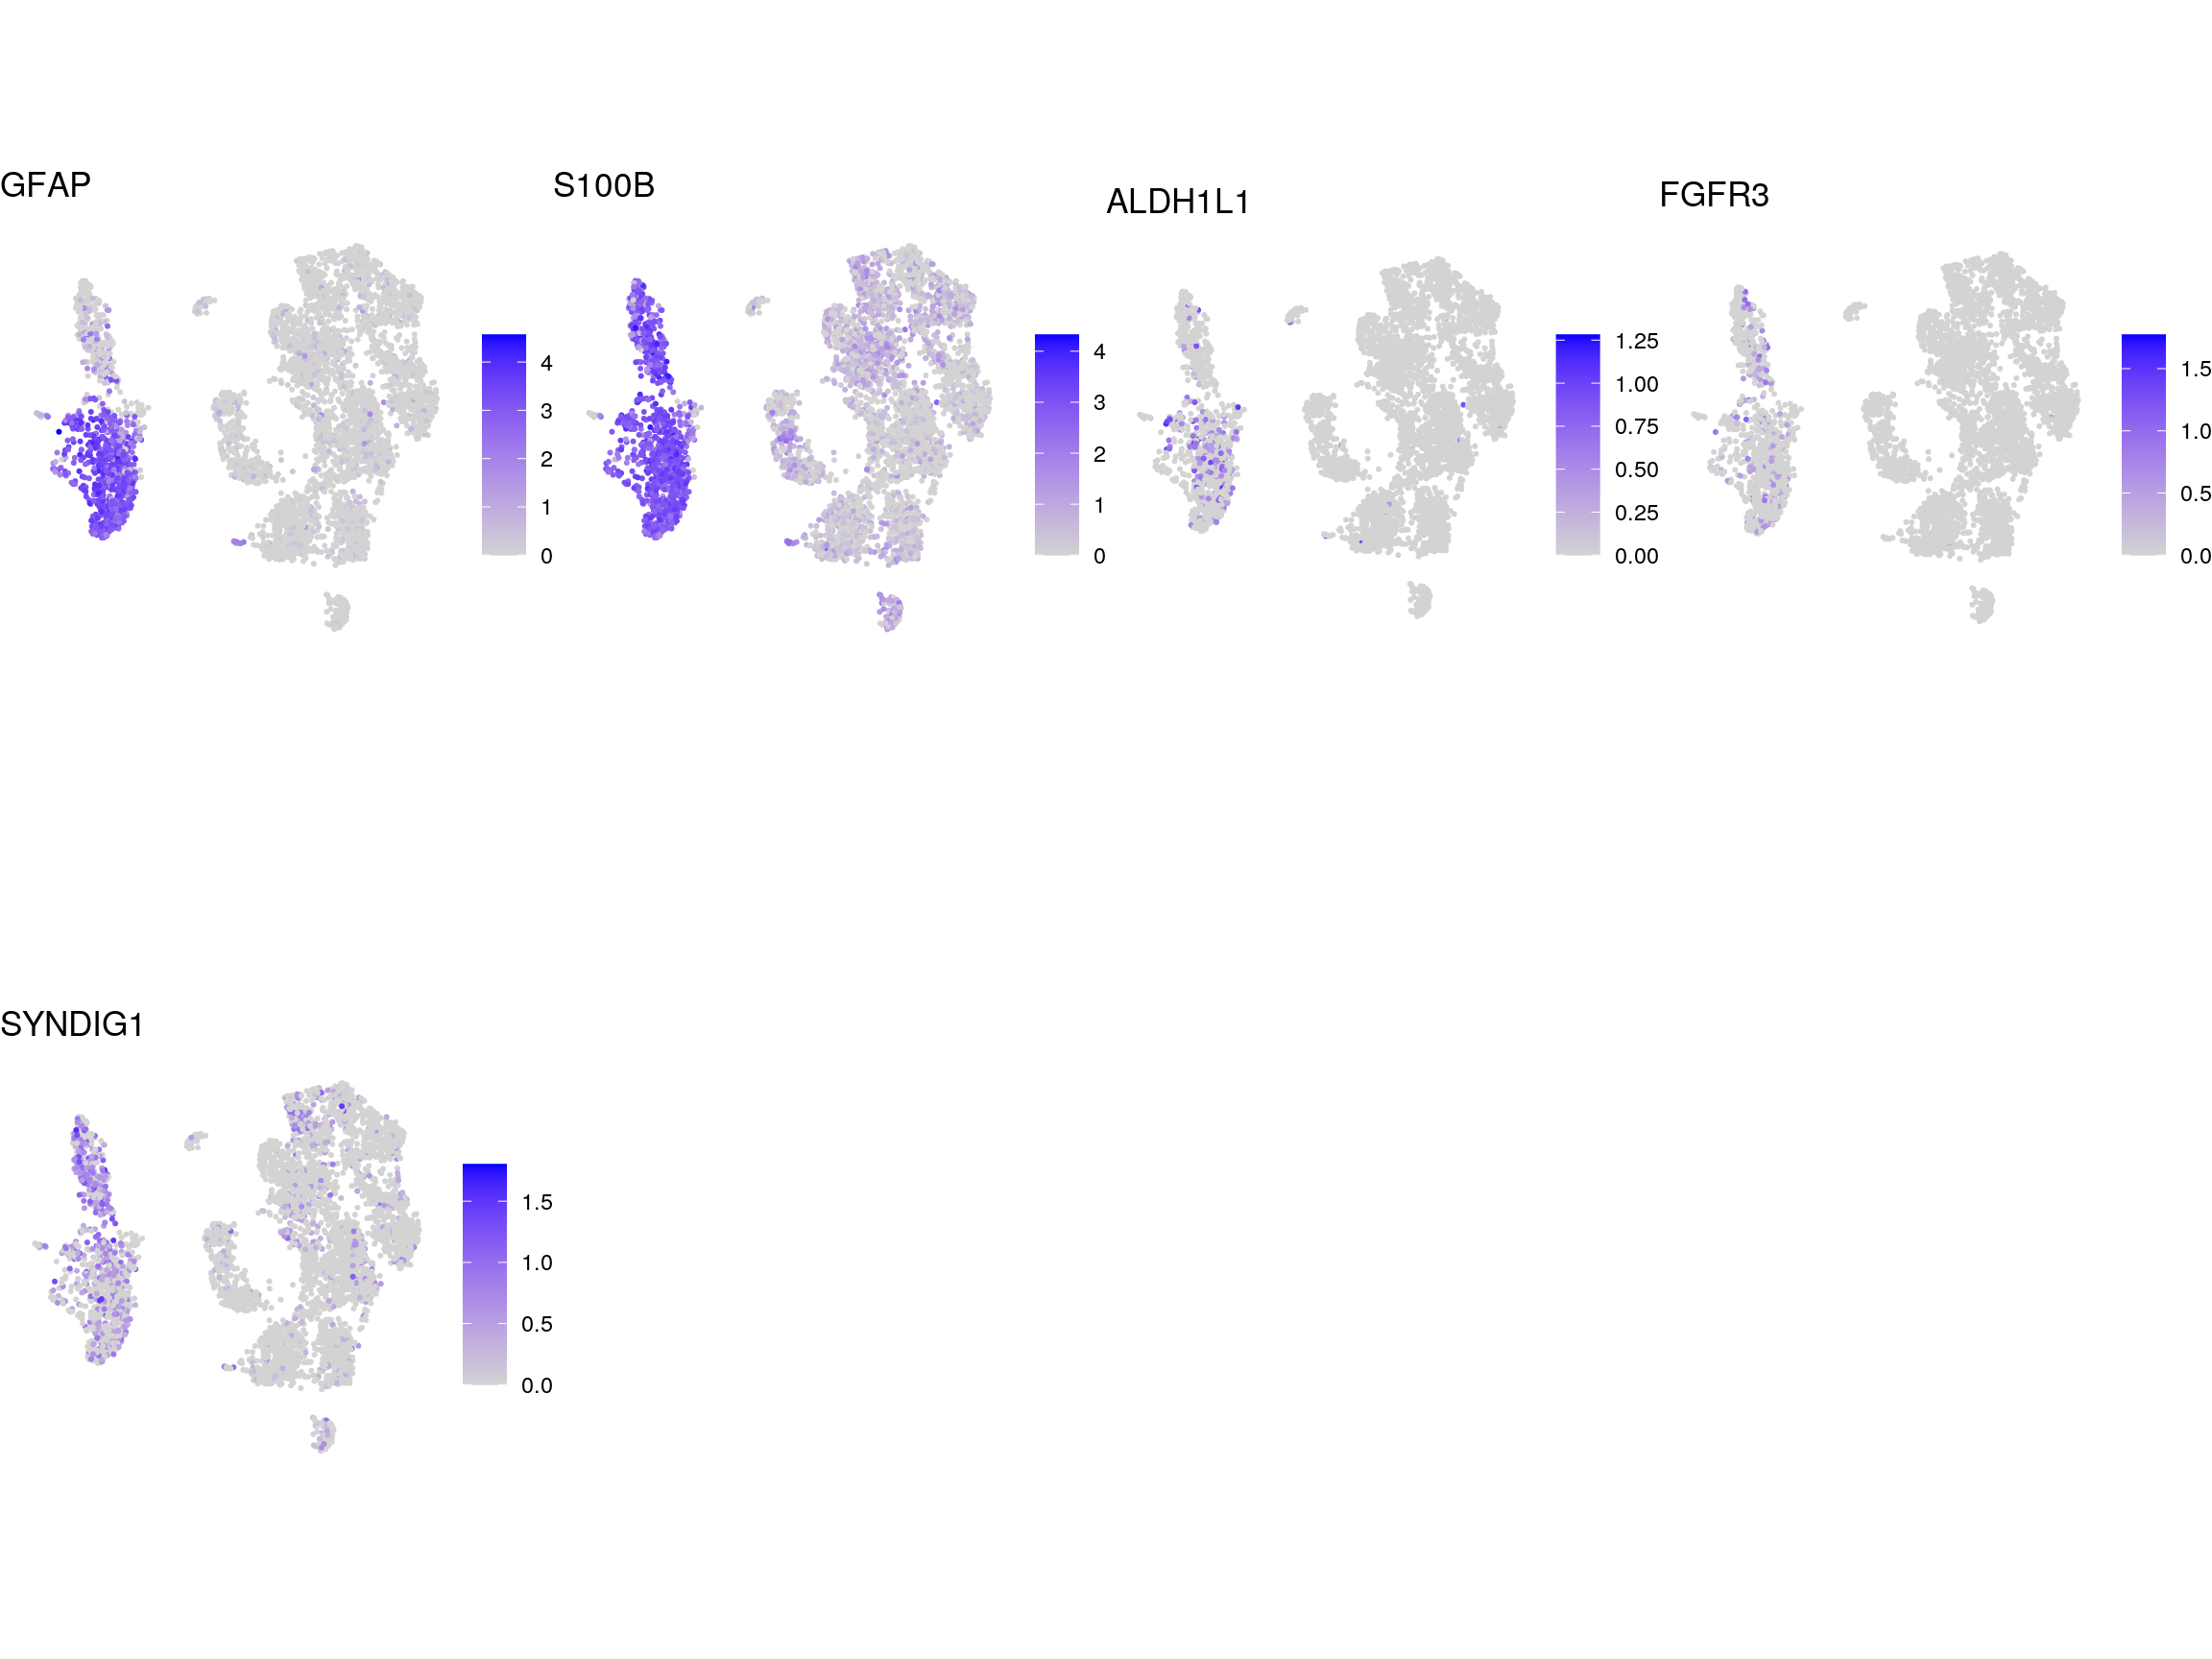
DR colored by reactive astrocyte marker expression
# UMAPs colored by marker-expression
for (m in seq_along(fs)) {
    cat("### ", names(fs)[m], "\n")
    ps <- lapply(seq_along(fs[[m]]), function(i) {
        if (!fs[[m]][i] %in% rownames(so)) return(NULL)
        FeaturePlot(sub, features = fs[[m]][i], reduction = "umap",
                    pt.size = 0.4) +
            theme(aspect.ratio = 1, legend.position = "none") +
            ggtitle(labs[[m]][i]) + theme_void() + theme(aspect.ratio = 1)
    })
    # arrange plots in grid
    ps <- ps[!vapply(ps, is.null, logical(1))]
    p <- plot_grid(plotlist = ps, ncol = 4, label_size = 10)
    print(p)
    cat("\n\n")
}
panreactive_genes
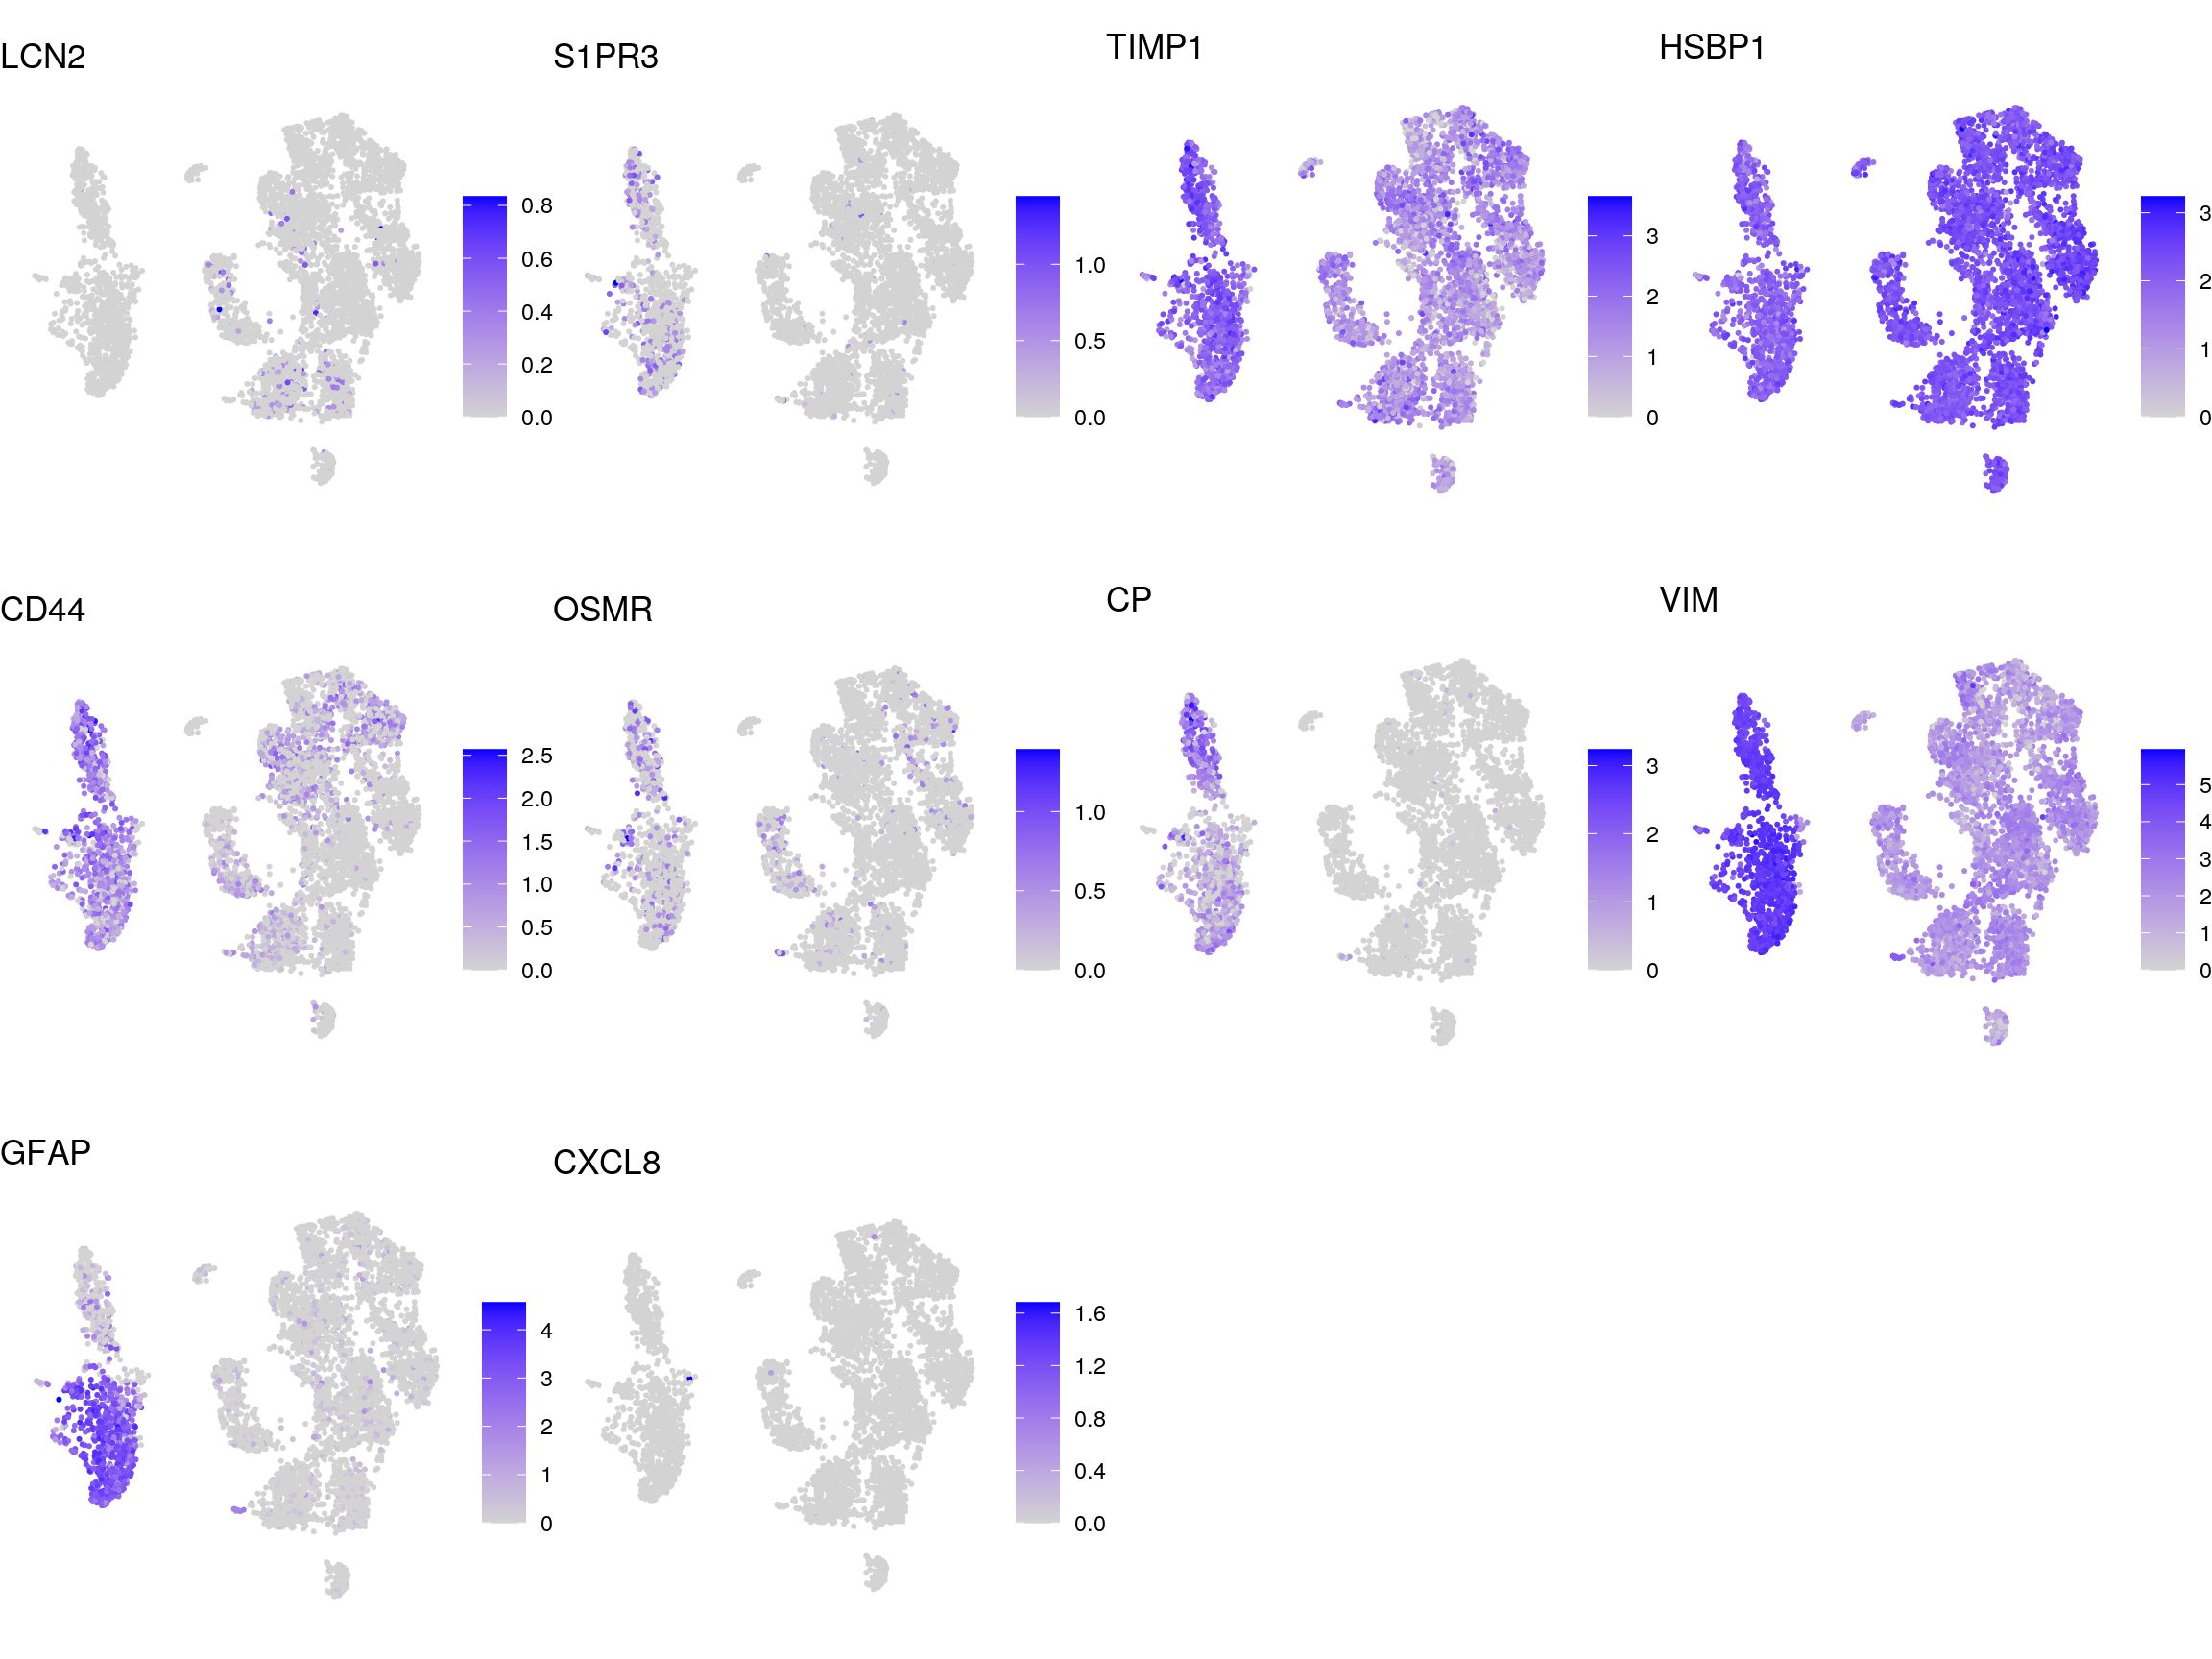
A1
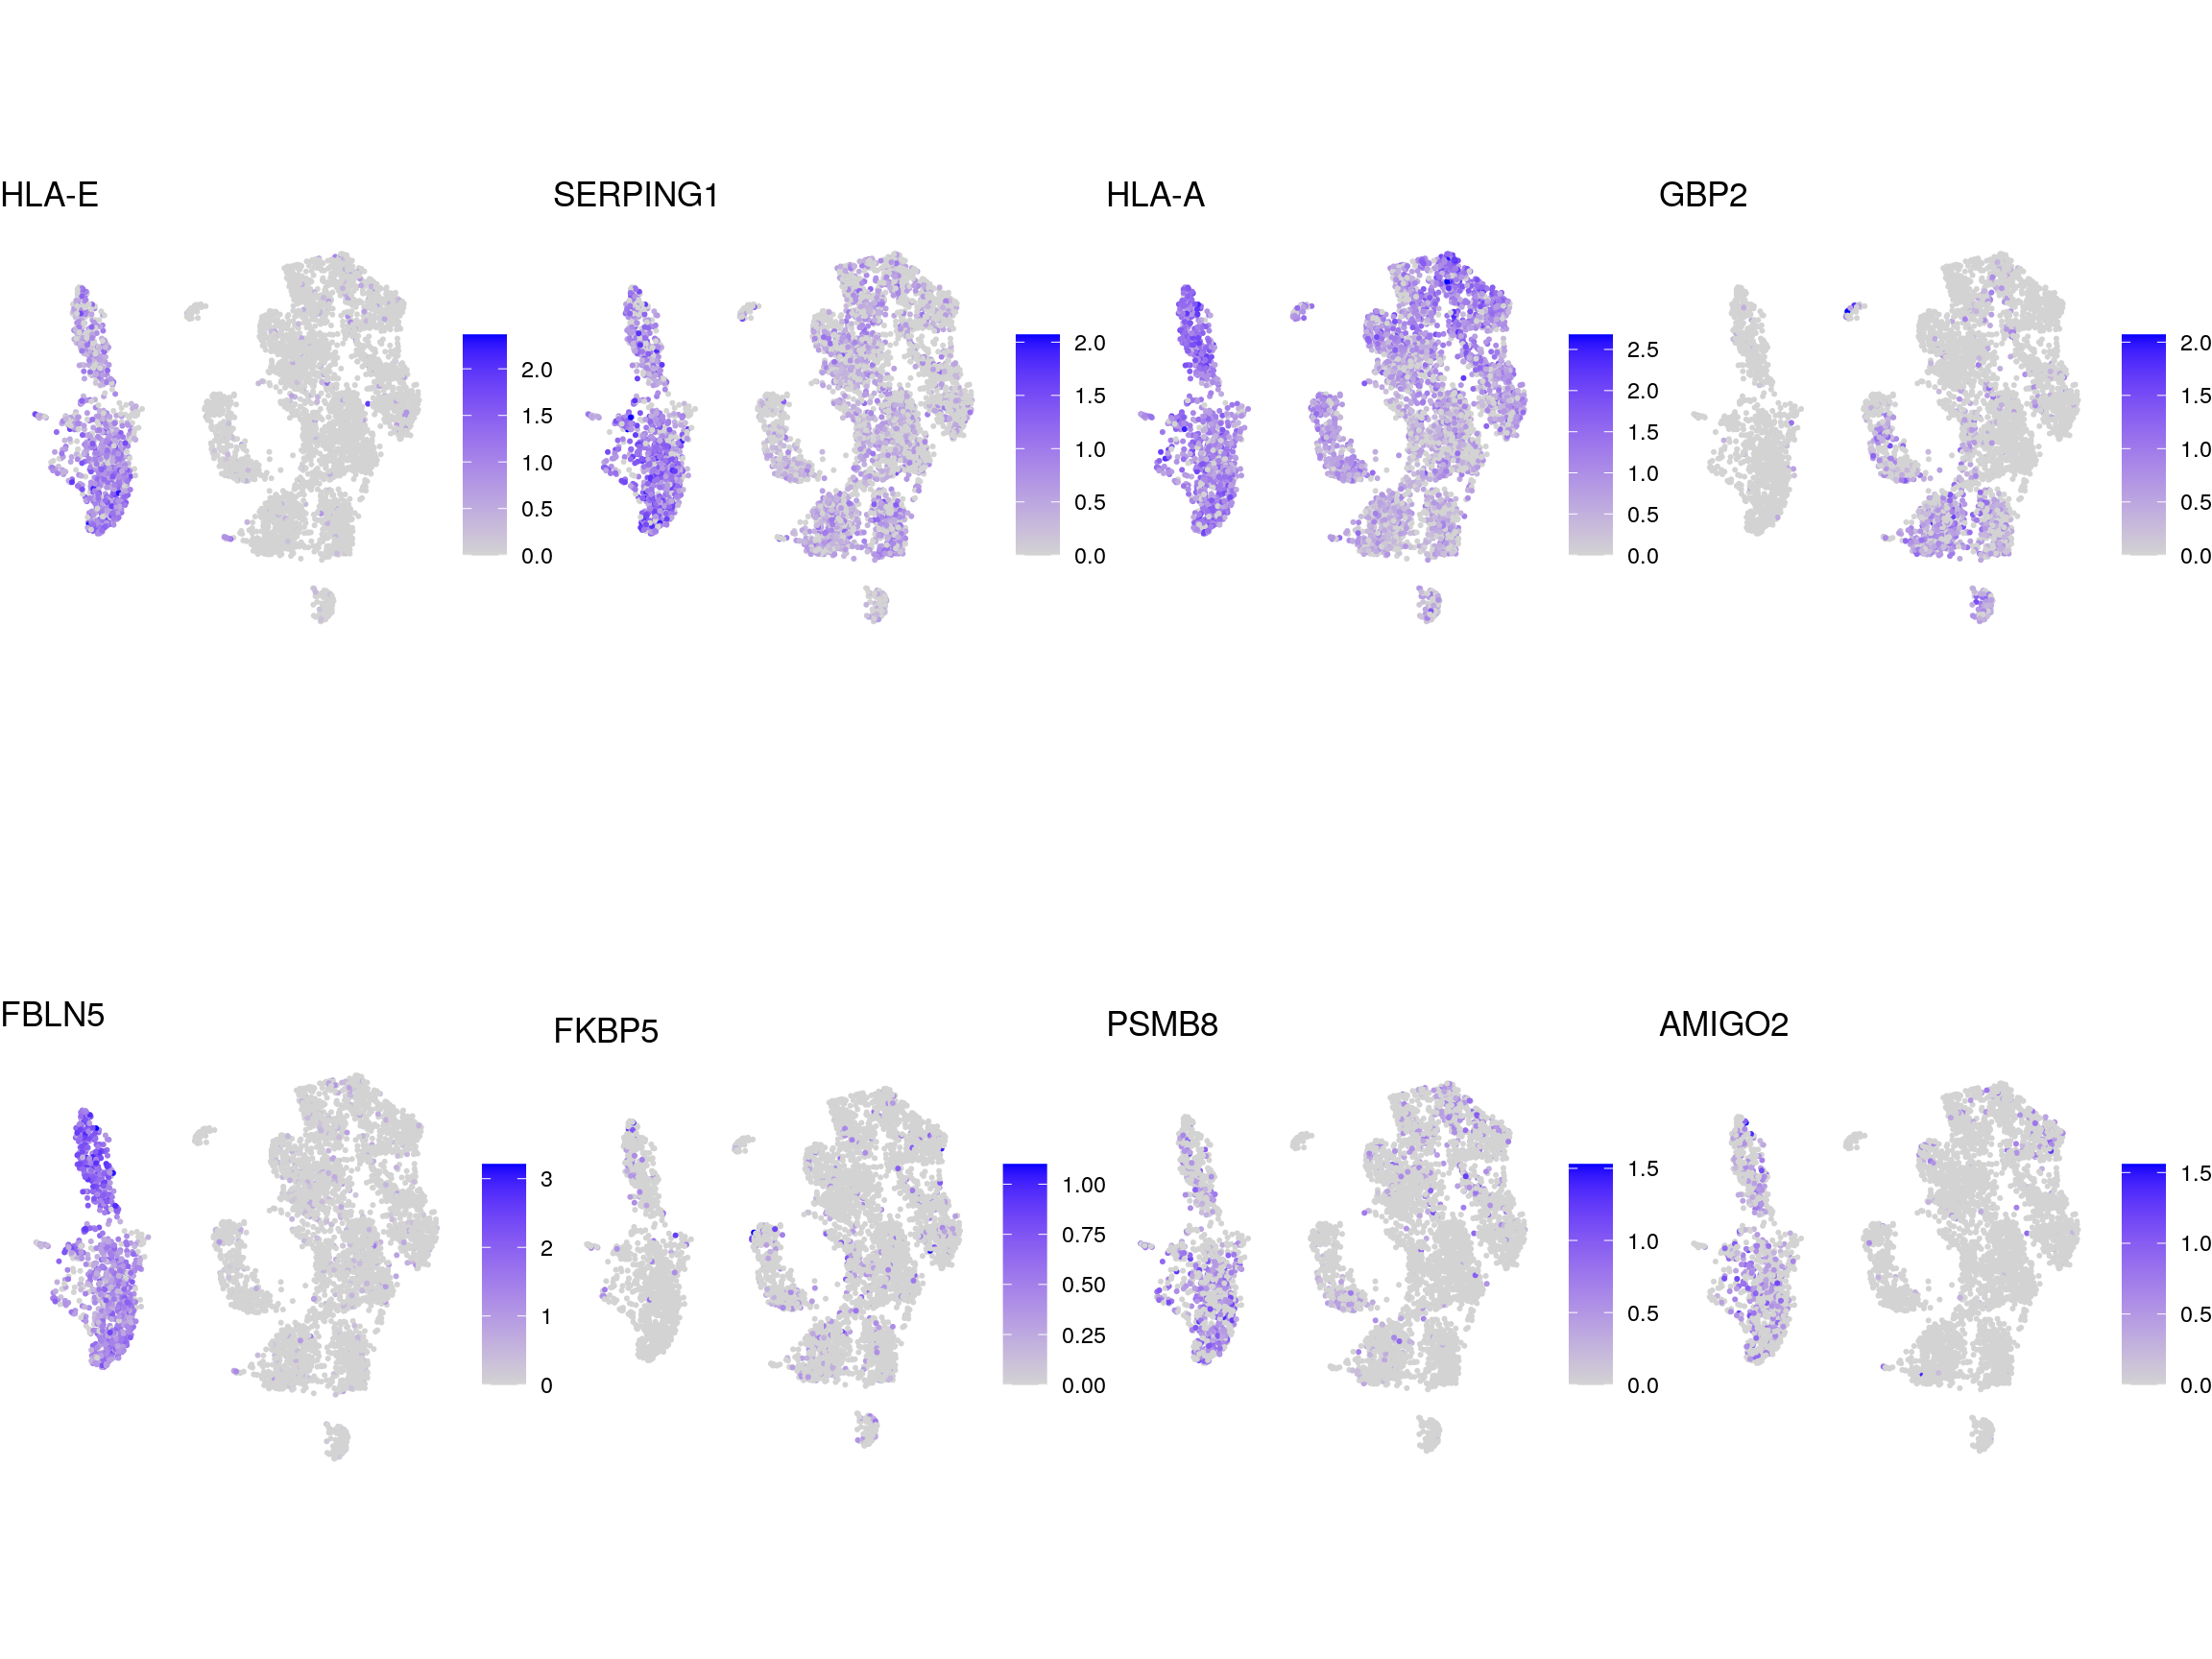
A2
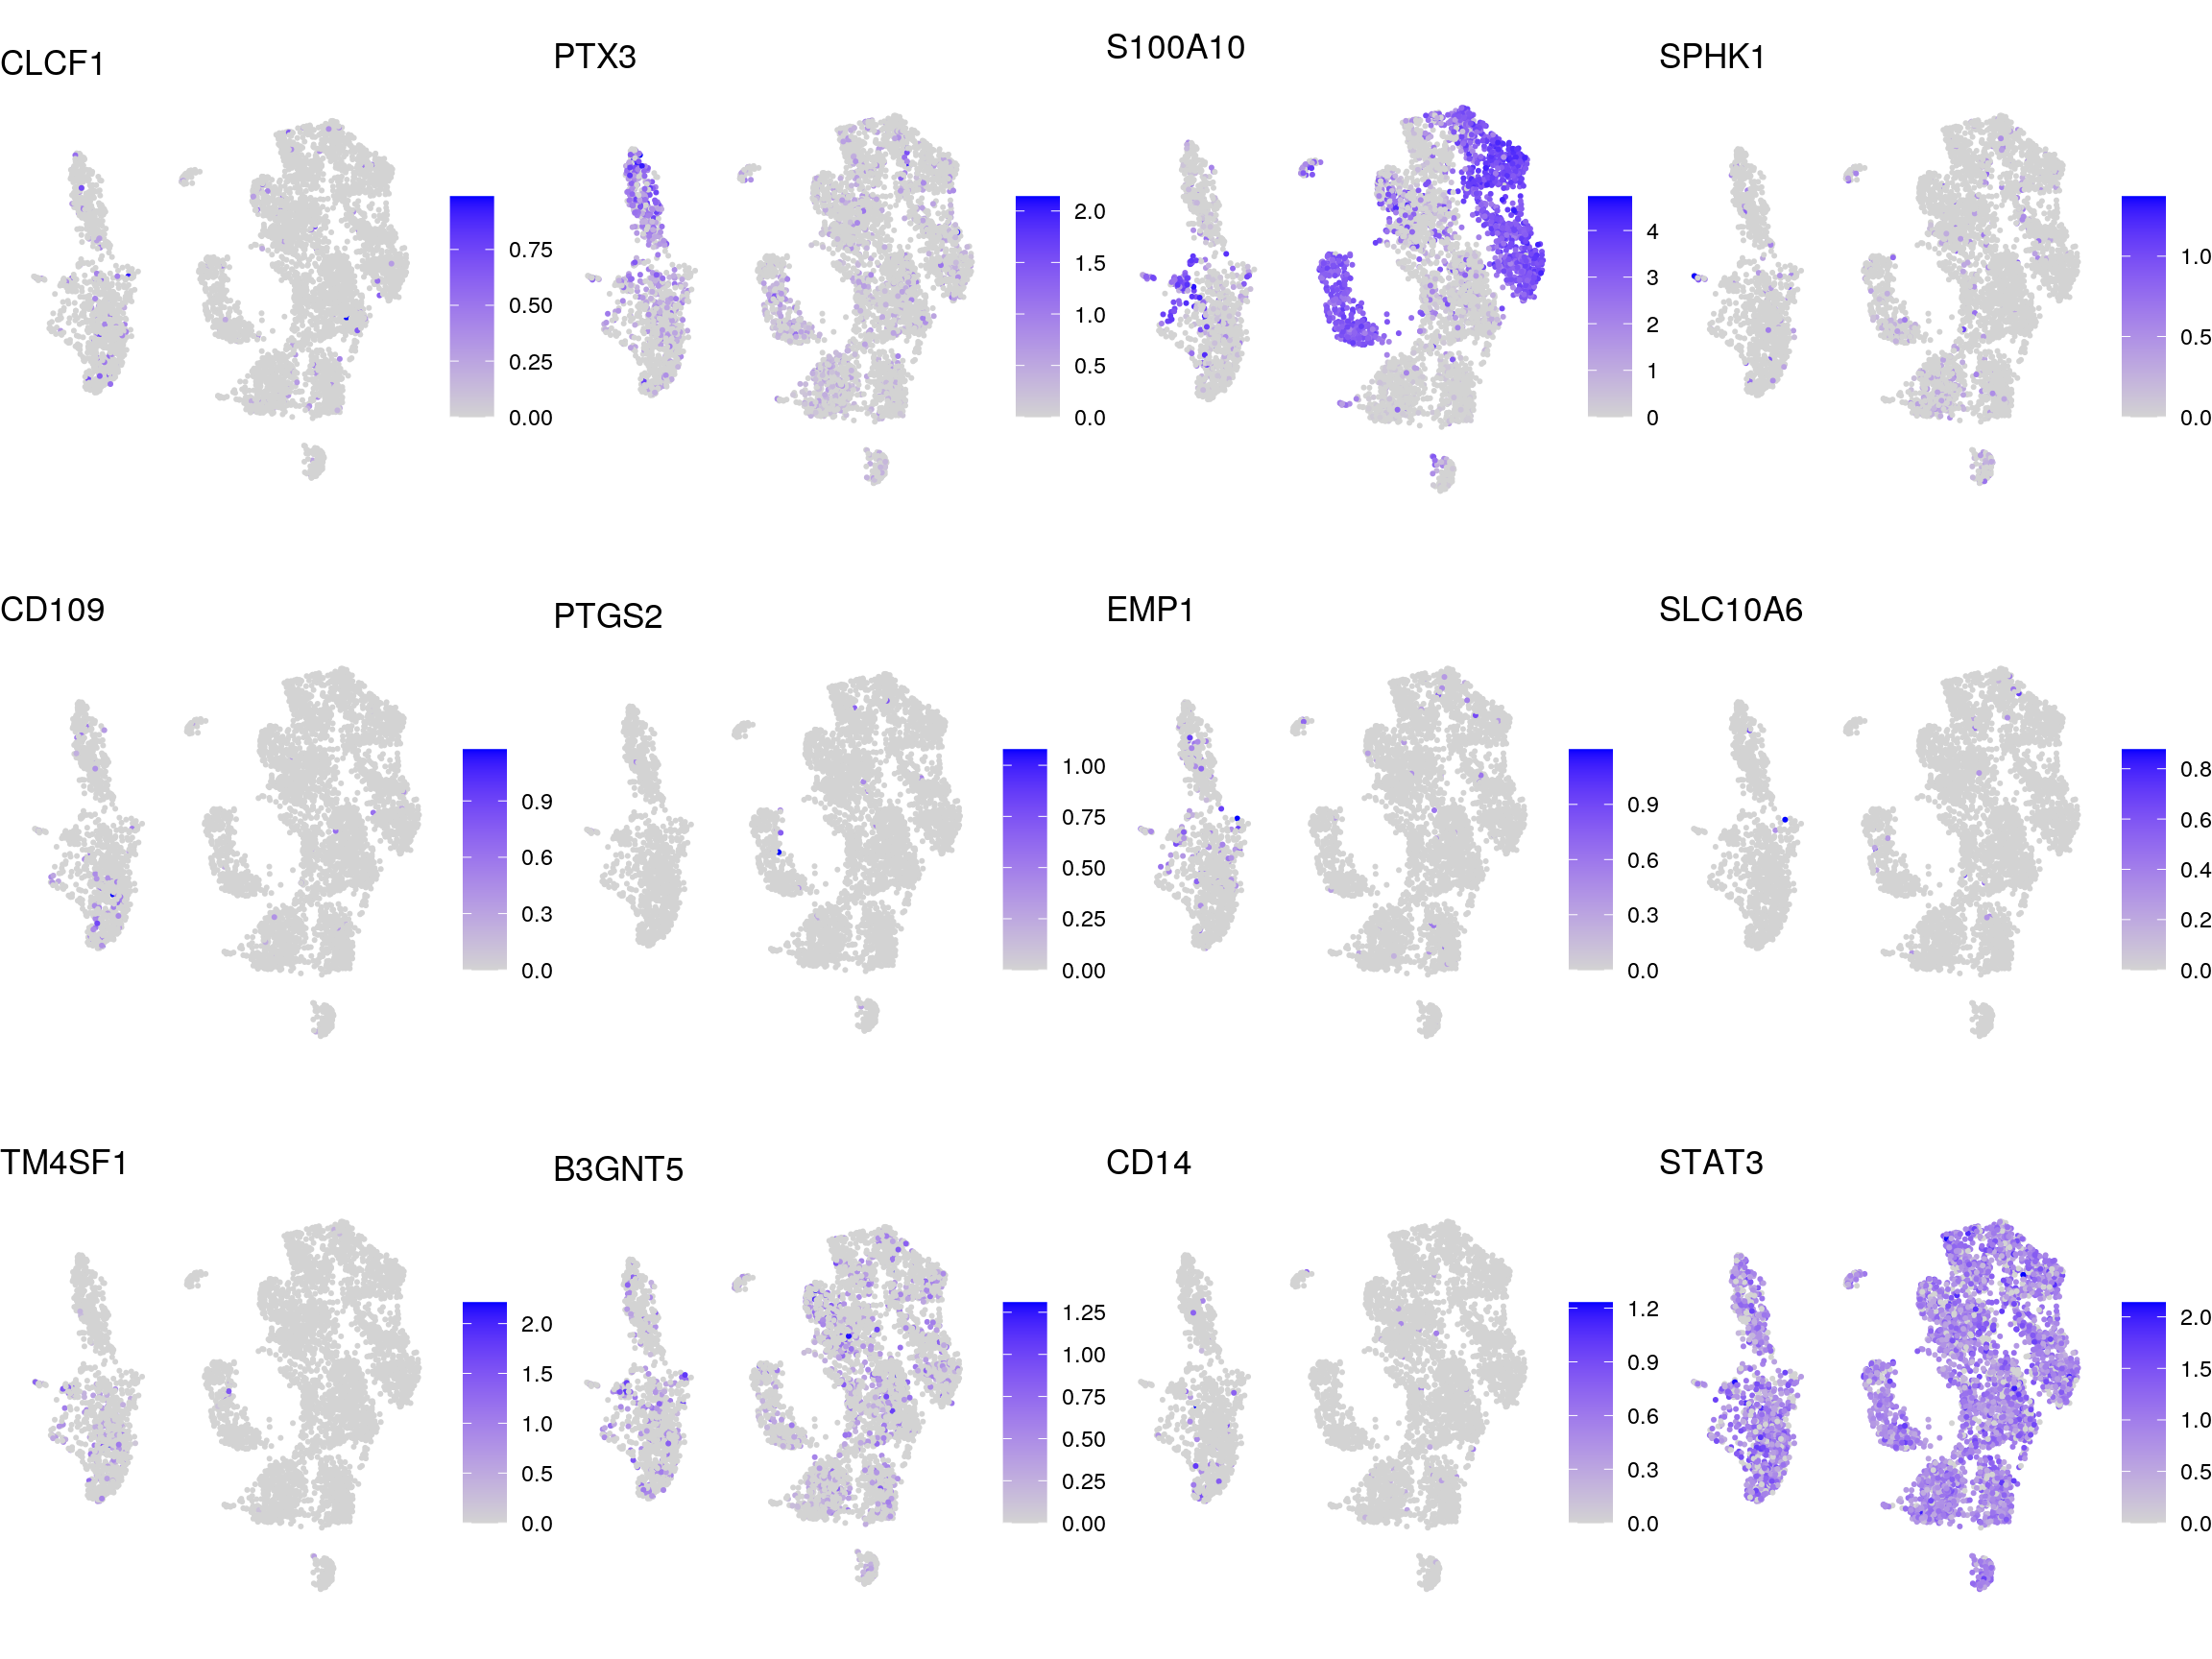
senescence_down
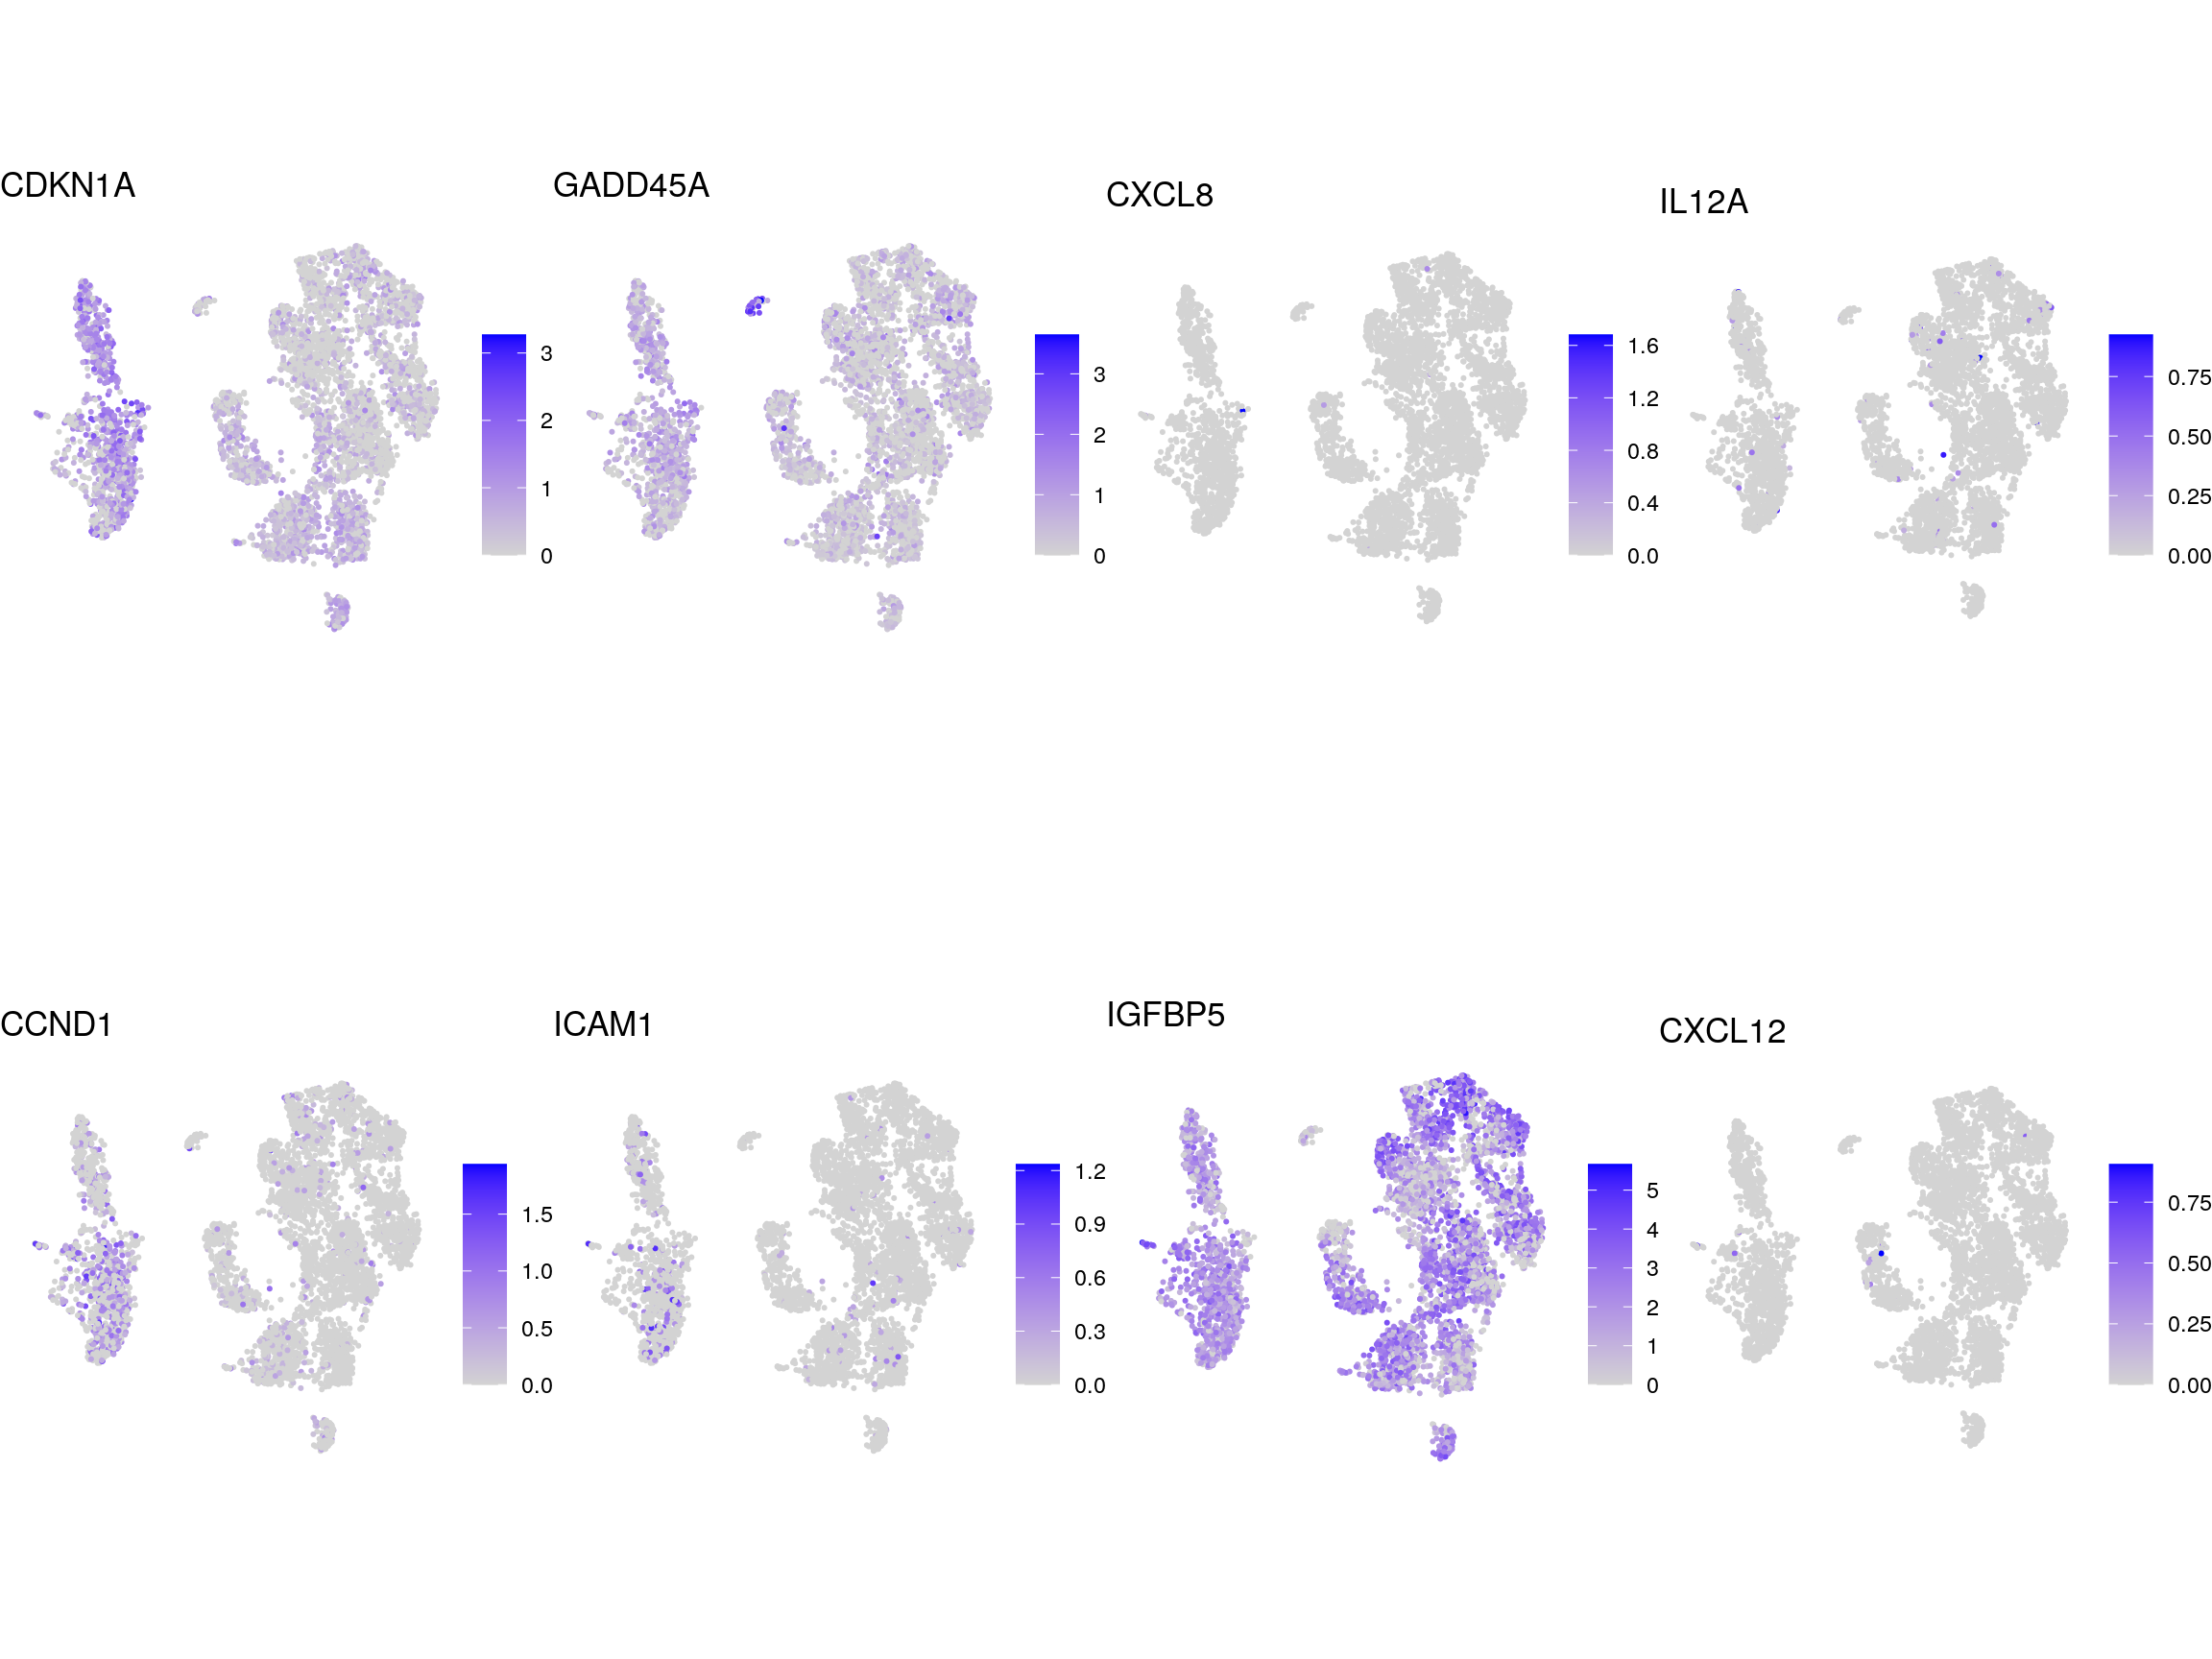
Marker genes for virus cell tropism
## source file with list of known marker genes
source(file.path("data", "virus_cell_tropism_markers.R"))
fs <- lapply(fs, sapply, function(g)
    grep(pattern = paste0("\\.", g, "$"), rownames(sce), value = TRUE)
  )

fs <- lapply(fs, function(x) unlist(x[lengths(x) !=0]) )

gs <- gsub(".*\\.", "", unlist(fs))
ns <- vapply(fs, length, numeric(1))
ks <- rep.int(names(fs), ns)
labs <- lapply(fs, function(x) gsub(".*\\.", "",x))
Heatmap of virus cell tropism markers
# compute cluster-marker means
ms_by_cluster <- lapply(fs, function(gs) vapply(cs_by_k, function(i)
        Matrix::rowMeans(logcounts(sce)[gs, i, drop = FALSE]),
        numeric(length(gs))))
# prep. for plotting & scale b/w 0 and 1
mat <- do.call("rbind", ms_by_cluster)
mat <- muscat:::.scale(mat)
rownames(mat) <- gs
cols <- muscat:::.cluster_colors[seq_along(fs)]
cols <- setNames(cols, names(fs))
row_anno <- rowAnnotation(
    df = data.frame(label = factor(ks, levels = names(fs))),
    col = list(label = cols), gp = gpar(col = "white"))
# percentage of cells from each of the samples per cluster
sample_props <- prop.table(n_cells, margin = 1)
col_mat <- as.matrix(unclass(sample_props))
sample_cols <- c("#882255", "#11588A",  "#117733", "#44AA99")
sample_cols <- setNames(sample_cols, colnames(col_mat))
col_anno <- HeatmapAnnotation(
    perc_sample = anno_barplot(col_mat, gp = gpar(fill = sample_cols),
                               height = unit(2, "cm"),
                               border = FALSE),
    annotation_label = "fraction of sample\nin cluster",
    gap = unit(10, "points"))
col_lgd <- Legend(labels = names(sample_cols),
       title = "sample",
       legend_gp = gpar(fill = sample_cols))

hm <- Heatmap(mat,
    name = "scaled avg.\nexpression",
    col = viridis(10),
    cluster_rows = FALSE,
    cluster_columns = FALSE,
    row_names_side = "left",
    column_title = "cluster_id",
    column_title_side = "bottom",
    column_names_side = "bottom",
    column_names_rot = 0,
    column_names_centered = TRUE,
    rect_gp = gpar(col = "white"),
    left_annotation = row_anno,
    top_annotation = col_anno)
draw(hm, annotation_legend_list = list(col_lgd))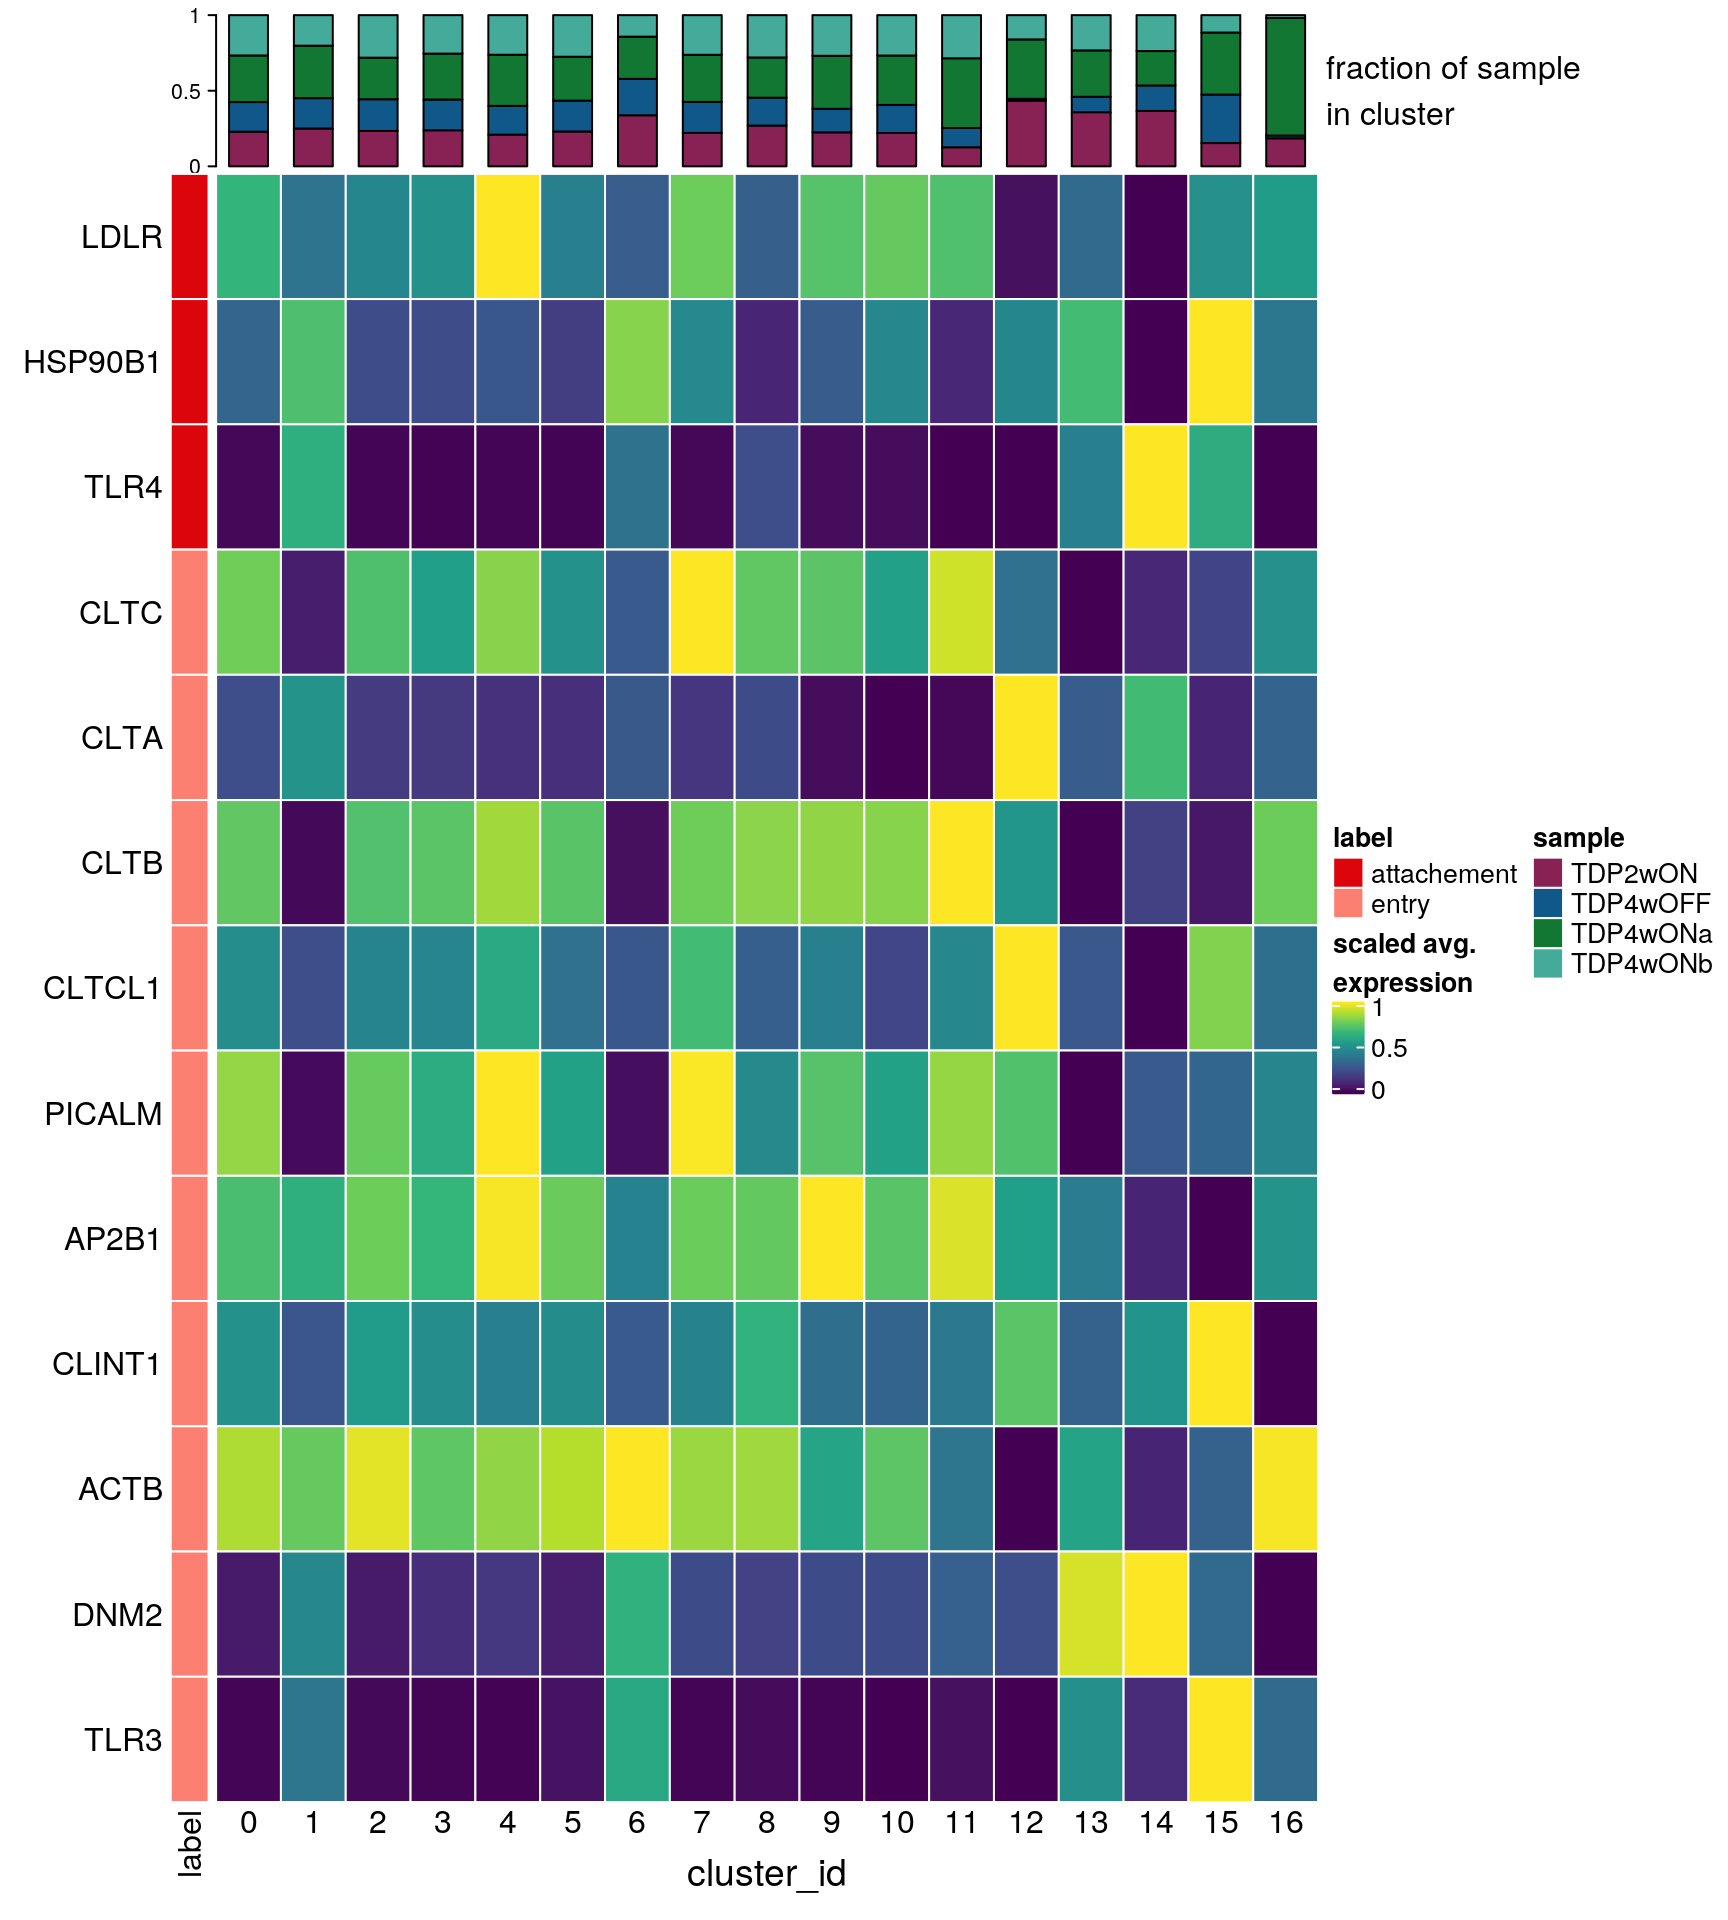
Save cluster markers to RDS
saveRDS(scran_markers, file.path("output", "TDP-06_scran_markers.rds"))
saveRDS(so, file.path("output", "so_TDP-06-cluster-analysis.rds"))
sessionInfo()R version 4.0.5 (2021-03-31)
Platform: x86_64-pc-linux-gnu (64-bit)
Running under: Ubuntu 18.04.5 LTS
Matrix products: default
BLAS: /usr/local/R/R-4.0.5/lib/libRblas.so
LAPACK: /usr/local/R/R-4.0.5/lib/libRlapack.so
locale:
[1] LC_CTYPE=en_US.UTF-8 LC_NUMERIC=C
[3] LC_TIME=en_US.UTF-8 LC_COLLATE=en_US.UTF-8
[5] LC_MONETARY=en_US.UTF-8 LC_MESSAGES=en_US.UTF-8
[7] LC_PAPER=en_US.UTF-8 LC_NAME=C
[9] LC_ADDRESS=C LC_TELEPHONE=C
[11] LC_MEASUREMENT=en_US.UTF-8 LC_IDENTIFICATION=C
attached base packages:
[1] parallel stats4 grid stats graphics grDevices utils
[8] datasets methods base
other attached packages:
[1] BiocParallel_1.22.0 RCurl_1.98-1.3
[3] stringr_1.4.0 SeuratObject_4.0.1
[5] Seurat_4.0.1 scran_1.16.0
[7] SingleCellExperiment_1.10.1 SummarizedExperiment_1.18.1
[9] DelayedArray_0.14.0 matrixStats_0.56.0
[11] Biobase_2.48.0 GenomicRanges_1.40.0
[13] GenomeInfoDb_1.24.2 IRanges_2.22.2
[15] S4Vectors_0.26.1 BiocGenerics_0.34.0
[17] viridis_0.5.1 viridisLite_0.3.0
[19] RColorBrewer_1.1-2 purrr_0.3.4
[21] muscat_1.2.1 dplyr_1.0.2
[23] ggplot2_3.3.2 cowplot_1.0.0
[25] ComplexHeatmap_2.4.2 workflowr_1.6.2
loaded via a namespace (and not attached):
[1] reticulate_1.16 tidyselect_1.1.0
[3] lme4_1.1-23 RSQLite_2.2.0
[5] AnnotationDbi_1.50.1 htmlwidgets_1.5.1
[7] Rtsne_0.15 munsell_0.5.0
[9] codetools_0.2-16 ica_1.0-2
[11] statmod_1.4.34 future_1.17.0
[13] miniUI_0.1.1.1 withr_2.4.1
[15] colorspace_1.4-1 knitr_1.29
[17] ROCR_1.0-11 tensor_1.5
[19] listenv_0.8.0 labeling_0.3
[21] git2r_0.27.1 GenomeInfoDbData_1.2.3
[23] polyclip_1.10-0 farver_2.0.3
[25] bit64_0.9-7 glmmTMB_1.0.2.1
[27] rprojroot_1.3-2 vctrs_0.3.4
[29] generics_0.0.2 xfun_0.15
[31] R6_2.4.1 doParallel_1.0.15
[33] ggbeeswarm_0.6.0 clue_0.3-57
[35] rsvd_1.0.3 locfit_1.5-9.4
[37] spatstat.utils_2.1-0 bitops_1.0-6
[39] cachem_1.0.4 promises_1.1.1
[41] scales_1.1.1 beeswarm_0.2.3
[43] gtable_0.3.0 globals_0.12.5
[45] goftest_1.2-2 rlang_0.4.10
[47] genefilter_1.70.0 GlobalOptions_0.1.2
[49] splines_4.0.5 TMB_1.7.16
[51] lazyeval_0.2.2 spatstat.geom_2.1-0
[53] abind_1.4-5 yaml_2.2.1
[55] reshape2_1.4.4 backports_1.1.9
[57] httpuv_1.5.4 tools_4.0.5
[59] spatstat.core_2.1-2 ellipsis_0.3.1
[61] gplots_3.0.4 ggridges_0.5.2
[63] Rcpp_1.0.5 plyr_1.8.6
[65] progress_1.2.2 zlibbioc_1.34.0
[67] prettyunits_1.1.1 rpart_4.1-15
[69] deldir_0.2-10 pbapply_1.4-2
[71] GetoptLong_1.0.1 zoo_1.8-8
[73] ggrepel_0.8.2 cluster_2.1.0
[75] colorRamps_2.3 fs_1.5.0
[77] variancePartition_1.18.2 magrittr_1.5
[79] data.table_1.12.8 scattermore_0.7
[81] lmerTest_3.1-2 circlize_0.4.10
[83] lmtest_0.9-37 RANN_2.6.1
[85] whisker_0.4 fitdistrplus_1.1-1
[87] hms_0.5.3 patchwork_1.0.1
[89] mime_0.9 evaluate_0.14
[91] xtable_1.8-4 pbkrtest_0.4-8.6
[93] XML_3.99-0.4 gridExtra_2.3
[95] shape_1.4.4 compiler_4.0.5
[97] scater_1.16.2 tibble_3.0.3
[99] KernSmooth_2.23-17 crayon_1.3.4
[101] minqa_1.2.4 htmltools_0.5.0
[103] mgcv_1.8-31 later_1.1.0.1
[105] tidyr_1.1.0 geneplotter_1.66.0
[107] DBI_1.1.0 MASS_7.3-51.6
[109] rappdirs_0.3.1 boot_1.3-25
[111] Matrix_1.3-3 gdata_2.18.0
[113] igraph_1.2.5 pkgconfig_2.0.3
[115] numDeriv_2016.8-1.1 spatstat.sparse_2.0-0
[117] plotly_4.9.2.1 foreach_1.5.0
[119] annotate_1.66.0 vipor_0.4.5
[121] dqrng_0.2.1 blme_1.0-4
[123] XVector_0.28.0 digest_0.6.25
[125] sctransform_0.3.2 RcppAnnoy_0.0.18
[127] spatstat.data_2.1-0 rmarkdown_2.3
[129] leiden_0.3.3 uwot_0.1.10
[131] edgeR_3.30.3 DelayedMatrixStats_1.10.1
[133] shiny_1.5.0 gtools_3.8.2
[135] rjson_0.2.20 nloptr_1.2.2.2
[137] lifecycle_1.0.0 nlme_3.1-148
[139] jsonlite_1.7.2 BiocNeighbors_1.6.0
[141] limma_3.44.3 pillar_1.4.6
[143] lattice_0.20-41 fastmap_1.0.1
[145] httr_1.4.2 survival_3.2-3
[147] glue_1.4.2 png_0.1-7
[149] iterators_1.0.12 bit_1.1-15.2
[151] stringi_1.4.6 blob_1.2.1
[153] DESeq2_1.28.1 BiocSingular_1.4.0
[155] caTools_1.18.0 memoise_2.0.0
[157] irlba_2.3.3 future.apply_1.6.0