Annotation of cell identity after Lam et al. NSC integration
Katharina Hembach
7/6/2020
Last updated: 2021-08-30
Checks: 7 0
Knit directory: neural_scRNAseq/
This reproducible R Markdown analysis was created with workflowr (version 1.6.2). The Checks tab describes the reproducibility checks that were applied when the results were created. The Past versions tab lists the development history.
Great! Since the R Markdown file has been committed to the Git repository, you know the exact version of the code that produced these results.
Great job! The global environment was empty. Objects defined in the global environment can affect the analysis in your R Markdown file in unknown ways. For reproduciblity it's best to always run the code in an empty environment.
The command set.seed(20200522) was run prior to running the code in the R Markdown file. Setting a seed ensures that any results that rely on randomness, e.g. subsampling or permutations, are reproducible.
Great job! Recording the operating system, R version, and package versions is critical for reproducibility.
Nice! There were no cached chunks for this analysis, so you can be confident that you successfully produced the results during this run.
Great job! Using relative paths to the files within your workflowr project makes it easier to run your code on other machines.
Great! You are using Git for version control. Tracking code development and connecting the code version to the results is critical for reproducibility.
The results in this page were generated with repository version f3e4c6b. See the Past versions tab to see a history of the changes made to the R Markdown and HTML files.
Note that you need to be careful to ensure that all relevant files for the analysis have been committed to Git prior to generating the results (you can use wflow_publish or wflow_git_commit). workflowr only checks the R Markdown file, but you know if there are other scripts or data files that it depends on. Below is the status of the Git repository when the results were generated:
Ignored files:
    Ignored:    .DS_Store
    Ignored:    .Rhistory
    Ignored:    .Rproj.user/
    Ignored:    ._.DS_Store
    Ignored:    ._Filtered.pdf
    Ignored:    ._Rplots.pdf
    Ignored:    ._Unfiltered.pdf
    Ignored:    .__workflowr.yml
    Ignored:    ._cms_PCA10_k1000_k_min200.pdf
    Ignored:    ._cms_PCA10_k500.pdf
    Ignored:    ._cms_PCA10_k700_batch_min100.pdf
    Ignored:    ._cms_PCA10_k700_batch_min50.pdf
    Ignored:    ._cms_PCA10_k_min100.pdf
    Ignored:    ._cms_PCA10_k_min200.pdf
    Ignored:    ._cms_PCA_10_k700.pdf
    Ignored:    ._cms_umap_PCA.pdf
    Ignored:    ._coverage.pdf
    Ignored:    ._coverage_sashimi.pdf
    Ignored:    ._coverage_sashimi.png
    Ignored:    ._iCLIP_nrXLs_markers.pdf
    Ignored:    ._neural_scRNAseq.Rproj
    Ignored:    ._pbDS_cell_level.pdf
    Ignored:    ._pbDS_top_expr_umap.pdf
    Ignored:    ._pbDS_upset.pdf
    Ignored:    ._sashimi.pdf
    Ignored:    ._stmn2.pdf
    Ignored:    ._tdp.pdf
    Ignored:    analysis/.DS_Store
    Ignored:    analysis/.Rhistory
    Ignored:    analysis/._.DS_Store
    Ignored:    analysis/._01-preprocessing.Rmd
    Ignored:    analysis/._01-preprocessing.html
    Ignored:    analysis/._02.1-SampleQC.Rmd
    Ignored:    analysis/._03-filtering.Rmd
    Ignored:    analysis/._04-clustering.Rmd
    Ignored:    analysis/._04-clustering.knit.md
    Ignored:    analysis/._04.1-cell_cycle.Rmd
    Ignored:    analysis/._05-annotation.Rmd
    Ignored:    analysis/._07-cluster-analysis-all-timepoints.Rmd
    Ignored:    analysis/._Lam-0-NSC_no_integration.Rmd
    Ignored:    analysis/._Lam-01-NSC_integration.Rmd
    Ignored:    analysis/._Lam-02-NSC_annotation.Rmd
    Ignored:    analysis/._NSC-1-clustering.Rmd
    Ignored:    analysis/._NSC-2-annotation.Rmd
    Ignored:    analysis/._TDP-06-cluster_analysis.Rmd
    Ignored:    analysis/.__site.yml
    Ignored:    analysis/._additional_filtering.Rmd
    Ignored:    analysis/._additional_filtering_clustering.Rmd
    Ignored:    analysis/._index.Rmd
    Ignored:    analysis/._organoid-01-1-qualtiy-control.Rmd
    Ignored:    analysis/._organoid-01-clustering.Rmd
    Ignored:    analysis/._organoid-02-integration.Rmd
    Ignored:    analysis/._organoid-03-cluster_analysis.Rmd
    Ignored:    analysis/._organoid-04-group_integration.Rmd
    Ignored:    analysis/._organoid-04-stage_integration.Rmd
    Ignored:    analysis/._organoid-05-group_integration_cluster_analysis.Rmd
    Ignored:    analysis/._organoid-05-stage_integration_cluster_analysis.Rmd
    Ignored:    analysis/._organoid-06-1-prepare-sce.Rmd
    Ignored:    analysis/._organoid-06-conos-analysis-Seurat.Rmd
    Ignored:    analysis/._organoid-06-conos-analysis-function.Rmd
    Ignored:    analysis/._organoid-06-conos-analysis.Rmd
    Ignored:    analysis/._organoid-06-group-integration-conos-analysis.Rmd
    Ignored:    analysis/._organoid-07-conos-visualization.Rmd
    Ignored:    analysis/._organoid-07-group-integration-conos-visualization.Rmd
    Ignored:    analysis/._organoid-08-conos-comparison.Rmd
    Ignored:    analysis/._organoid-0x-sample_integration.Rmd
    Ignored:    analysis/01-preprocessing_cache/
    Ignored:    analysis/02-1-SampleQC_cache/
    Ignored:    analysis/02-quality_control_cache/
    Ignored:    analysis/02.1-SampleQC_cache/
    Ignored:    analysis/03-filtering_cache/
    Ignored:    analysis/04-clustering_cache/
    Ignored:    analysis/04.1-cell_cycle_cache/
    Ignored:    analysis/05-annotation_cache/
    Ignored:    analysis/06-clustering-all-timepoints_cache/
    Ignored:    analysis/07-cluster-analysis-all-timepoints_cache/
    Ignored:    analysis/CH-test-01-preprocessing_cache/
    Ignored:    analysis/CH-test-02-transgene-expression_cache/
    Ignored:    analysis/CH-test-03-cluster-analysis_cache/
    Ignored:    analysis/Lam-01-NSC_integration_cache/
    Ignored:    analysis/NSC-1-clustering_cache/
    Ignored:    analysis/NSC-2-annotation_cache/
    Ignored:    analysis/TDP-01-preprocessing_cache/
    Ignored:    analysis/TDP-02-quality_control_cache/
    Ignored:    analysis/TDP-03-filtering_cache/
    Ignored:    analysis/TDP-04-clustering_cache/
    Ignored:    analysis/TDP-05-00-filtering-plasmid-QC_cache/
    Ignored:    analysis/TDP-05-plasmid_expression_cache/
    Ignored:    analysis/TDP-06-01-totalTDP-construct-quantification_cache/
    Ignored:    analysis/TDP-06-cluster_analysis_cache/
    Ignored:    analysis/TDP-07-01-STMN2_expression_cache/
    Ignored:    analysis/TDP-07-02-Prudencio_marker_expression_cache/
    Ignored:    analysis/TDP-07-03-Liu_sorted_nuclei_marker_expression_cache/
    Ignored:    analysis/TDP-07-04-Tollervey_marker_binding_cache/
    Ignored:    analysis/TDP-07-05-marker_gene_read_coverage_cache/
    Ignored:    analysis/TDP-07-cluster_12_cache/
    Ignored:    analysis/TDP-08-00-clustering-HA-D96_cache/
    Ignored:    analysis/TDP-08-01-HA-D96-expression-changes_cache/
    Ignored:    analysis/TDP-08-02-TDP_target_genes_cache/
    Ignored:    analysis/TDP-08-clustering-timeline-HA_cache/
    Ignored:    analysis/additional_filtering_cache/
    Ignored:    analysis/additional_filtering_clustering_cache/
    Ignored:    analysis/organoid-01-1-qualtiy-control_cache/
    Ignored:    analysis/organoid-01-clustering_cache/
    Ignored:    analysis/organoid-02-integration_cache/
    Ignored:    analysis/organoid-03-cluster_analysis_cache/
    Ignored:    analysis/organoid-04-group_integration_cache/
    Ignored:    analysis/organoid-04-stage_integration_cache/
    Ignored:    analysis/organoid-05-group_integration_cluster_analysis_cache/
    Ignored:    analysis/organoid-05-stage_integration_cluster_analysis_cache/
    Ignored:    analysis/organoid-06-conos-analysis_cache/
    Ignored:    analysis/organoid-06-conos-analysis_test_cache/
    Ignored:    analysis/organoid-06-group-integration-conos-analysis_cache/
    Ignored:    analysis/organoid-07-conos-visualization_cache/
    Ignored:    analysis/organoid-07-group-integration-conos-visualization_cache/
    Ignored:    analysis/organoid-08-conos-comparison_cache/
    Ignored:    analysis/organoid-0x-sample_integration_cache/
    Ignored:    analysis/sample5_QC_cache/
    Ignored:    analysis/timepoints-01-organoid-integration_cache/
    Ignored:    analysis/timepoints-02-cluster-analysis_cache/
    Ignored:    data/.DS_Store
    Ignored:    data/._.DS_Store
    Ignored:    data/._.smbdeleteAAA17ed8b4b
    Ignored:    data/._Lam_figure2_markers.R
    Ignored:    data/._README.md
    Ignored:    data/._Reactive_astrocytes_markers.xlsx
    Ignored:    data/._known_NSC_markers.R
    Ignored:    data/._known_cell_type_markers.R
    Ignored:    data/._metadata.csv
    Ignored:    data/._virus_cell_tropism_markers.R
    Ignored:    data/._~$Reactive_astrocytes_markers.xlsx
    Ignored:    data/data_sushi/
    Ignored:    data/filtered_feature_matrices/
    Ignored:    output/.DS_Store
    Ignored:    output/._.DS_Store
    Ignored:    output/._Liu_TDP_neg_vs_pos_edgeR_dge_results.txt
    Ignored:    output/._NSC_cluster2_marker_genes.txt
    Ignored:    output/._TDP-06-no_integration_cluster12_marker_genes.txt
    Ignored:    output/._TDP-06-no_integration_cluster13_marker_genes.txt
    Ignored:    output/._organoid_integration_cluster1_marker_genes.txt
    Ignored:    output/._tbl_TDP-08-01-muscat_cluster_0.txt
    Ignored:    output/._tbl_TDP-08-01-muscat_cluster_1.txt
    Ignored:    output/._tbl_TDP-08-01-muscat_cluster_10.txt
    Ignored:    output/._tbl_TDP-08-01-muscat_cluster_11.txt
    Ignored:    output/._tbl_TDP-08-01-muscat_cluster_12.txt
    Ignored:    output/._tbl_TDP-08-01-muscat_cluster_13.txt
    Ignored:    output/._tbl_TDP-08-01-muscat_cluster_14.txt
    Ignored:    output/._tbl_TDP-08-01-muscat_cluster_5.txt
    Ignored:    output/._tbl_TDP-08-01-muscat_cluster_7.txt
    Ignored:    output/._tbl_TDP-08-01-muscat_cluster_8.txt
    Ignored:    output/._tbl_TDP-08-01-muscat_cluster_all.xlsx
    Ignored:    output/._tbl_TDP-08-02-targets_hek_cluster_0.txt
    Ignored:    output/._tbl_TDP-08-02-targets_hek_cluster_1.txt
    Ignored:    output/._tbl_TDP-08-02-targets_hek_cluster_10.txt
    Ignored:    output/._tbl_TDP-08-02-targets_hek_cluster_11.txt
    Ignored:    output/._tbl_TDP-08-02-targets_hek_cluster_12.txt
    Ignored:    output/._tbl_TDP-08-02-targets_hek_cluster_13.txt
    Ignored:    output/._tbl_TDP-08-02-targets_hek_cluster_14.txt
    Ignored:    output/._tbl_TDP-08-02-targets_hek_cluster_5.txt
    Ignored:    output/._tbl_TDP-08-02-targets_hek_cluster_7.txt
    Ignored:    output/._tbl_TDP-08-02-targets_hek_cluster_8.txt
    Ignored:    output/._tbl_TDP-08-02-targets_hek_cluster_all.xlsx
    Ignored:    output/._~$tbl_TDP-08-02-targets_hek_cluster_all.xlsx
    Ignored:    output/CH-test-01-preprocessing.rds
    Ignored:    output/CH-test-01-preprocessing_singlets.rds
    Ignored:    output/CH-test-01-preprocessing_singlets_filtered.rds
    Ignored:    output/CH-test-01-preprocessing_so.rds
    Ignored:    output/CH-test-01-preprocessing_so_filtered.rds
    Ignored:    output/CH-test-03-cluster-analysis_so.rds
    Ignored:    output/CH-test-03_scran_markers.rds
    Ignored:    output/Lam-01-clustering.rds
    Ignored:    output/Liu_TDP_neg_vs_pos_edgeR_dge.rds
    Ignored:    output/Liu_TDP_neg_vs_pos_edgeR_dge_results.txt
    Ignored:    output/NSC_1_clustering.rds
    Ignored:    output/NSC_cluster1_marker_genes.txt
    Ignored:    output/NSC_cluster2_marker_genes.txt
    Ignored:    output/NSC_cluster3_marker_genes.txt
    Ignored:    output/NSC_cluster4_marker_genes.txt
    Ignored:    output/NSC_cluster5_marker_genes.txt
    Ignored:    output/NSC_cluster6_marker_genes.txt
    Ignored:    output/NSC_cluster7_marker_genes.txt
    Ignored:    output/TDP-06-no_integration_cluster0_marker_genes.txt
    Ignored:    output/TDP-06-no_integration_cluster10_marker_genes.txt
    Ignored:    output/TDP-06-no_integration_cluster11_marker_genes.txt
    Ignored:    output/TDP-06-no_integration_cluster12_marker_genes.txt
    Ignored:    output/TDP-06-no_integration_cluster13_marker_genes.txt
    Ignored:    output/TDP-06-no_integration_cluster14_marker_genes.txt
    Ignored:    output/TDP-06-no_integration_cluster15_marker_genes.txt
    Ignored:    output/TDP-06-no_integration_cluster16_marker_genes.txt
    Ignored:    output/TDP-06-no_integration_cluster17_marker_genes.txt
    Ignored:    output/TDP-06-no_integration_cluster1_marker_genes.txt
    Ignored:    output/TDP-06-no_integration_cluster2_marker_genes.txt
    Ignored:    output/TDP-06-no_integration_cluster3_marker_genes.txt
    Ignored:    output/TDP-06-no_integration_cluster4_marker_genes.txt
    Ignored:    output/TDP-06-no_integration_cluster5_marker_genes.txt
    Ignored:    output/TDP-06-no_integration_cluster6_marker_genes.txt
    Ignored:    output/TDP-06-no_integration_cluster7_marker_genes.txt
    Ignored:    output/TDP-06-no_integration_cluster8_marker_genes.txt
    Ignored:    output/TDP-06-no_integration_cluster9_marker_genes.txt
    Ignored:    output/TDP-06_scran_markers.rds
    Ignored:    output/additional_filtering.rds
    Ignored:    output/conos/
    Ignored:    output/conos_organoid-06-conos-analysis.rds
    Ignored:    output/conos_organoid-06-group-integration-conos-analysis.rds
    Ignored:    output/figures/
    Ignored:    output/organoid_integration_cluster10_marker_genes.txt
    Ignored:    output/organoid_integration_cluster11_marker_genes.txt
    Ignored:    output/organoid_integration_cluster12_marker_genes.txt
    Ignored:    output/organoid_integration_cluster13_marker_genes.txt
    Ignored:    output/organoid_integration_cluster14_marker_genes.txt
    Ignored:    output/organoid_integration_cluster15_marker_genes.txt
    Ignored:    output/organoid_integration_cluster16_marker_genes.txt
    Ignored:    output/organoid_integration_cluster17_marker_genes.txt
    Ignored:    output/organoid_integration_cluster1_marker_genes.txt
    Ignored:    output/organoid_integration_cluster2_marker_genes.txt
    Ignored:    output/organoid_integration_cluster3_marker_genes.txt
    Ignored:    output/organoid_integration_cluster4_marker_genes.txt
    Ignored:    output/organoid_integration_cluster5_marker_genes.txt
    Ignored:    output/organoid_integration_cluster6_marker_genes.txt
    Ignored:    output/organoid_integration_cluster7_marker_genes.txt
    Ignored:    output/organoid_integration_cluster8_marker_genes.txt
    Ignored:    output/organoid_integration_cluster9_marker_genes.txt
    Ignored:    output/paper_supplement/
    Ignored:    output/res_TDP-08-01-muscat.rds
    Ignored:    output/sce_01_preprocessing.rds
    Ignored:    output/sce_02_quality_control.rds
    Ignored:    output/sce_03_filtering.rds
    Ignored:    output/sce_03_filtering_all_genes.rds
    Ignored:    output/sce_06-1-prepare-sce.rds
    Ignored:    output/sce_TDP-06-01-totalTDP-construct-quantification.rds
    Ignored:    output/sce_TDP-08-01-muscat.rds
    Ignored:    output/sce_TDP_01_preprocessing.rds
    Ignored:    output/sce_TDP_02_quality_control.rds
    Ignored:    output/sce_TDP_03_filtering.rds
    Ignored:    output/sce_TDP_03_filtering_all_genes.rds
    Ignored:    output/sce_organoid-01-clustering.rds
    Ignored:    output/sce_preprocessing.rds
    Ignored:    output/so_04-stage_integration.rds
    Ignored:    output/so_04_1_cell_cycle.rds
    Ignored:    output/so_04_clustering.rds
    Ignored:    output/so_06-clustering_all_timepoints.rds
    Ignored:    output/so_08-00_clustering_HA_D96.rds
    Ignored:    output/so_08-clustering_timeline_HA.rds
    Ignored:    output/so_0x-sample_integration.rds
    Ignored:    output/so_CH-test-02-transgene_expression.rds
    Ignored:    output/so_TDP-06-01-totalTDP-construct-quantification.rds
    Ignored:    output/so_TDP-06-cluster-analysis.rds
    Ignored:    output/so_TDP_04_clustering.rds
    Ignored:    output/so_TDP_05_plasmid_expression.rds
    Ignored:    output/so_additional_filtering_clustering.rds
    Ignored:    output/so_integrated_organoid-02-integration.rds
    Ignored:    output/so_merged_organoid-02-integration.rds
    Ignored:    output/so_organoid-01-clustering.rds
    Ignored:    output/so_sample_organoid-01-clustering.rds
    Ignored:    output/so_timepoints-01-organoid_integration.rds
    Ignored:    output/tbl_TDP-08-01-muscat.rds
    Ignored:    output/tbl_TDP-08-01-muscat_cluster_0.txt
    Ignored:    output/tbl_TDP-08-01-muscat_cluster_1.txt
    Ignored:    output/tbl_TDP-08-01-muscat_cluster_10.txt
    Ignored:    output/tbl_TDP-08-01-muscat_cluster_11.txt
    Ignored:    output/tbl_TDP-08-01-muscat_cluster_12.txt
    Ignored:    output/tbl_TDP-08-01-muscat_cluster_13.txt
    Ignored:    output/tbl_TDP-08-01-muscat_cluster_14.txt
    Ignored:    output/tbl_TDP-08-01-muscat_cluster_5.txt
    Ignored:    output/tbl_TDP-08-01-muscat_cluster_7.txt
    Ignored:    output/tbl_TDP-08-01-muscat_cluster_8.txt
    Ignored:    output/tbl_TDP-08-01-muscat_cluster_all.xlsx
    Ignored:    output/tbl_TDP-08-02-targets_hek.rds
    Ignored:    output/tbl_TDP-08-02-targets_hek_cluster_0.txt
    Ignored:    output/tbl_TDP-08-02-targets_hek_cluster_1.txt
    Ignored:    output/tbl_TDP-08-02-targets_hek_cluster_10.txt
    Ignored:    output/tbl_TDP-08-02-targets_hek_cluster_11.txt
    Ignored:    output/tbl_TDP-08-02-targets_hek_cluster_12.txt
    Ignored:    output/tbl_TDP-08-02-targets_hek_cluster_13.txt
    Ignored:    output/tbl_TDP-08-02-targets_hek_cluster_14.txt
    Ignored:    output/tbl_TDP-08-02-targets_hek_cluster_5.txt
    Ignored:    output/tbl_TDP-08-02-targets_hek_cluster_7.txt
    Ignored:    output/tbl_TDP-08-02-targets_hek_cluster_8.txt
    Ignored:    output/tbl_TDP-08-02-targets_hek_cluster_all.xlsx
    Ignored:    output/~$tbl_TDP-08-02-targets_hek_cluster_all.xlsx
    Ignored:    scripts/.DS_Store
    Ignored:    scripts/._.DS_Store
    Ignored:    scripts/._bu_Rcode.R
    Ignored:    scripts/._plasmid_expression.sh
    Ignored:    scripts/._plasmid_expression_cell_hashing_test.sh
    Ignored:    scripts/._plasmid_expression_total_TDP.sh
    Ignored:    scripts/._prepare_salmon_transcripts.R
    Ignored:    scripts/._prepare_salmon_transcripts_cell_hashing_test.R

Untracked files:
    Untracked:  Filtered.pdf
    Untracked:  Hist(sce)
    Untracked:  Rplots.pdf
    Untracked:  Unfiltered
    Untracked:  Unfiltered.pdf
    Untracked:  analysis/.TDP-06-01-totalTDP-construct-quantification.Rmd.swp
    Untracked:  analysis/Lam-0-NSC_no_integration.Rmd
    Untracked:  analysis/TDP-06-01-totalTDP-construct-quantification_bu.Rmd
    Untracked:  analysis/TDP-07-01-STMN2_expression copy.Rmd
    Untracked:  analysis/TDP-07-05-marker_gene_read_coverage.Rmd
    Untracked:  analysis/additional_filtering.Rmd
    Untracked:  analysis/additional_filtering_clustering.Rmd
    Untracked:  analysis/organoid-01-1-qualtiy-control.Rmd
    Untracked:  analysis/organoid-06-conos-analysis-Seurat.Rmd
    Untracked:  analysis/organoid-06-conos-analysis-function.Rmd
    Untracked:  analysis/organoid-07-conos-visualization.Rmd
    Untracked:  analysis/organoid-07-group-integration-conos-visualization.Rmd
    Untracked:  analysis/organoid-08-conos-comparison.Rmd
    Untracked:  analysis/organoid-0x-sample_integration.Rmd
    Untracked:  analysis/sample5_QC.Rmd
    Untracked:  cms_PCA10_k1000_k_min200.pdf
    Untracked:  cms_PCA10_k500.pdf
    Untracked:  cms_PCA10_k700_batch_min100.pdf
    Untracked:  cms_PCA10_k700_batch_min50.pdf
    Untracked:  cms_PCA10_k_min100.pdf
    Untracked:  cms_PCA10_k_min200.pdf
    Untracked:  cms_PCA_10_k700.pdf
    Untracked:  cms_umap_PCA.pdf
    Untracked:  coverage.pdf
    Untracked:  coverage_sashimi.pdf
    Untracked:  coverage_sashimi.png
    Untracked:  data/Homo_sapiens.GRCh38.98.sorted.gtf
    Untracked:  data/Jun2021/
    Untracked:  data/Kanton_et_al/
    Untracked:  data/Lam_et_al/
    Untracked:  data/Liu_et_al/
    Untracked:  data/Prudencio_et_al/
    Untracked:  data/Sep2020/
    Untracked:  data/cell_hashing_test/
    Untracked:  data/reference/
    Untracked:  data/virus_cell_tropism_markers.R
    Untracked:  data/~$Reactive_astrocytes_markers.xlsx
    Untracked:  iCLIP_nrXLs_markers.pdf
    Untracked:  pbDS_cell_level.pdf
    Untracked:  pbDS_heatmap.pdf
    Untracked:  pbDS_top_expr_umap.pdf
    Untracked:  pbDS_upset.pdf
    Untracked:  sashimi.pdf
    Untracked:  scripts/bu_Rcode.R
    Untracked:  scripts/bu_code.Rmd
    Untracked:  scripts/plasmid_expression_cell_hashing_test.sh
    Untracked:  scripts/plasmid_expression_total_TDP.sh
    Untracked:  scripts/prepare_salmon_transcripts_cell_hashing_test.R
    Untracked:  scripts/prepare_salmon_transcripts_total_TDP.R
    Untracked:  scripts/salmon-latest_linux_x86_64/
    Untracked:  stmn2.pdf
    Untracked:  tdp.pdf

Unstaged changes:
    Modified:   analysis/05-annotation.Rmd
    Modified:   analysis/TDP-04-clustering.Rmd
    Modified:   analysis/TDP-07-01-STMN2_expression.Rmd
    Modified:   analysis/TDP-07-cluster_12.Rmd
    Modified:   analysis/TDP-08-01-HA-D96-expression-changes.Rmd
    Modified:   analysis/_site.yml
    Modified:   analysis/organoid-02-integration.Rmd
    Modified:   analysis/organoid-04-group_integration.Rmd
    Modified:   analysis/organoid-06-conos-analysis.Rmd
Note that any generated files, e.g. HTML, png, CSS, etc., are not included in this status report because it is ok for generated content to have uncommitted changes.
These are the previous versions of the repository in which changes were made to the R Markdown (analysis/Lam-02-NSC_annotation.Rmd) and HTML (docs/Lam-02-NSC_annotation.html) files. If you've configured a remote Git repository (see ?wflow_git_remote), click on the hyperlinks in the table below to view the files as they were in that past version.
| File | Version | Author | Date | Message |
|---|---|---|---|---|
| Rmd | f3e4c6b | khembach | 2021-08-30 | remove warnings |
| html | 4c53085 | khembach | 2021-08-27 | Build site. |
| Rmd | 2da9ece | khembach | 2021-08-27 | explore data integration with CellMixS |
| html | 7fcea2b | khembach | 2021-05-26 | Build site. |
| Rmd | 5ebe77e | khembach | 2021-05-26 | change color of NES and iCoMoNSCs in DR |
| html | 489b5df | khembach | 2021-04-06 | Build site. |
| Rmd | d76adbd | khembach | 2021-04-06 | update heatmaps |
| html | d515c70 | khembach | 2020-08-19 | Build site. |
| Rmd | eb3e64d | khembach | 2020-08-19 | split NES into cell lines |
| html | e659e63 | khembach | 2020-08-07 | Build site. |
| Rmd | 7562682 | khembach | 2020-08-07 | adjust fig sizes |
| html | 875e3c5 | khembach | 2020-07-10 | Build site. |
| Rmd | 15a0ad2 | khembach | 2020-07-10 | compare cell cluster membership before and after NES integration; merge |
| html | a1ebb78 | khembach | 2020-07-08 | Build site. |
| Rmd | d8bd339 | khembach | 2020-07-08 | NSC integration with NES from Lam et al. |
Load packages
library(ComplexHeatmap)
library(cowplot)
library(ggplot2)
library(dplyr)
library(muscat)
library(purrr)
library(RColorBrewer)
library(viridis)
library(scran)
library(Seurat)
library(SingleCellExperiment)
library(stringr)
library(RCurl)
library(BiocParallel)
library(CellMixS)
Load data & convert to SCE
so <- readRDS(file.path("output", "Lam-01-clustering.rds"))
sce <- as.SingleCellExperiment(so, assay = "RNA")
colData(sce) <- as.data.frame(colData(sce)) %>%
    mutate_if(is.character, as.factor) %>%
    DataFrame(row.names = colnames(sce))
Number of clusters by resolution
cluster_cols <- grep("res.[0-9]", colnames(colData(sce)), value = TRUE)
sapply(colData(sce)[cluster_cols], nlevels)
SCT_snn_res.0.8 RNA_snn_res.0.4 integrated_snn_res.0.1
0 7 5
integrated_snn_res.0.2 integrated_snn_res.0.4 integrated_snn_res.0.8
6 7 12
integrated_snn_res.1 integrated_snn_res.1.2 integrated_snn_res.2
14 17 24 Cluster-sample counts
# set cluster IDs to resolution 0.4 clustering
so <- SetIdent(so, value = "integrated_snn_res.0.4")
so@meta.data$cluster_id <- Idents(so)
sce$cluster_id <- Idents(so)
(n_cells <- table(sce$cluster_id, sce$sample_id))
    1NSC 2NSC  NES
  0 2896 3024  215
  1 1770 1725  206
  2 1669 1582  188
  3  983 1042   88
  4  564  600   19
  5  412  401   22
  6   37   34   30
Relative cluster-abundances
fqs <- prop.table(n_cells, margin = 2)
mat <- round(as.matrix(unclass(fqs))*100, 2)
colfunc <- colorRampPalette(c("ghostwhite", "deepskyblue4"))
Heatmap(mat,
    col = colfunc(10),
    name = "Percentage\nof cells",
    cluster_rows = FALSE,
    cluster_columns = FALSE,
    row_names_side = "left",
    row_title = "cluster ID",
    column_title = "sample ID",
    column_title_side = "bottom",
    rect_gp = gpar(col = "white"),
    cell_fun = function(i, j, x, y, width, height, fill)
        grid.text(mat[j, i], x = x, y = y,
            gp = gpar(col = "black", fontsize = 10)))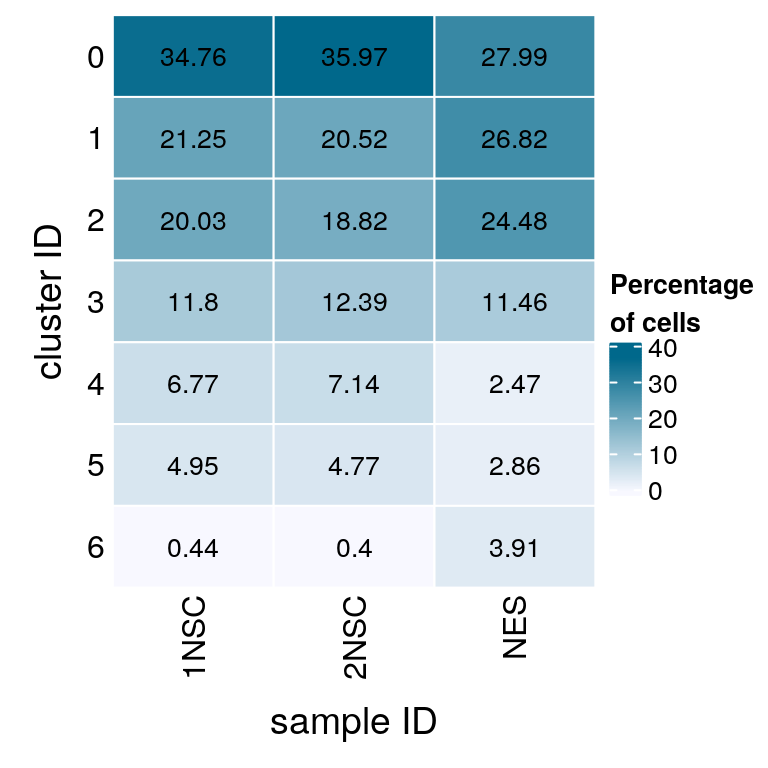
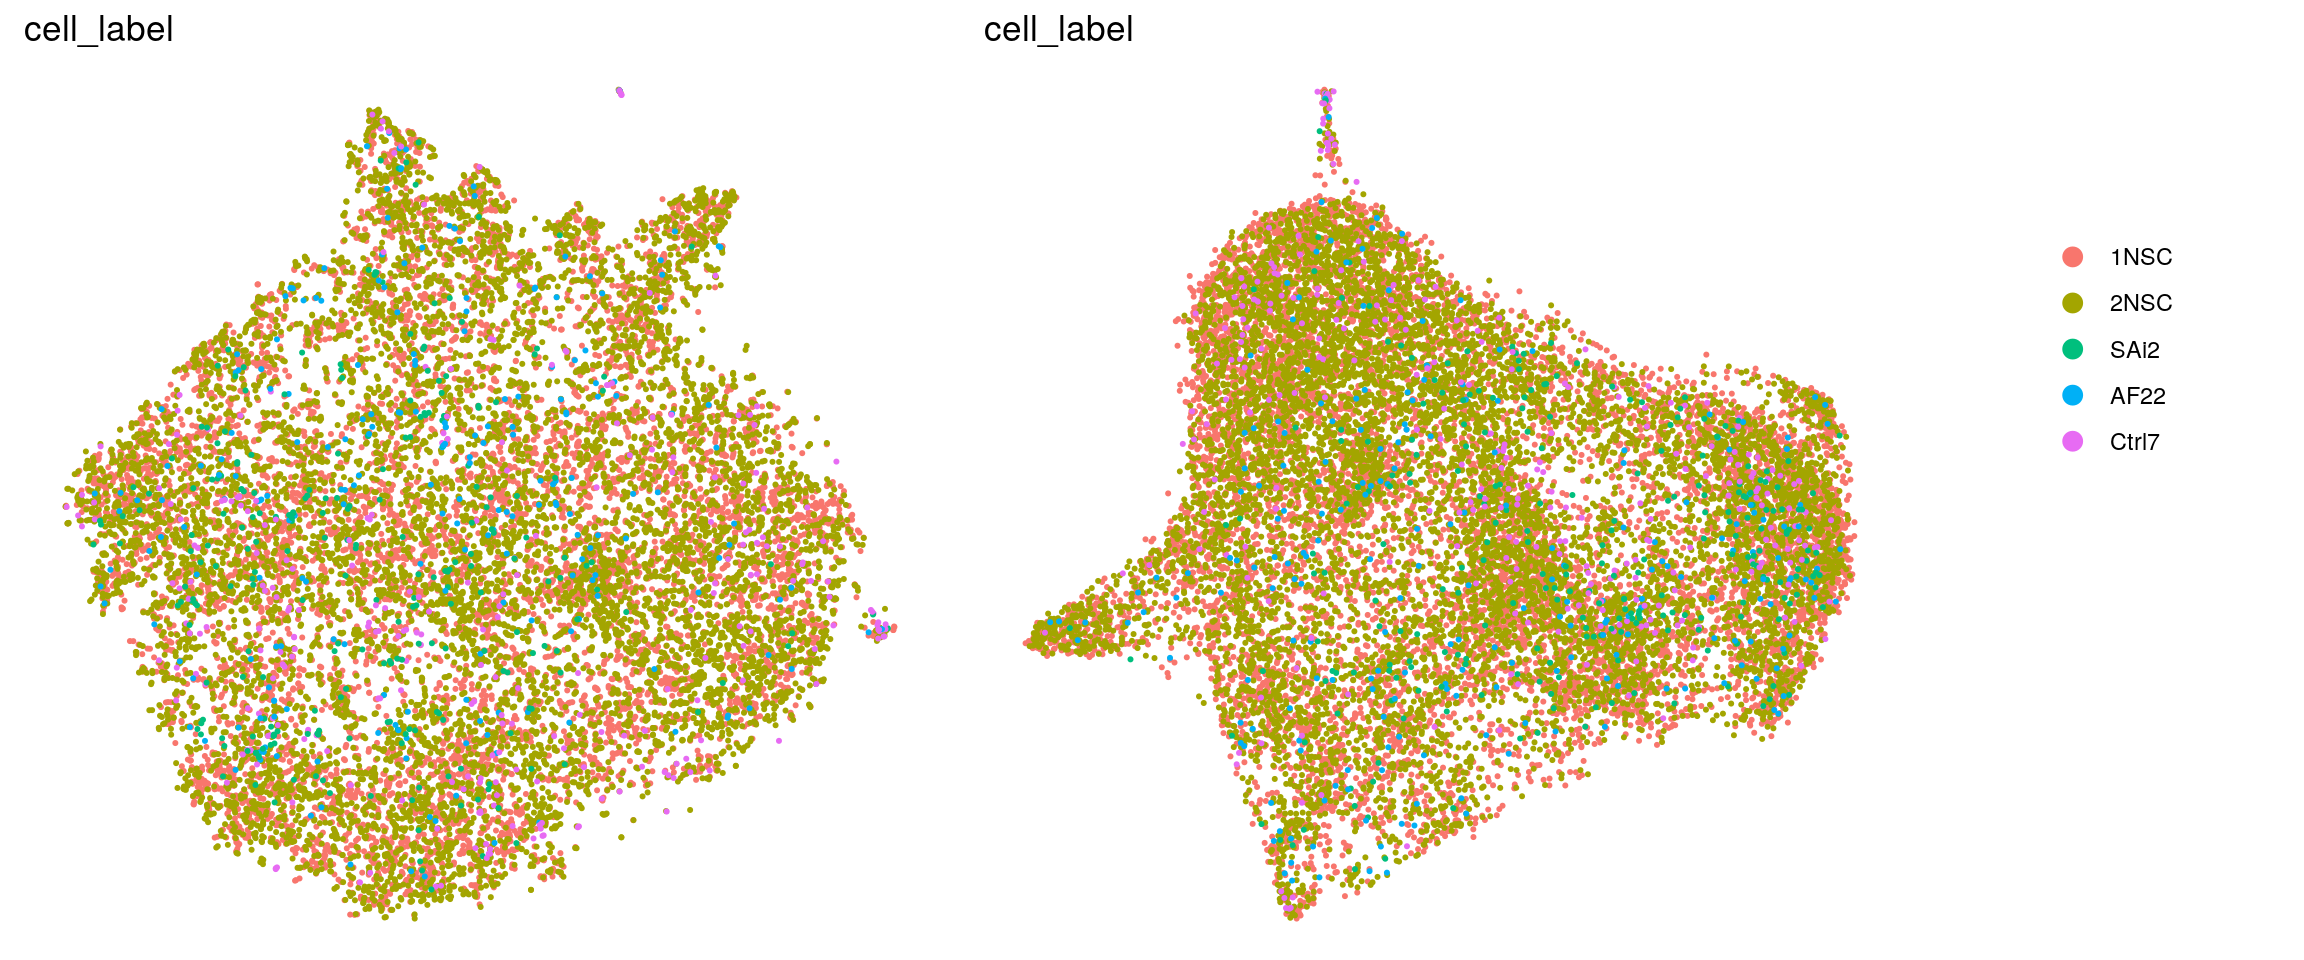
We split the cells from Lam et al. into the three different cell lines that they used in the paper.
ind <- which(sce$sample_id == "NES")
cell_label <- sce$sample_id
levels(cell_label) <- c(levels(cell_label), levels(sce$Cell_line))
cell_label[ind] <- sce$Cell_line[ind]
cell_label <- droplevels(cell_label)
levels(cell_label)[levels(cell_label)==".SAi2"] <- "SAi2"
so$cell_label <- cell_label

(n_cells_line <- table(sce$cluster_id, cell_label))
cell_label
1NSC 2NSC SAi2 AF22 Ctrl7
0 2896 3024 51 67 97
1 1770 1725 76 44 86
2 1669 1582 80 46 62
3 983 1042 34 41 13
4 564 600 2 13 4
5 412 401 10 12 0
6 37 34 3 3 24fqs <- prop.table(n_cells_line, margin = 2)
mat <- round(as.matrix(unclass(fqs))*100, 2)
Heatmap(mat,
col = colfunc(10),
name = "Percentage\nof cells",
cluster_rows = FALSE,
cluster_columns = FALSE,
row_names_side = "left",
row_title = "cluster ID",
column_title = "sample ID",
column_title_side = "bottom",
rect_gp = gpar(col = "white"),
cell_fun = function(i, j, x, y, width, height, fill)
grid.text(mat[j, i], x = x, y = y,
gp = gpar(col = "black", fontsize = 10)))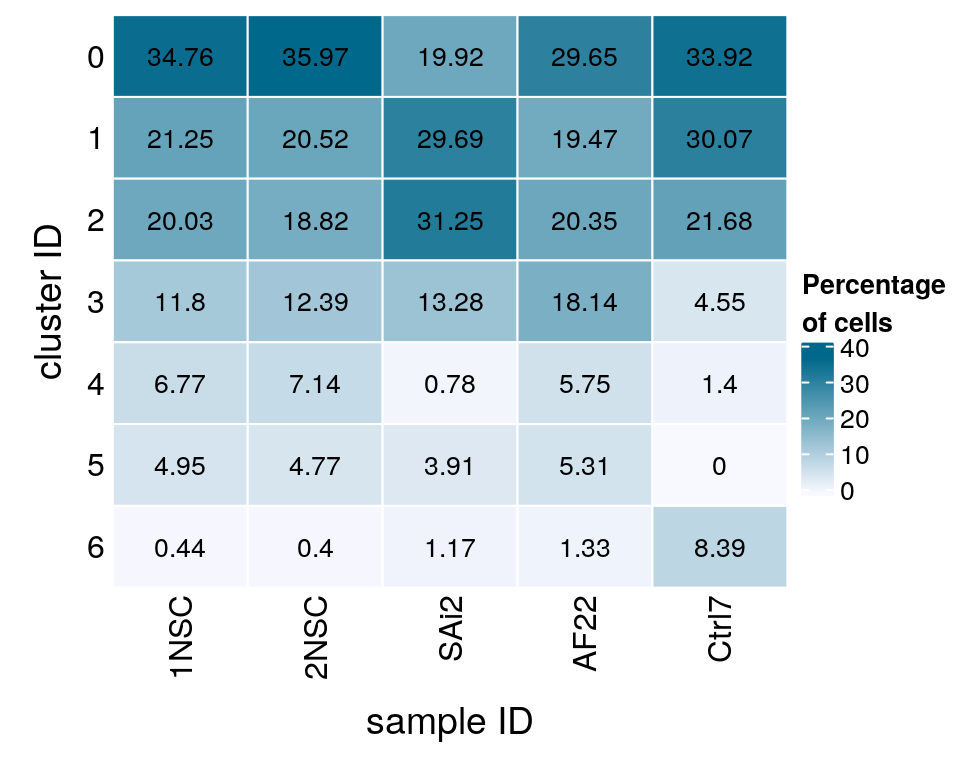
Distribution of NES subtypes per cluster
In the paper, they identified clusters that were specific for different cell types. For our analysis, we merge identical cell subtypes from the different cell lines.
levels(sce$cell_subtype_nes) [1] "Glia_progenitor" "Neural_prog_Proliferating_SAi2"
[3] "Neural_progenitor" "Neural_progenitor_Ctrl7"
[5] "Neural_progenitor_SAi2" "Neuroblast_Ctrl7"
[7] "Radial_Glia_progenitor" ## merge identical cell subtypes
levels(sce$cell_subtype_nes) <-
c("Glia_progenitor", "Neural_prog_Proliferating", "Neural_progenitor",
"Neural_progenitor", "Neural_progenitor", "Neuroblast",
"Radial_Glia_progenitor")
levels(sce$cell_subtype_nes) [1] "Glia_progenitor" "Neural_prog_Proliferating"
[3] "Neural_progenitor" "Neuroblast"
[5] "Radial_Glia_progenitor" (n_types <- table(sce$cluster_id, sce$cell_subtype_nes))
    Glia_progenitor Neural_prog_Proliferating Neural_progenitor Neuroblast
  0              44                        13               121          2
  1              26                        62               103          0
  2              33                        20               113          2
  3              43                         7                38          0
  4              15                         1                 3          0
  5               7                         4                11          0
  6               0                         2                 8         18

    Radial_Glia_progenitor
  0                     35
  1                     15
  2                     20
  3                      0
  4                      0
  5                      0
  6                      2
fqs <- prop.table(n_types, margin = 2)
mat <- round(as.matrix(unclass(fqs))*100, 2)
Heatmap(mat,
col = colfunc(10),
name = "Percentage\nof cells",
cluster_rows = FALSE,
cluster_columns = FALSE,
row_names_side = "left",
row_title = "cluster ID",
column_title = "sample ID",
column_title_side = "bottom",
rect_gp = gpar(col = "white"),
cell_fun = function(i, j, x, y, width, height, fill)
grid.text(mat[j, i], x = x, y = y,
gp = gpar(col = "black", fontsize = 10)))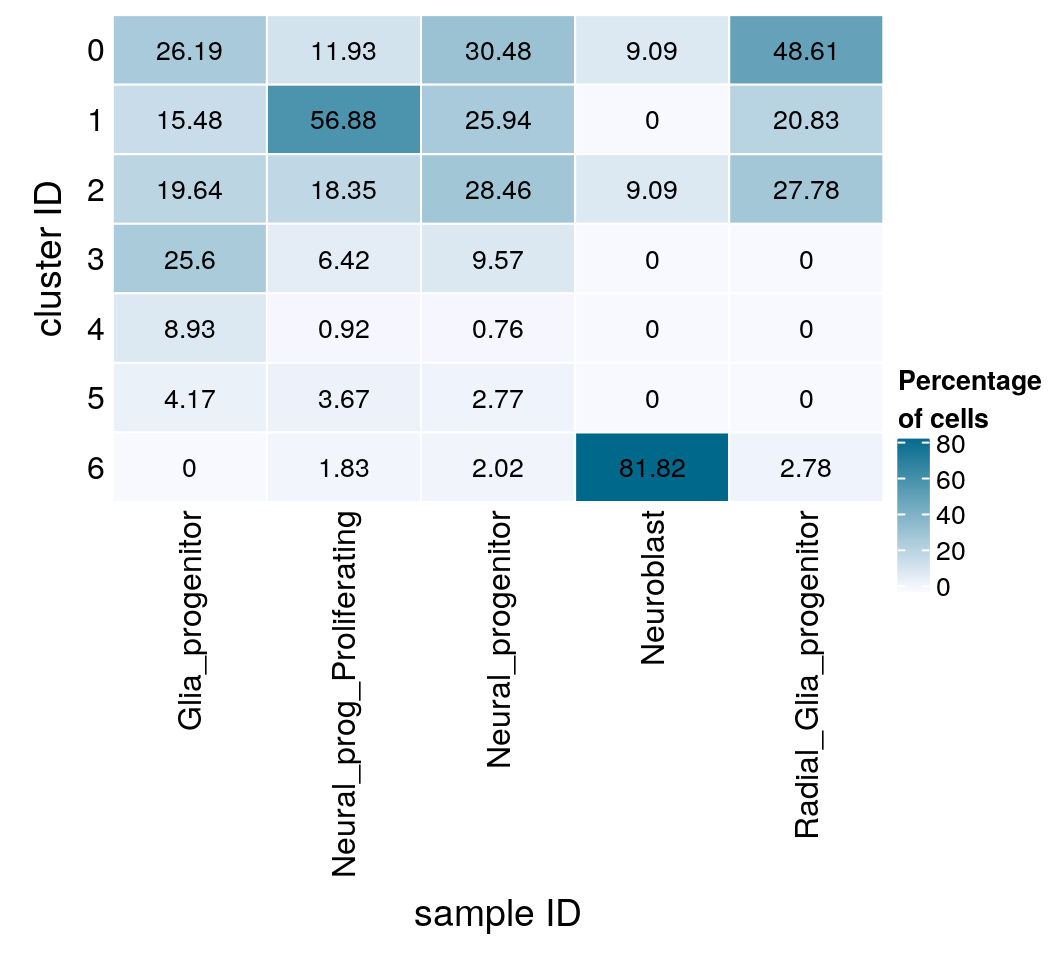
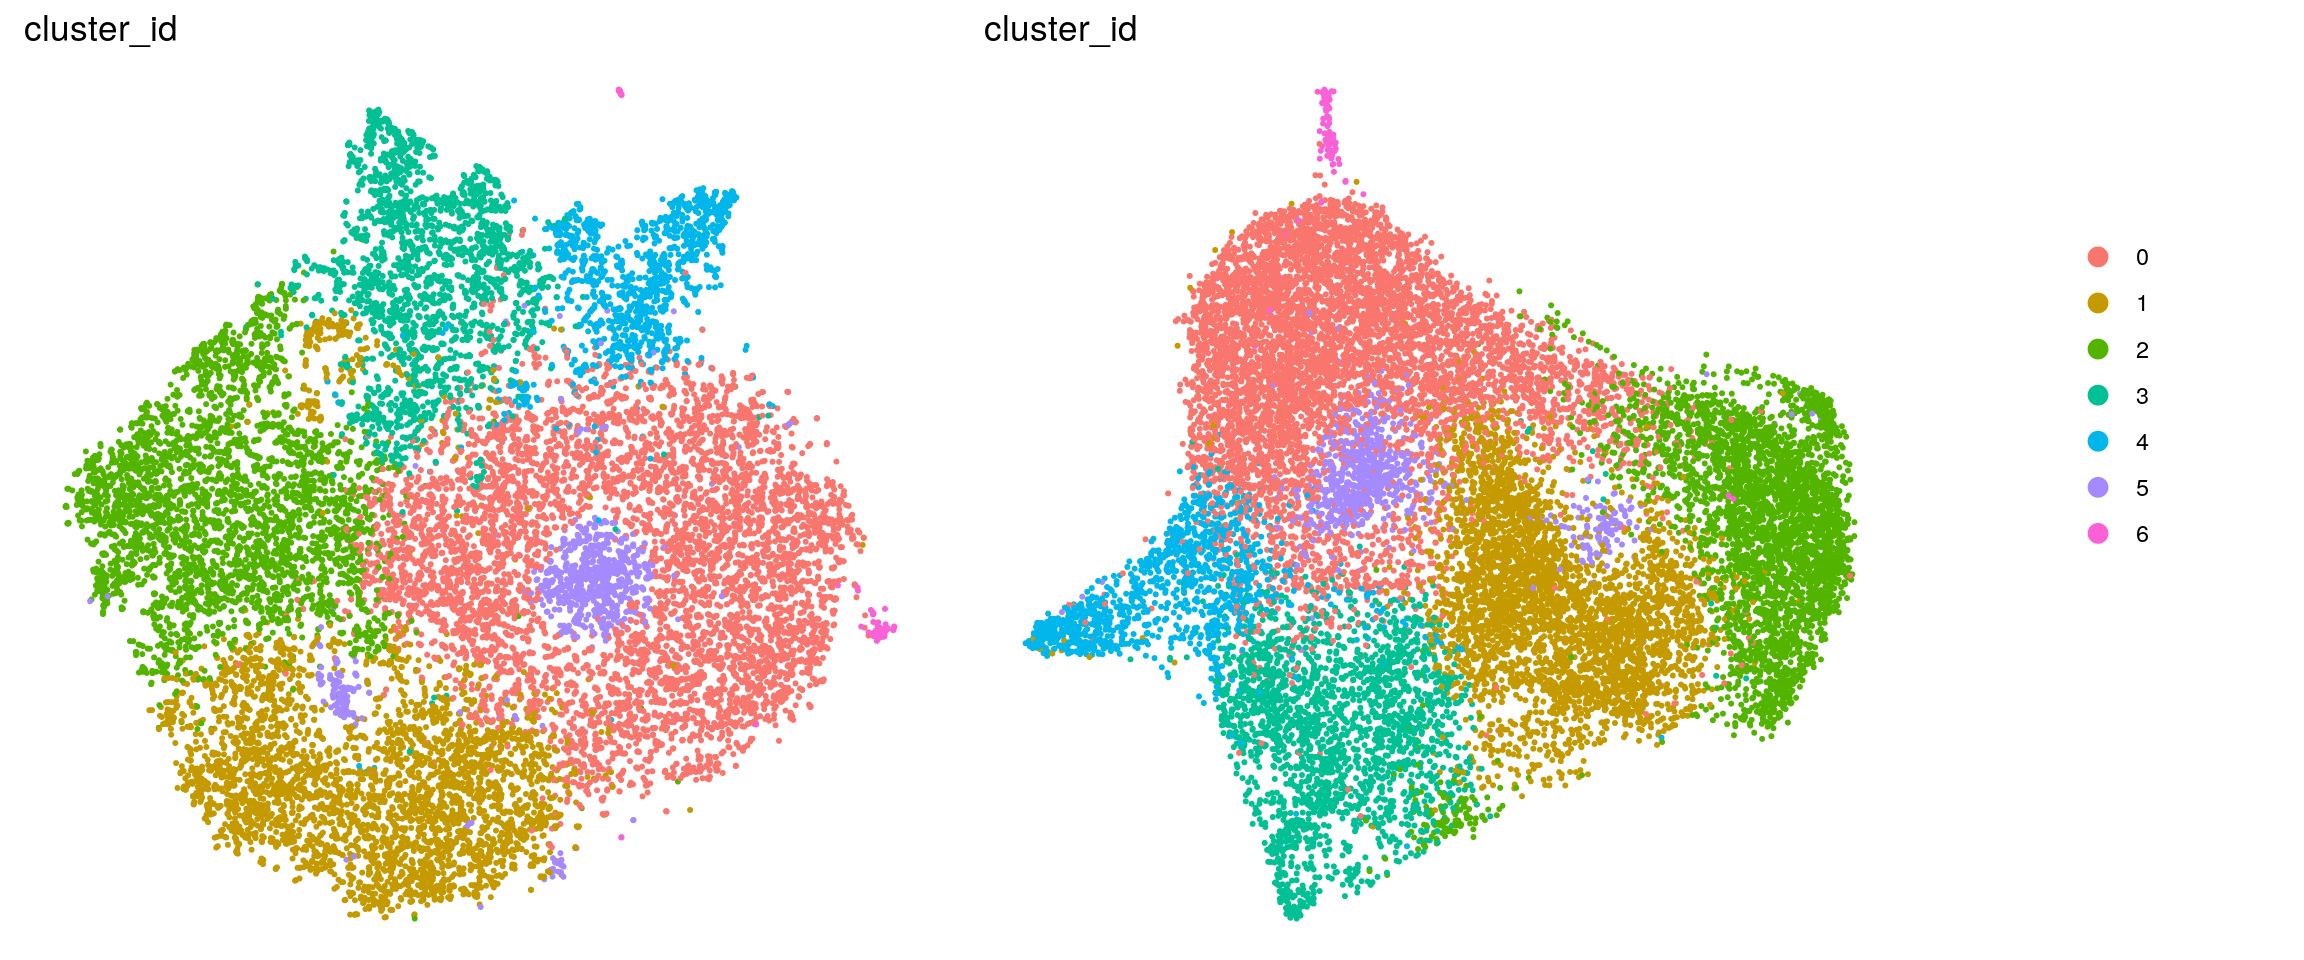
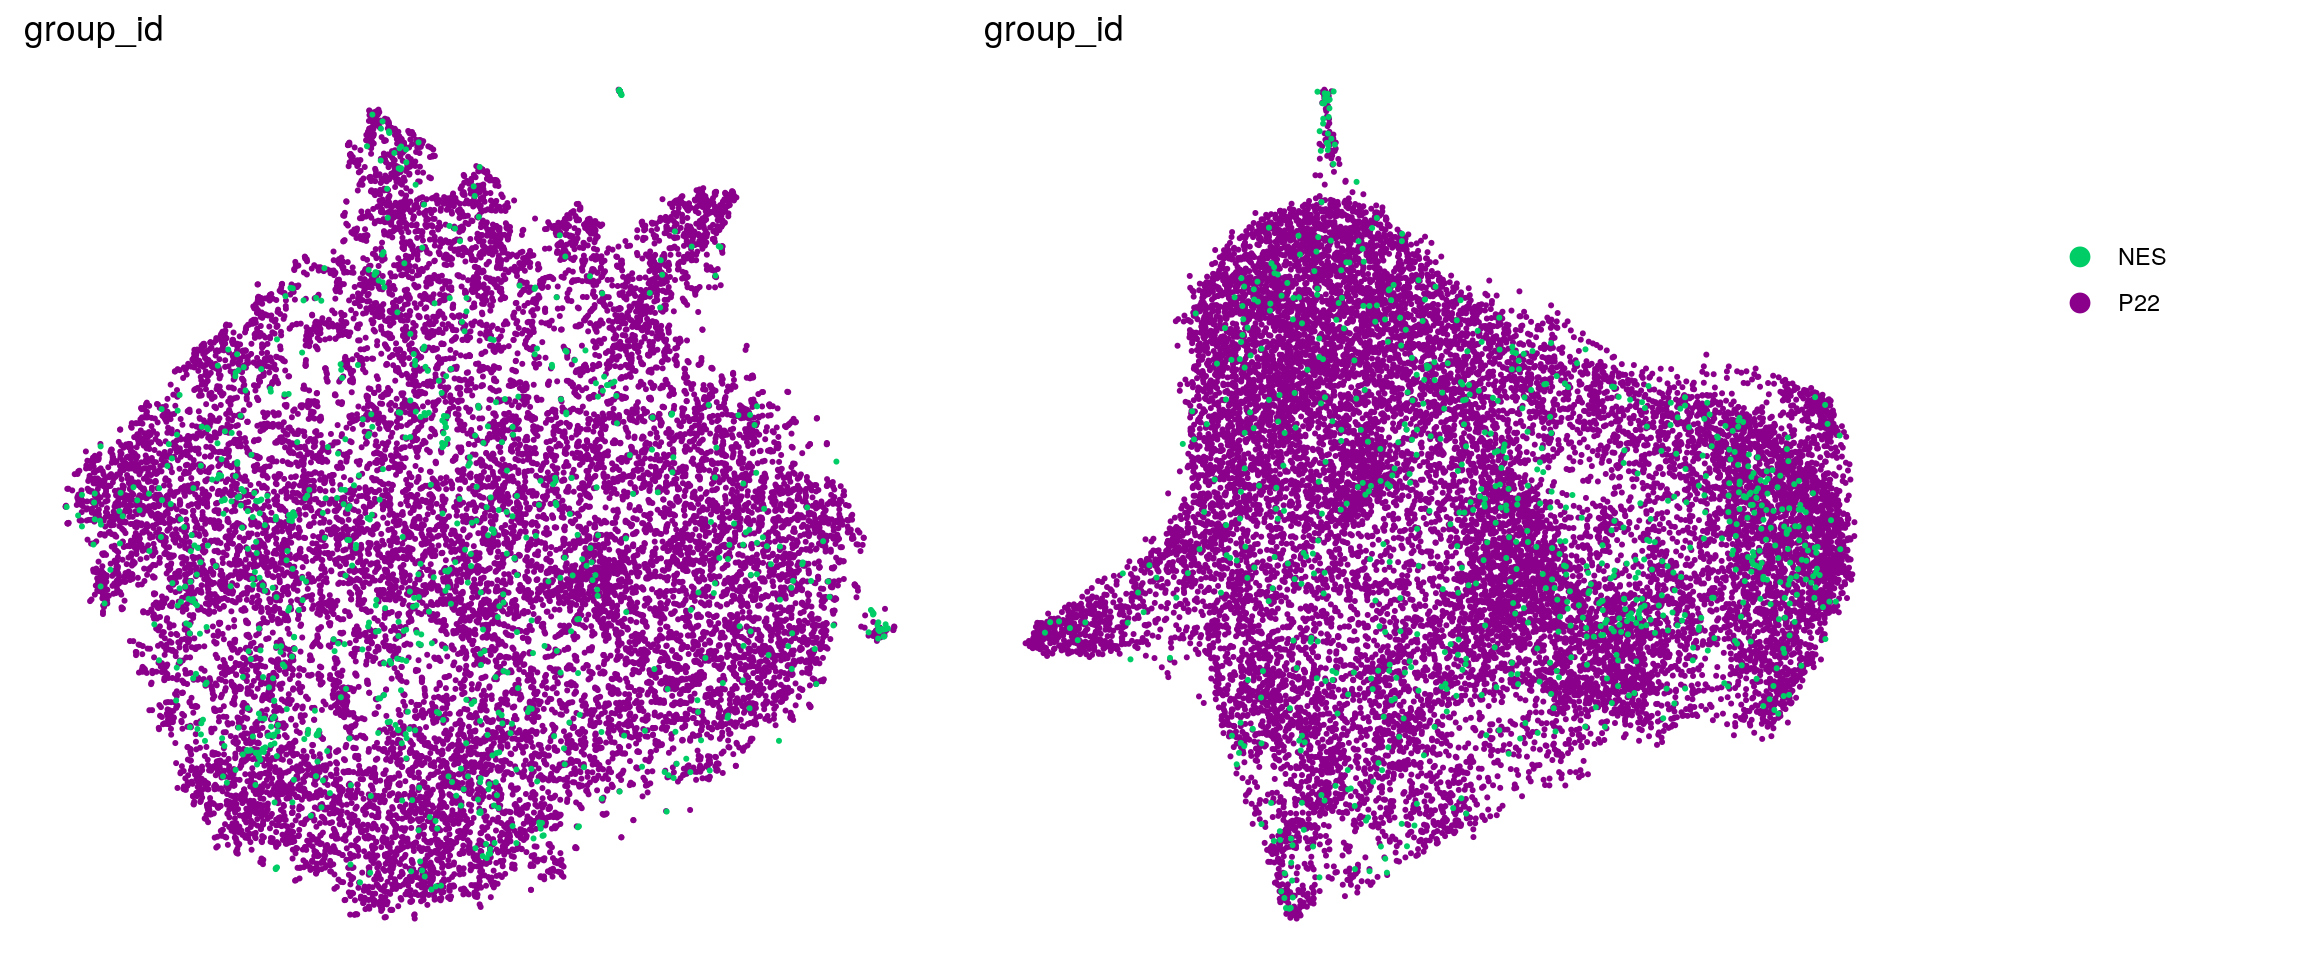
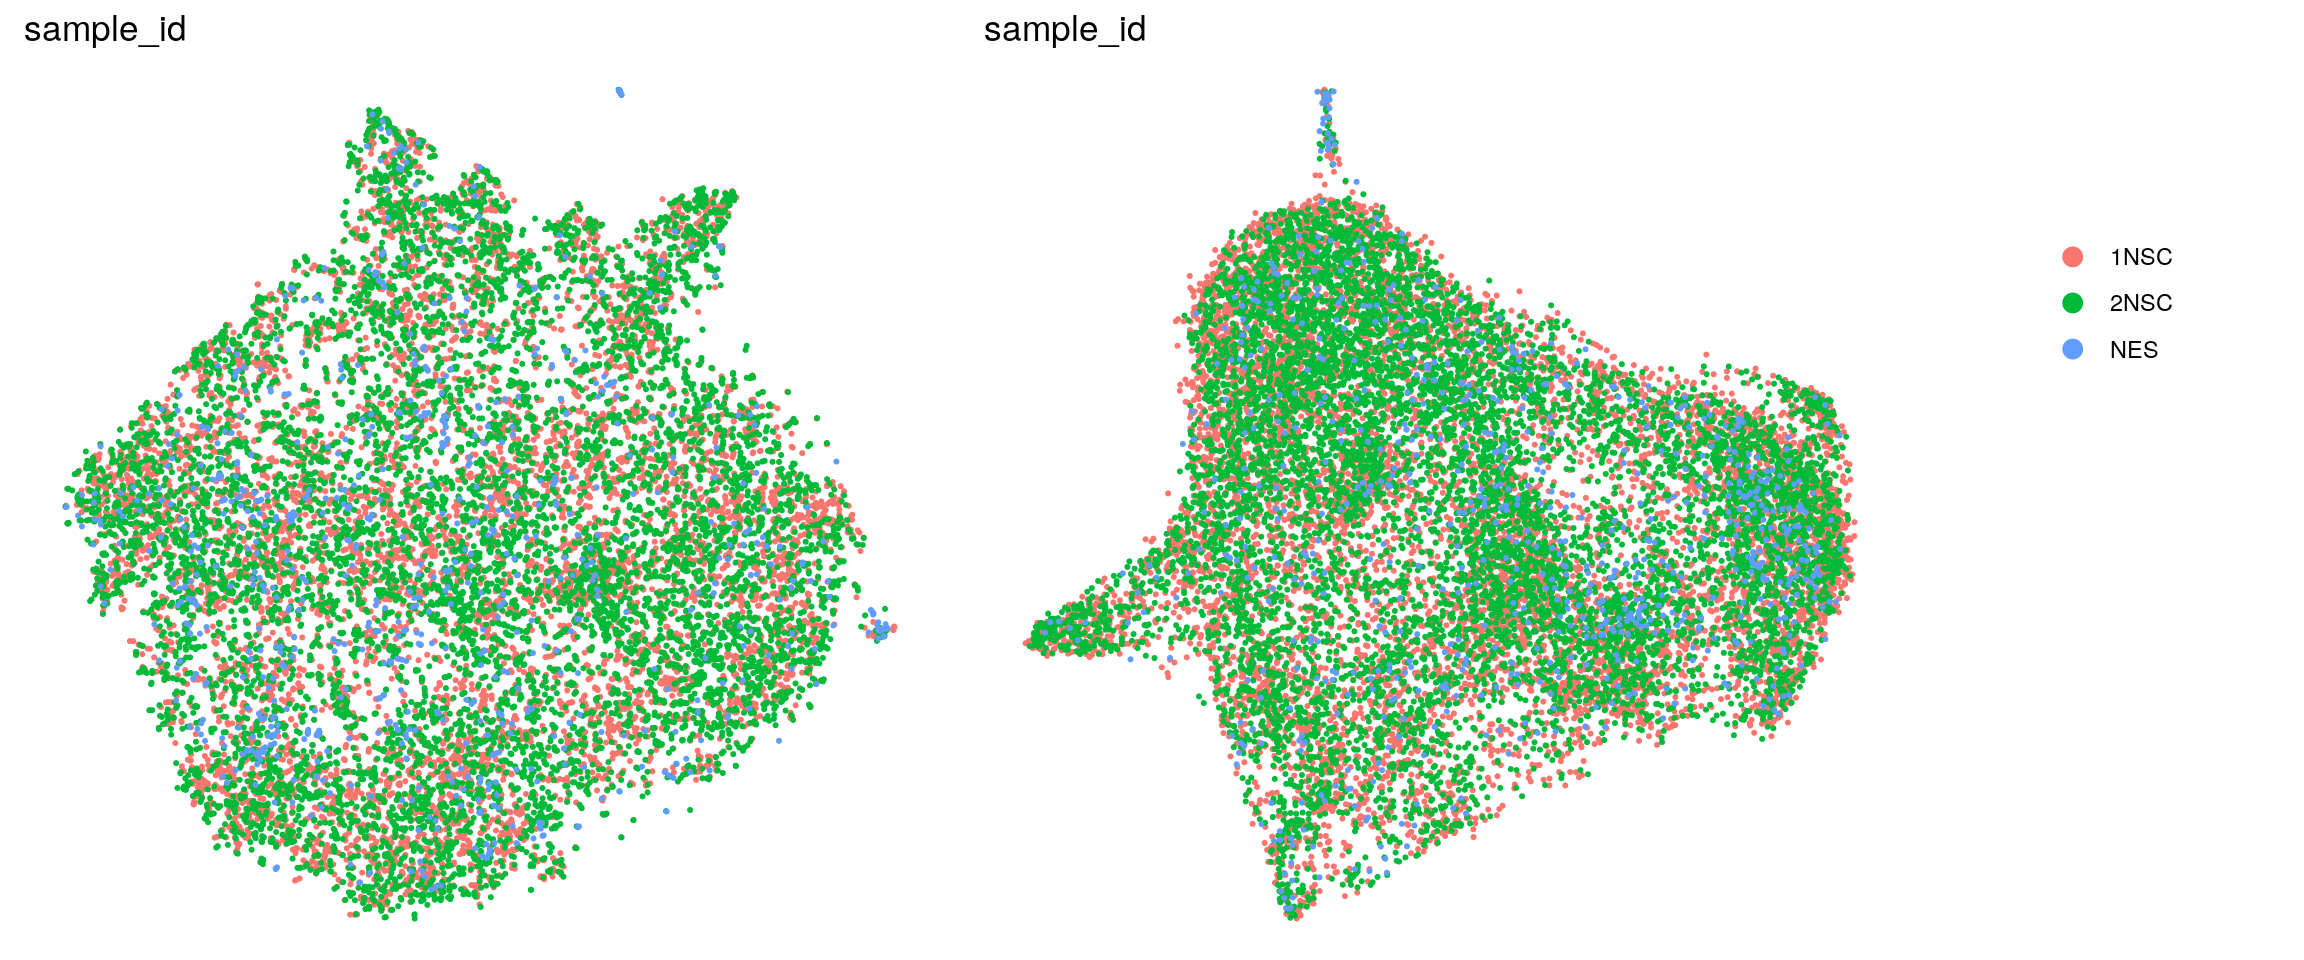
DR colored by cluster ID
.plot_dr <- function(so, dr, id)
    DimPlot(so, group.by = id, reduction = dr, pt.size = 0.4) +
        guides(col = guide_legend(nrow = 11,
            override.aes = list(size = 3, alpha = 1))) +
        theme_void() + theme(aspect.ratio = 1)
ids <- c("cluster_id", "group_id", "sample_id", "cell_label")
for (id in ids) {
    cat("## ", id, "\n")
    p1 <- .plot_dr(so, "tsne", id)
    p2 <- .plot_dr(so, "umap", id)
    if(id == "group_id") {
      p1 <- p1 + scale_color_manual(values = c("springgreen3", "darkmagenta"))
      p2 <- p2 + scale_color_manual(values = c("springgreen3", "darkmagenta"))
    }
    lgd <- get_legend(p1)
    p1 <- p1 + theme(legend.position = "none")
    p2 <- p2 + theme(legend.position = "none")
    ps <- plot_grid(plotlist = list(p1, p2), nrow = 1)
    p <- plot_grid(ps, lgd, nrow = 1, rel_widths = c(1, 0.2))
    print(p)
    cat("\n\n")
}
cluster_id
group_id
sample_id
Cluster markers from Lam et al.
Similar to figure 2f in paper.
## source file with list of known marker genes
source(file.path("data", "Lam_figure2_markers.R"))

fs <- lapply(fs, sapply, function(g)
    grep(pattern = paste0("\\.", g, "$"), rownames(sce), value = TRUE)
  )

fs <- lapply(fs, function(x) unlist(x[lengths(x) !=0]) )

gs <- gsub(".*\\.", "", unlist(fs))
ns <- vapply(fs, length, numeric(1))
ks <- rep.int(names(fs), ns)
labs <- lapply(fs, function(x) gsub(".*\\.", "",x))
Heatmap of mean marker-exprs. by cluster
# split cells by cluster
cs_by_k <- split(colnames(sce), sce$cluster_id)
# compute cluster-marker means
ms_by_cluster <- lapply(fs, function(gs) vapply(cs_by_k, function(i)
        Matrix::rowMeans(logcounts(sce)[gs, i, drop = FALSE]),
        numeric(length(gs))))
# prep. for plotting & scale b/w 0 and 1
mat <- do.call("rbind", ms_by_cluster)
mat <- muscat:::.scale(mat)
rownames(mat) <- gs
cols <- muscat:::.cluster_colors[seq_along(fs)]
cols <- setNames(cols, names(fs))
row_anno <- rowAnnotation(
    df = data.frame(label = factor(ks, levels = names(fs))),
    col = list(label = cols), gp = gpar(col = "white"))
# percentage of cells from each of the samples per cluster
sample_props <- prop.table(n_cells, margin = 1)
col_mat <- as.matrix(unclass(sample_props))
sample_cols <- c("#882255", "#CC6677", "#11588A")
sample_cols <- setNames(sample_cols, colnames(col_mat))
col_anno <- HeatmapAnnotation(
    perc_sample = anno_barplot(col_mat, gp = gpar(fill = sample_cols),
                               height = unit(2, "cm"),
                               border = FALSE),
    annotation_label = "fraction of sample\nin cluster",
    gap = unit(10, "points"))
col_lgd <- Legend(labels = names(sample_cols),
       title = "sample",
       legend_gp = gpar(fill = sample_cols))

hm <- Heatmap(mat,
    name = "scaled avg.\nexpression",
    col = viridis(10),
    cluster_rows = FALSE,
    cluster_columns = FALSE,
    row_names_side = "left",
    column_title = "cluster_id",
    column_title_side = "bottom",
    column_names_side = "bottom",
    column_names_rot = 0,
    column_names_centered = TRUE,
    rect_gp = gpar(col = "white"),
    left_annotation = row_anno,
    top_annotation = col_anno)
draw(hm, annotation_legend_list = list(col_lgd))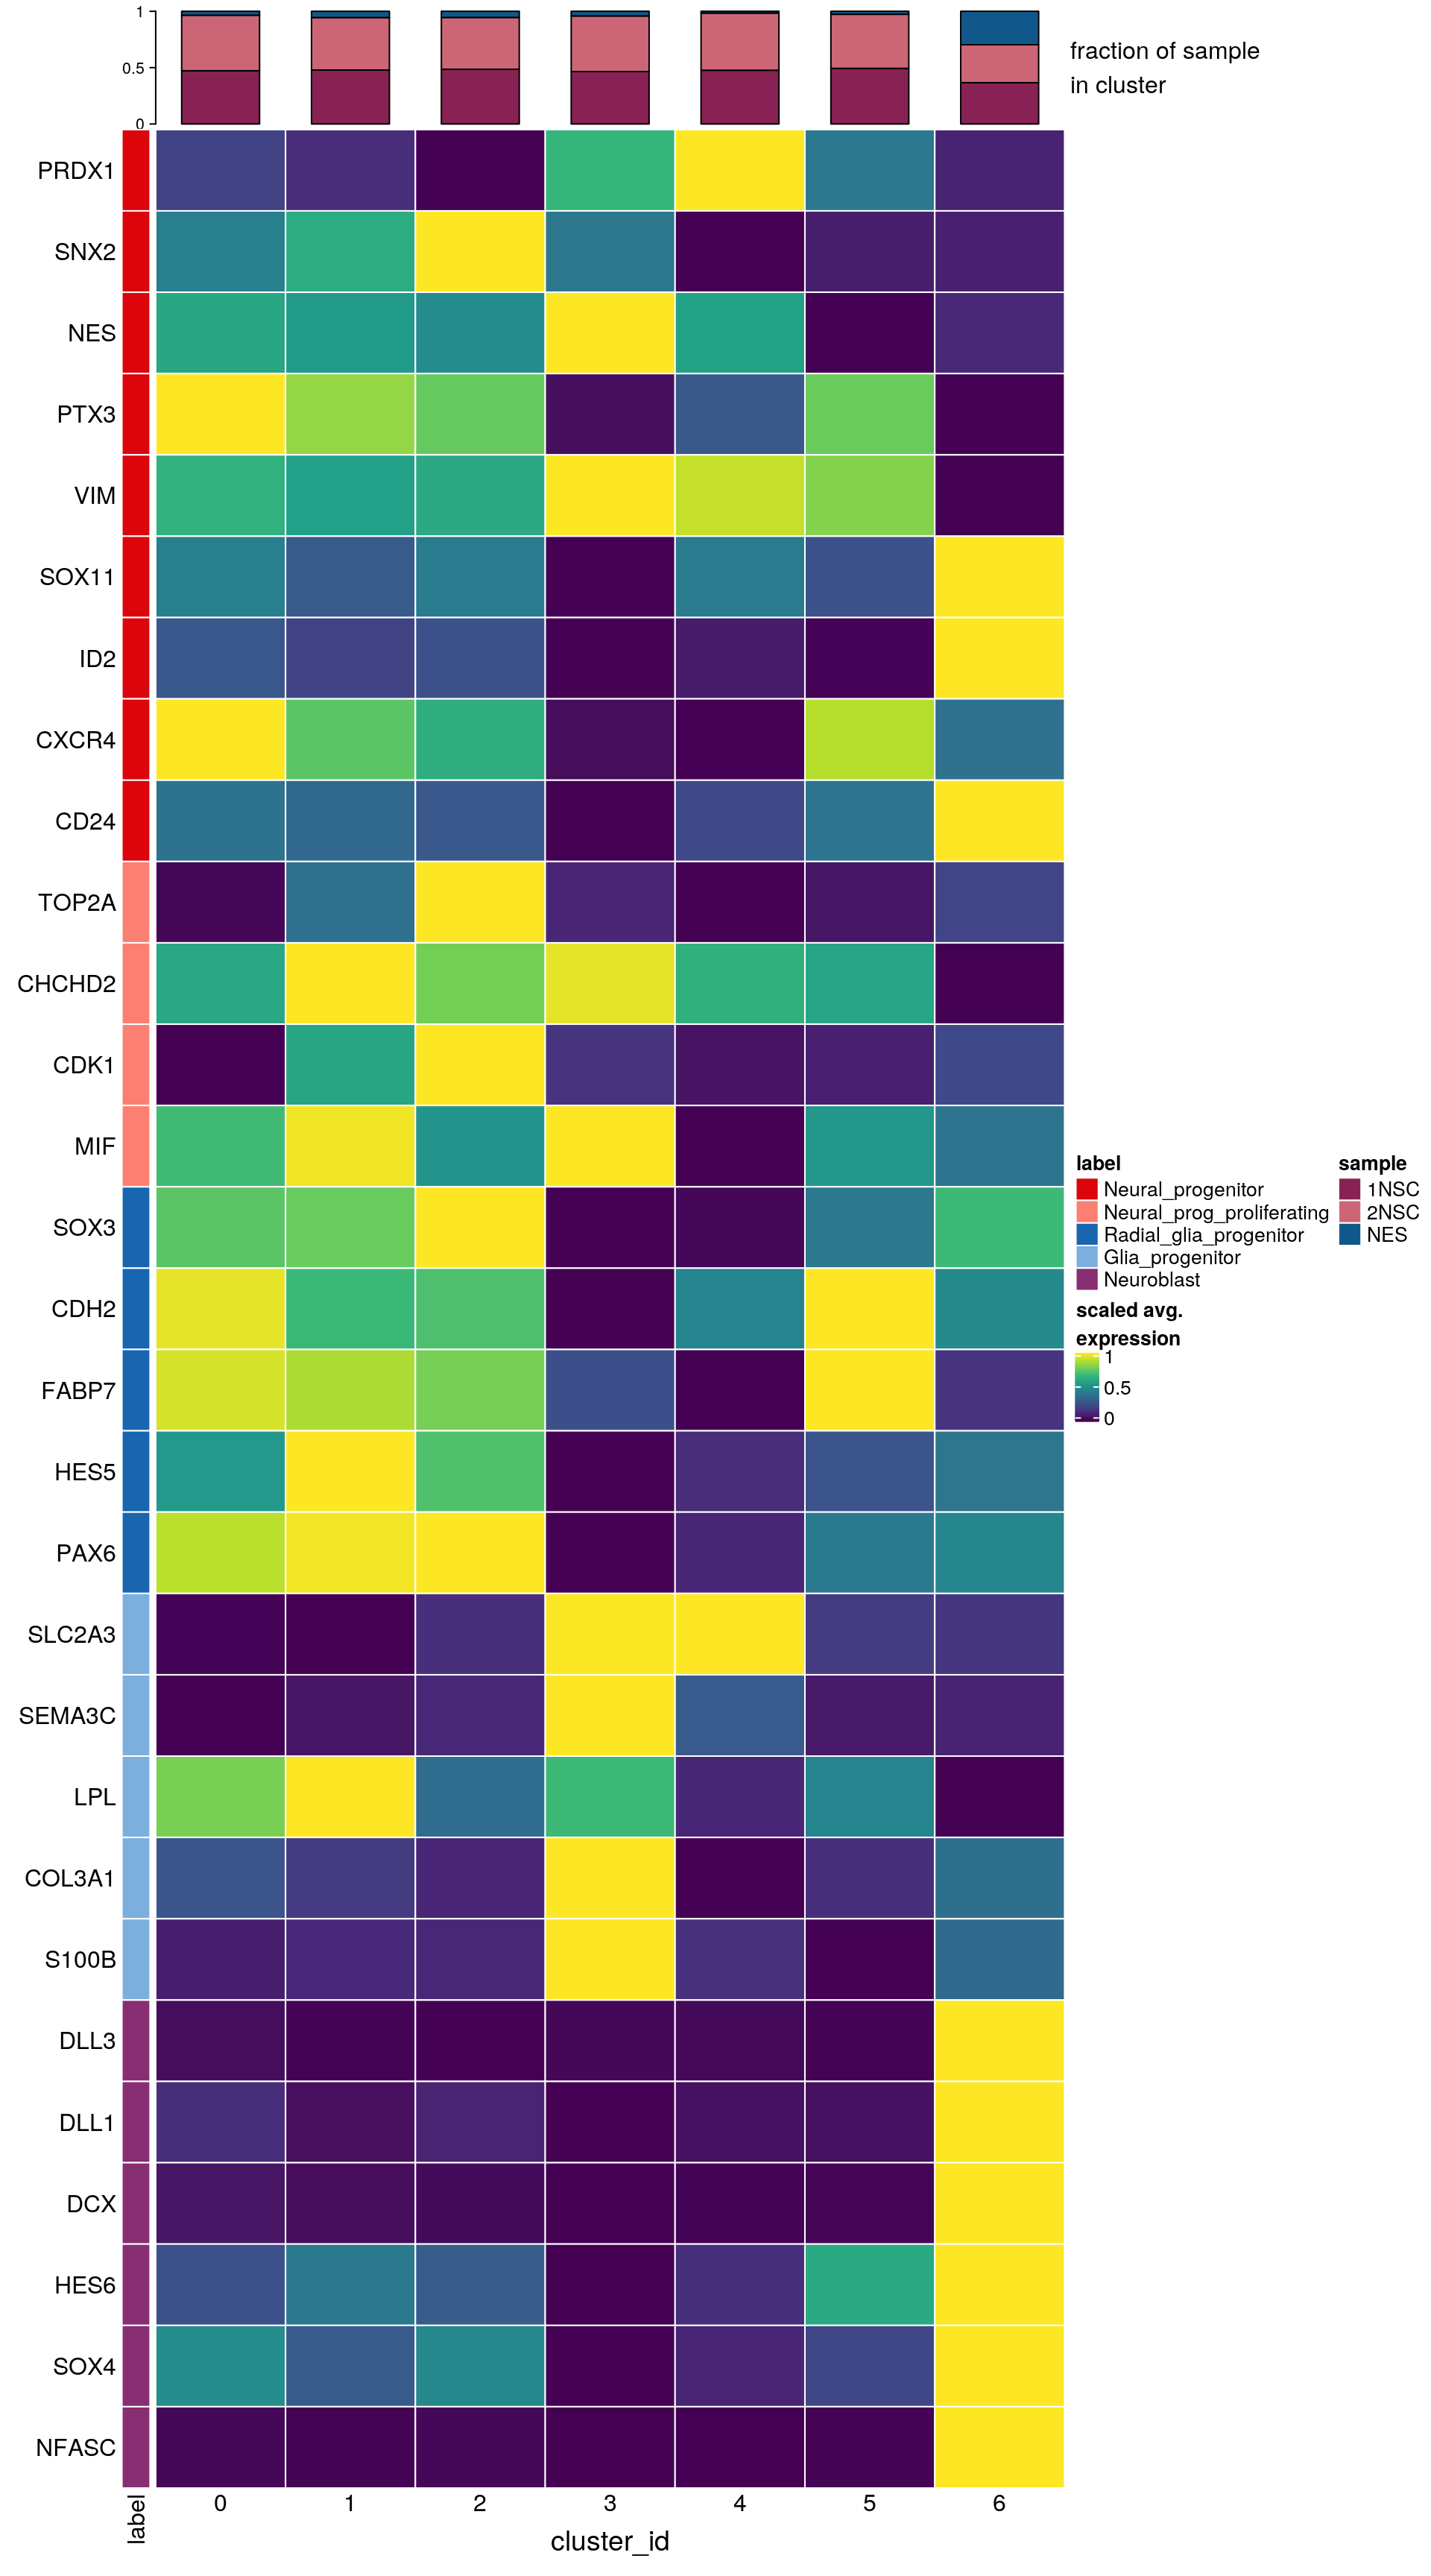
Explore data integration with CellMixS
We use the CellMixS Bioconductor R package to evaluate the data integration and potential batch effects. We test how well the two dataset are mixing or if there are batch effect with the Cellspecific Mixing Score (CMS), a test for batch effects within k-nearest neighbouring cells. A high cms score refers to good mixing, while a low score indicates batch-specific bias. The test considers differences in the number of cells from each batch.
sce$group_id %>% table.
NES P22
768 16739 ## using PCA based on integrated and scaled data
## we set k high but below the size of the smallest group
## because we want to evaluate global structures
## k_min is used to define the minimum size of the local neighbourhoods
sce <- cms(sce, k = 700, k_min = 200, group = "group_id", dim_red = "PCA",
n_dim = 10, unbalanced = TRUE,
BPPARAM = MulticoreParam(workers = 15))
head(colData(sce)[,c("cms_smooth", "cms")])DataFrame with 6 rows and 2 columns
cms_smooth cms
<numeric> <numeric>
AAACCCAAGGTTATAG-1.1NSC 0.415851 0.66510000
AAACCCACATTGACCA-1.1NSC 0.346162 0.00317485
AAACCCAGTAGCGCCT-1.1NSC NA NA
AAACCCAGTATTTCTC-1.1NSC 0.403475 0.99411500
AAACCCAGTTACACTG-1.1NSC 0.469112 0.75650500
AAACGAAAGACAGCGT-1.1NSC 0.425609 0.06196850## cms histogram
visHist(sce)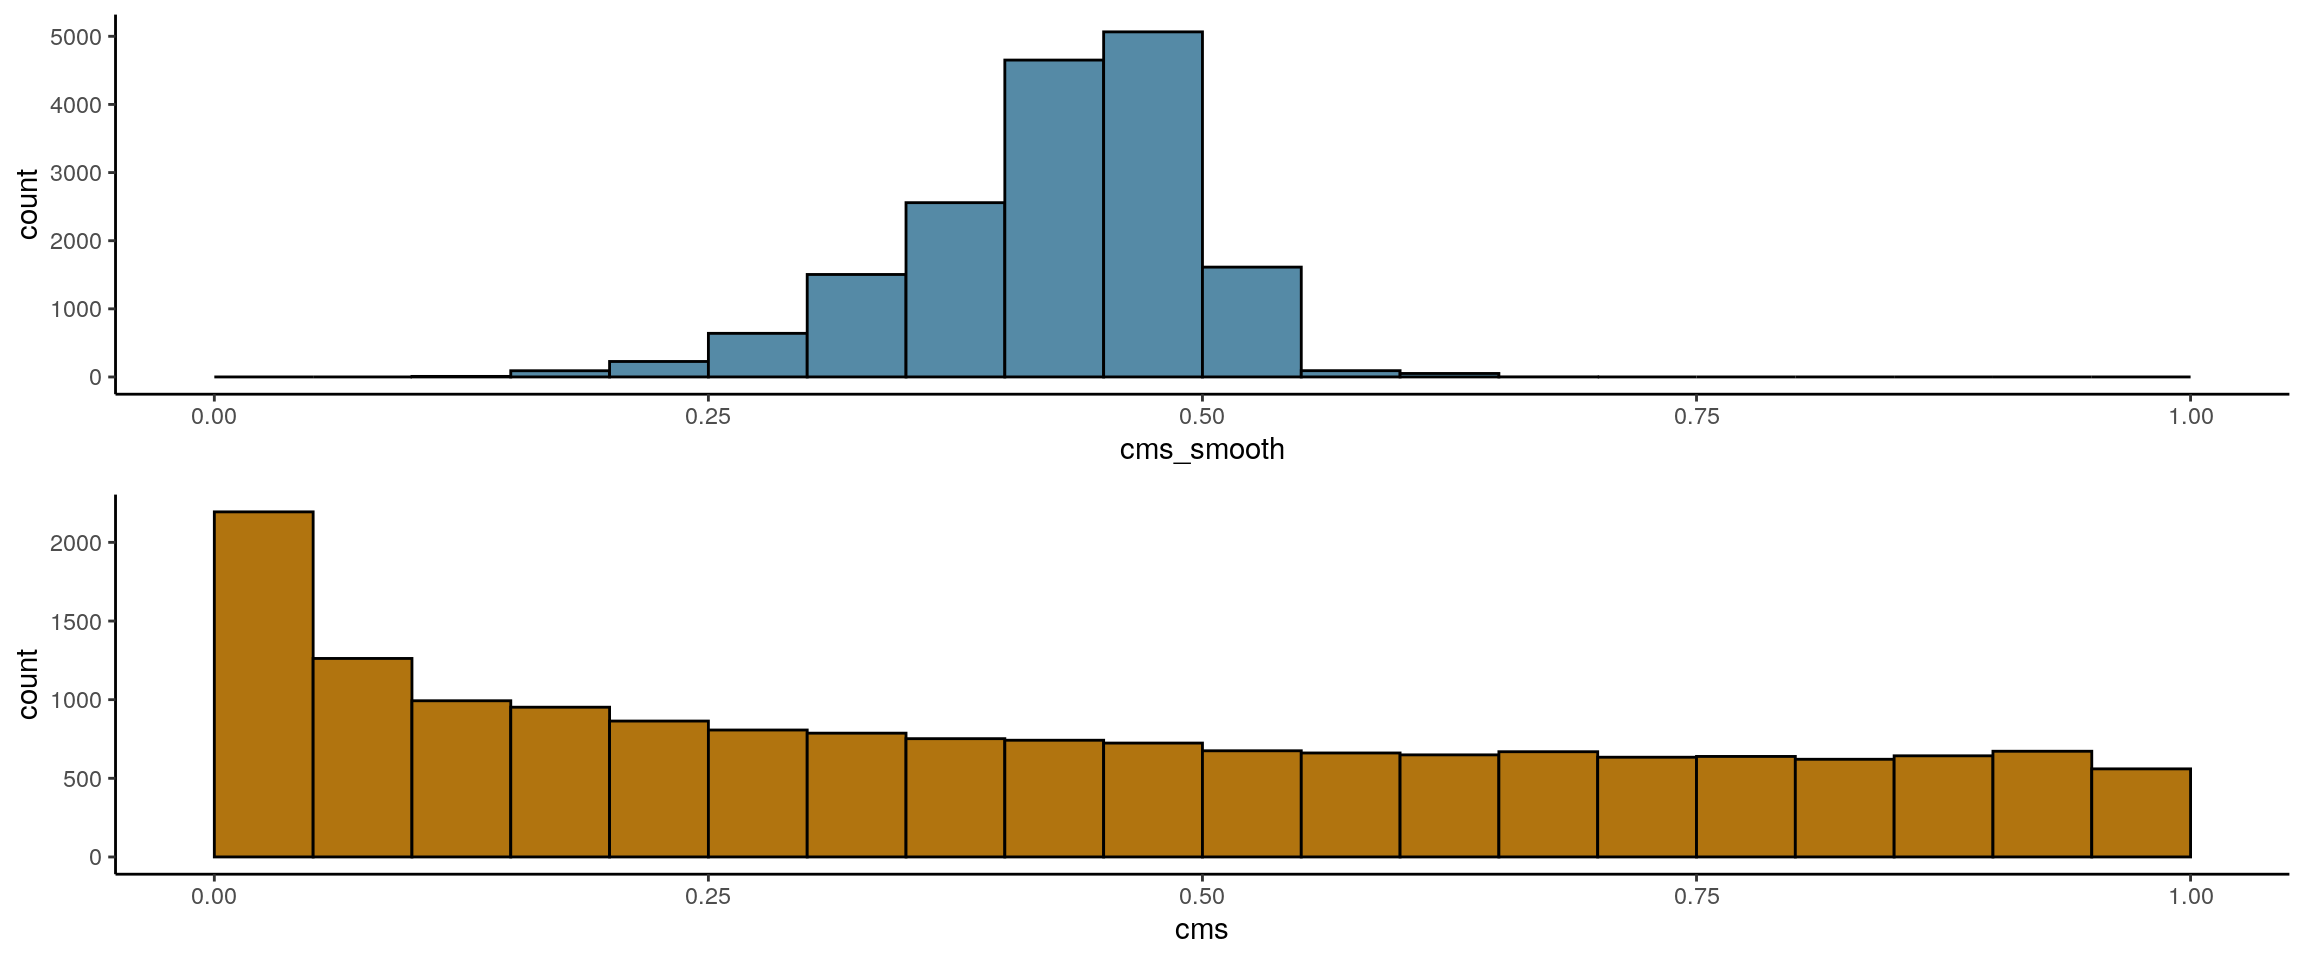
| Version | Author | Date |
|---|---|---|
| 4c53085 | khembach | 2021-08-27 |
p1 <- visMetric(sce, metric_var = "cms_smooth", dim_red = "UMAP") +
  theme_void() + theme(aspect.ratio = 1)
p2 <- visMetric(sce, metric_var = "cms", dim_red = "UMAP") +
  theme_void() + theme(aspect.ratio = 1)
plot_grid(p1, p2)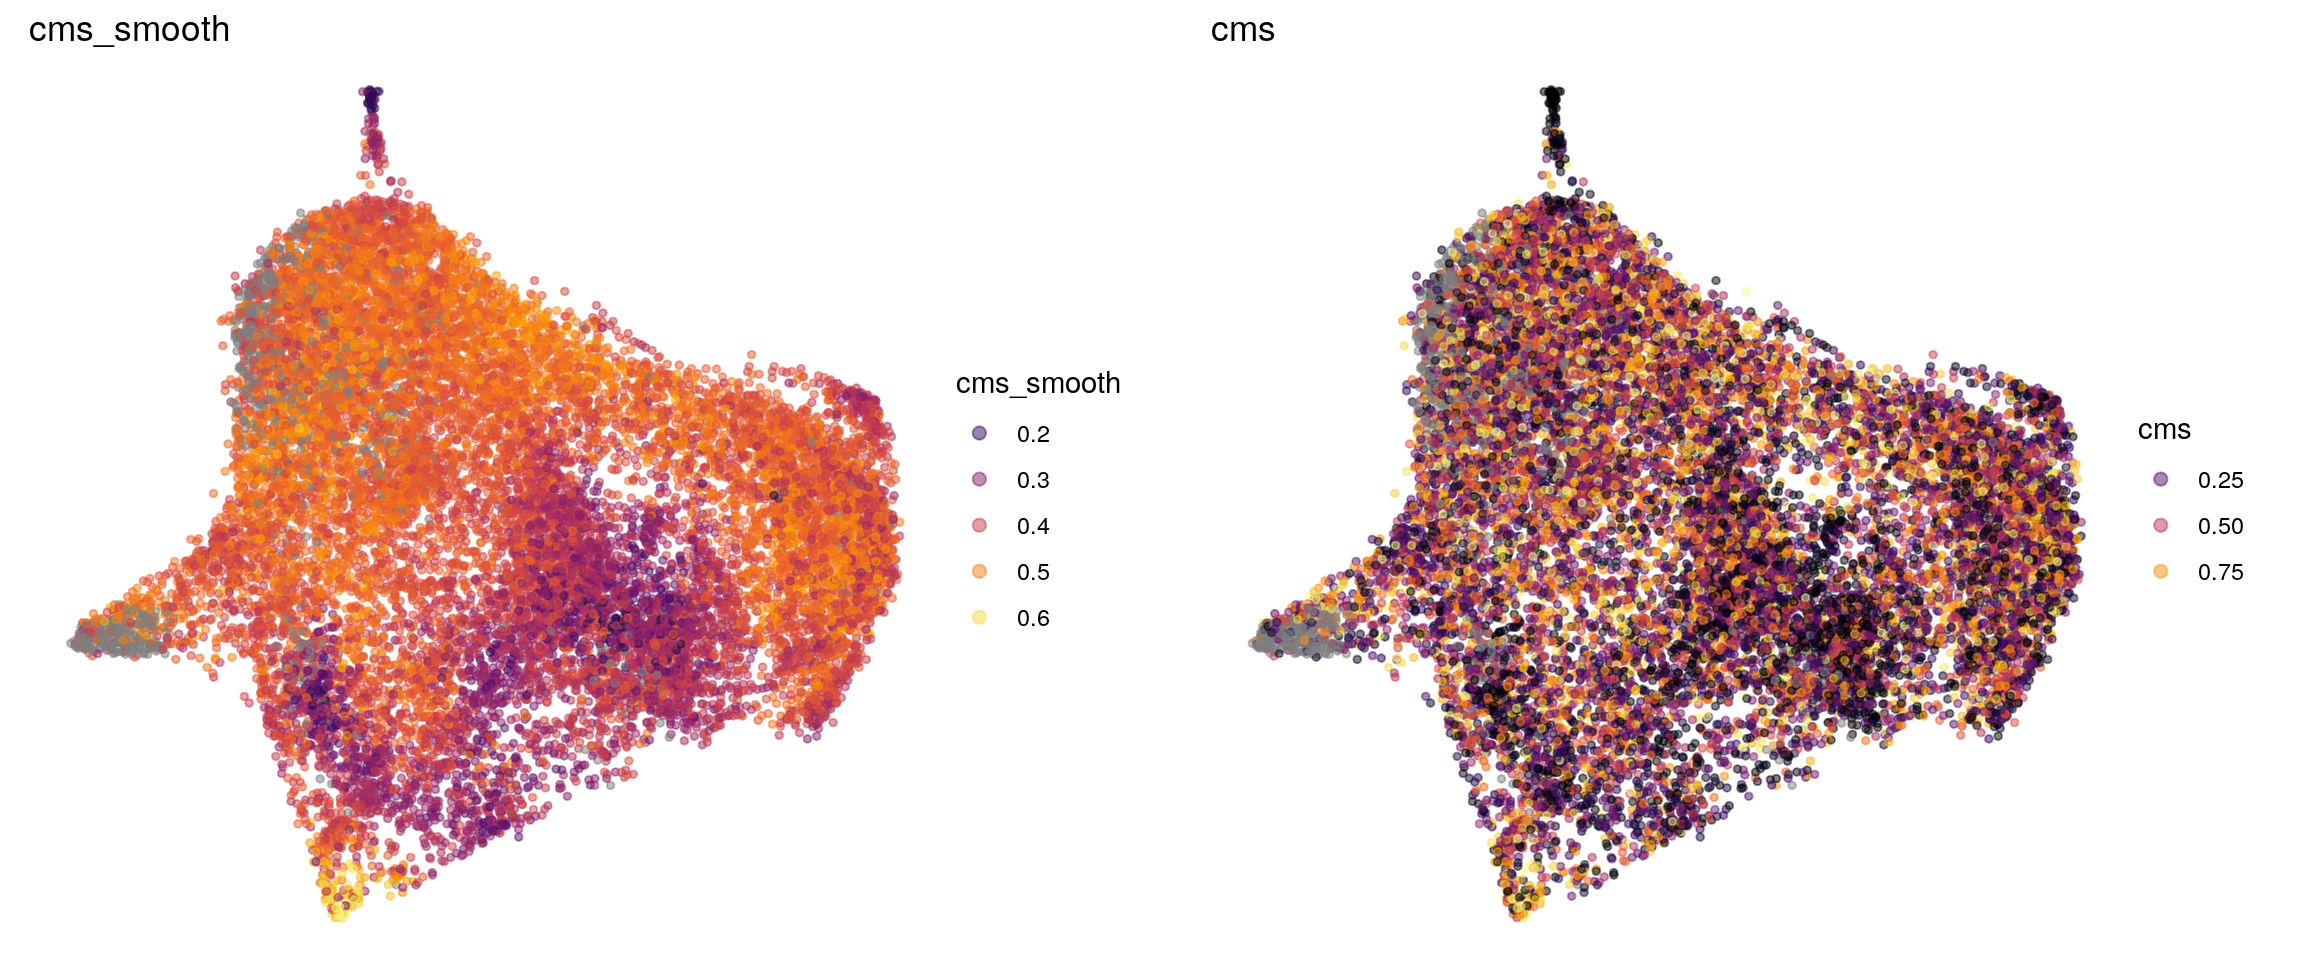
| Version | Author | Date |
|---|---|---|
| 4c53085 | khembach | 2021-08-27 |
## score distribution per cluster
p1 <- visCluster(sce, metric_var = "cms", cluster_var = "cluster_id") +
  scale_fill_hue() +
  scale_y_discrete(limits = rev(unique(sort(sce$cluster_id))))
p2 <- visCluster(sce, metric_var = "cms_smooth", cluster_var = "cluster_id") +
  scale_fill_hue() +
  scale_y_discrete(limits = rev(unique(sort(sce$cluster_id))))
plot_grid(p1, p2)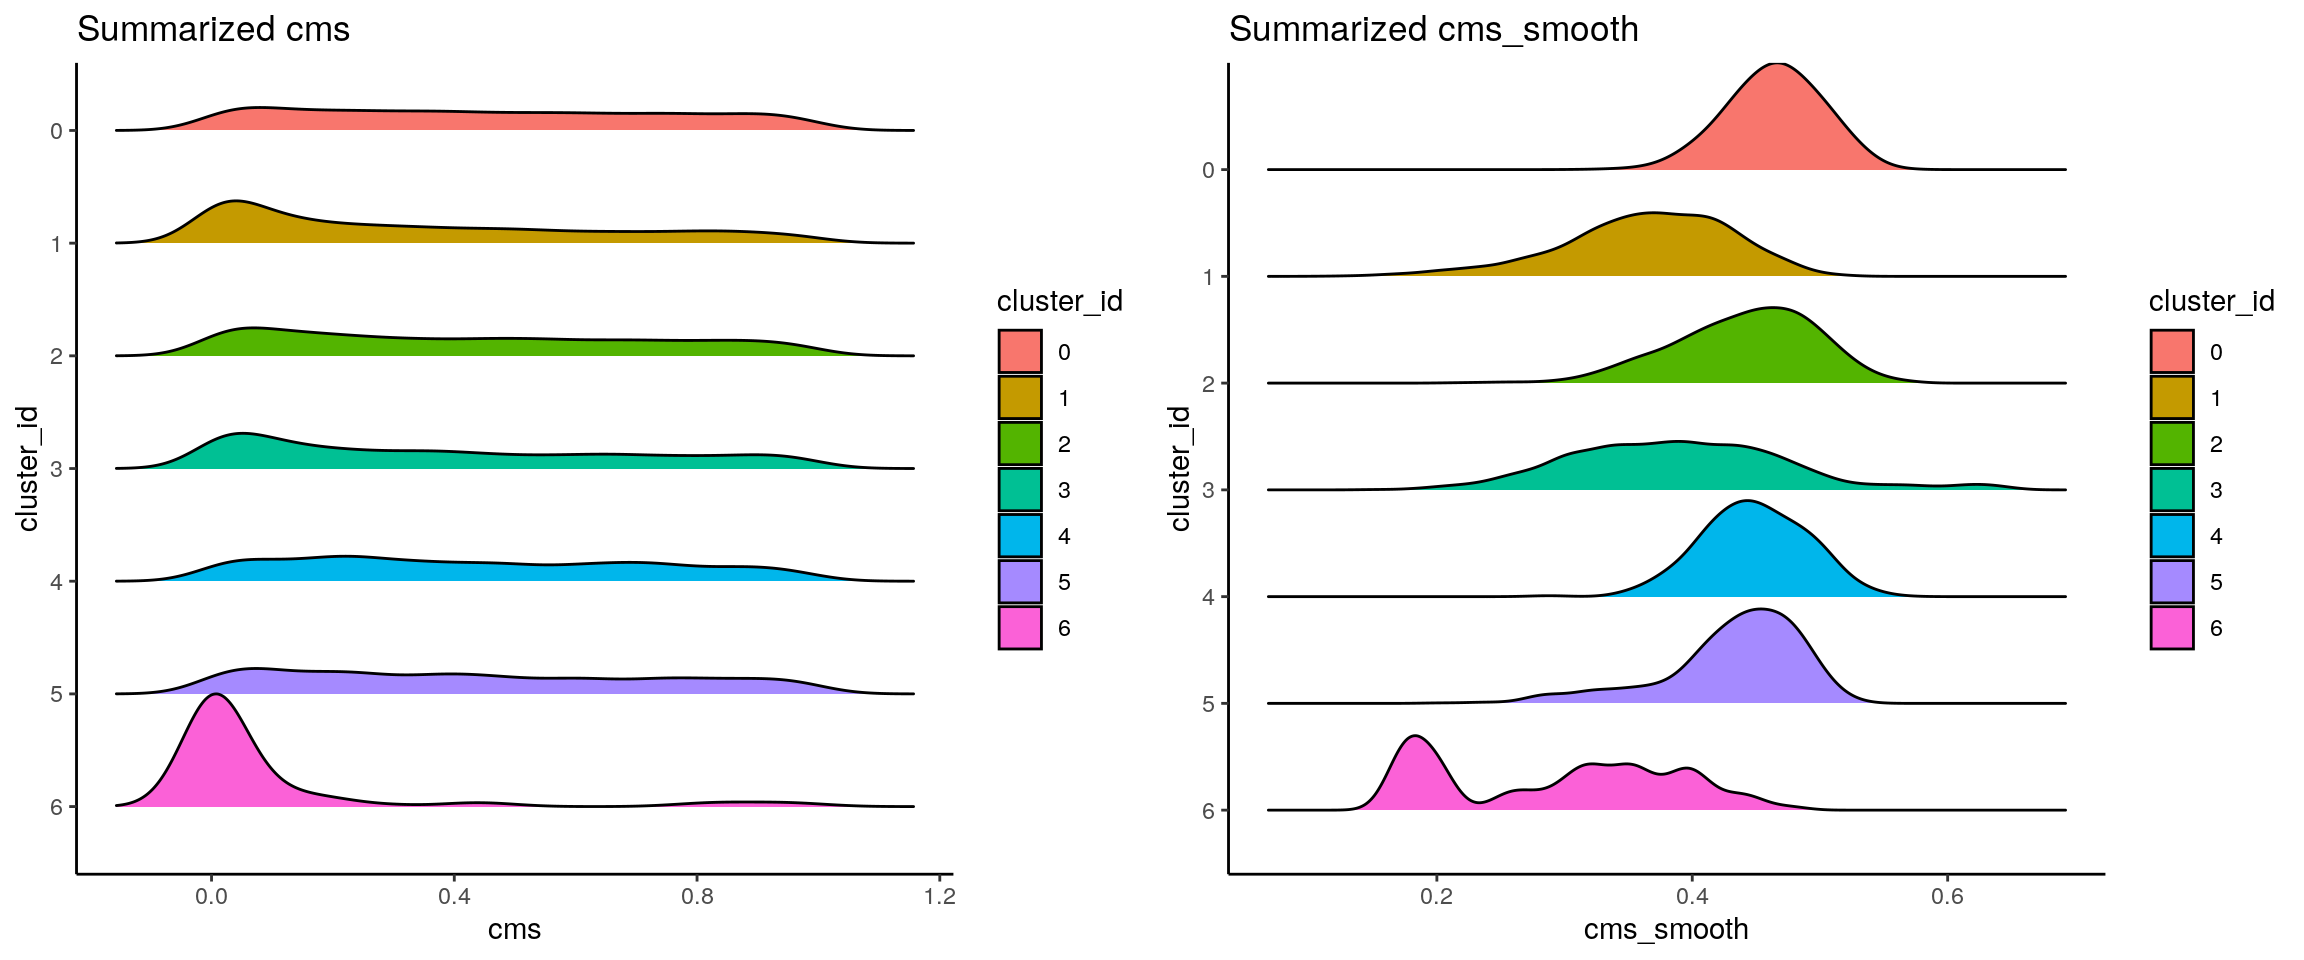
| Version | Author | Date |
|---|---|---|
| 4c53085 | khembach | 2021-08-27 |
We also test how well the two datasets are integrated with the Local Density Differences (ldfDiff) metric. In an optimal case relative densities (according to the same set of cells) should not change by integration and the ldfDiff score should be close to 0. In general the overall distribution of ldfDiff should be centered around 0 without long tails.
sce_int <- as.SingleCellExperiment(so, assay = "integrated")
colData(sce_int) <- as.data.frame(colData(sce_int)) %>%
    mutate_if(is.character, as.factor) %>%
    DataFrame(row.names = colnames(sce_int))

sce_pre_list <- list("P22" = sce[,sce$group_id == "P22"],
                     "NES" = sce[,sce$group_id == "NES"])
## remove dimension reduction from integrated data
sce_pre_list <- lapply(sce_pre_list, function(x) {reducedDims(x) <- NULL; x})

sce_int <- ldfDiff(sce_pre_list, sce_combined = sce_int, group = "group_id",
               k = 7, dim_red = "PCA", dim_combined = "PCA",
               assay_pre = "logcounts", assay_combined = "logcounts",
               n_dim = 3, res_name = "Seurat")

visIntegration(sce_int, metric = "diff_ldf", metric_name = "ldfDiff") 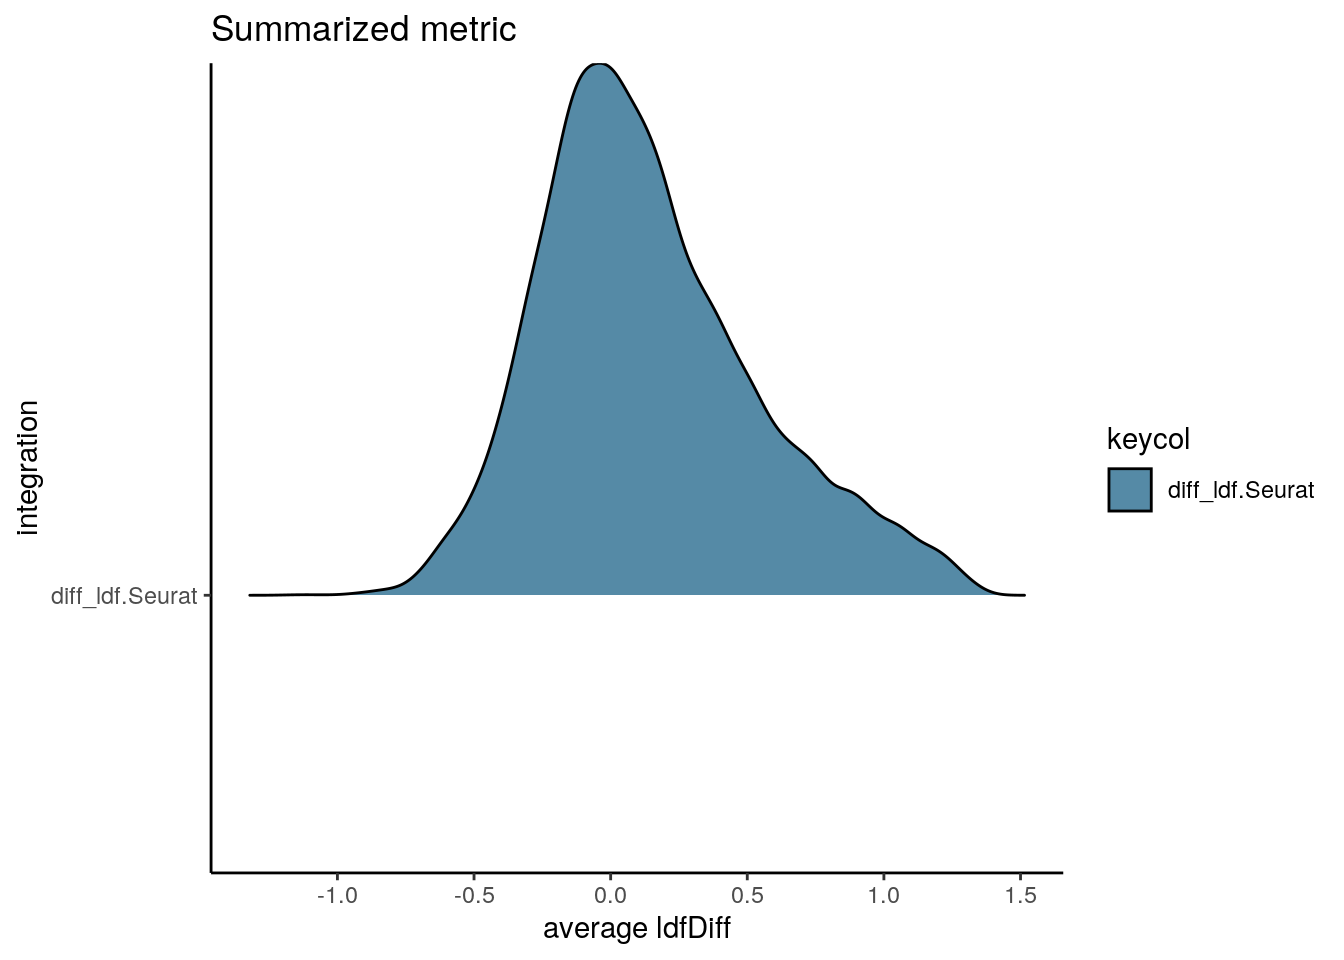
| Version | Author | Date |
|---|---|---|
| 4c53085 | khembach | 2021-08-27 |
sessionInfo()R version 4.0.5 (2021-03-31)
Platform: x86_64-pc-linux-gnu (64-bit)
Running under: Ubuntu 18.04.5 LTS
Matrix products: default
BLAS: /usr/local/R/R-4.0.5/lib/libRblas.so
LAPACK: /usr/local/R/R-4.0.5/lib/libRlapack.so
locale:
[1] LC_CTYPE=en_US.UTF-8 LC_NUMERIC=C
[3] LC_TIME=en_US.UTF-8 LC_COLLATE=en_US.UTF-8
[5] LC_MONETARY=en_US.UTF-8 LC_MESSAGES=en_US.UTF-8
[7] LC_PAPER=en_US.UTF-8 LC_NAME=C
[9] LC_ADDRESS=C LC_TELEPHONE=C
[11] LC_MEASUREMENT=en_US.UTF-8 LC_IDENTIFICATION=C
attached base packages:
[1] parallel stats4 grid stats graphics grDevices utils
[8] datasets methods base
other attached packages:
[1] CellMixS_1.4.2 kSamples_1.2-9
[3] SuppDists_1.1-9.5 BiocParallel_1.22.0
[5] RCurl_1.98-1.3 stringr_1.4.0
[7] SeuratObject_4.0.1 Seurat_4.0.1
[9] scran_1.16.0 SingleCellExperiment_1.10.1
[11] SummarizedExperiment_1.18.1 DelayedArray_0.14.0
[13] matrixStats_0.56.0 Biobase_2.48.0
[15] GenomicRanges_1.40.0 GenomeInfoDb_1.24.2
[17] IRanges_2.22.2 S4Vectors_0.26.1
[19] BiocGenerics_0.34.0 viridis_0.5.1
[21] viridisLite_0.3.0 RColorBrewer_1.1-2
[23] purrr_0.3.4 muscat_1.2.1
[25] dplyr_1.0.2 ggplot2_3.3.2
[27] cowplot_1.0.0 ComplexHeatmap_2.4.2
[29] workflowr_1.6.2
loaded via a namespace (and not attached):
[1] reticulate_1.16 tidyselect_1.1.0
[3] lme4_1.1-23 RSQLite_2.2.0
[5] AnnotationDbi_1.50.1 htmlwidgets_1.5.1
[7] Rtsne_0.15 munsell_0.5.0
[9] codetools_0.2-16 ica_1.0-2
[11] statmod_1.4.34 future_1.17.0
[13] miniUI_0.1.1.1 withr_2.4.1
[15] colorspace_1.4-1 knitr_1.29
[17] ROCR_1.0-11 tensor_1.5
[19] listenv_0.8.0 labeling_0.3
[21] git2r_0.27.1 GenomeInfoDbData_1.2.3
[23] polyclip_1.10-0 farver_2.0.3
[25] bit64_0.9-7 glmmTMB_1.0.2.1
[27] rprojroot_1.3-2 vctrs_0.3.4
[29] generics_0.0.2 xfun_0.15
[31] R6_2.4.1 doParallel_1.0.15
[33] ggbeeswarm_0.6.0 clue_0.3-57
[35] rsvd_1.0.3 locfit_1.5-9.4
[37] spatstat.utils_2.1-0 bitops_1.0-6
[39] cachem_1.0.4 promises_1.1.1
[41] scales_1.1.1 beeswarm_0.2.3
[43] gtable_0.3.0 globals_0.12.5
[45] goftest_1.2-2 rlang_0.4.10
[47] genefilter_1.70.0 GlobalOptions_0.1.2
[49] splines_4.0.5 TMB_1.7.16
[51] lazyeval_0.2.2 spatstat.geom_2.1-0
[53] abind_1.4-5 yaml_2.2.1
[55] reshape2_1.4.4 backports_1.1.9
[57] httpuv_1.5.4 tools_4.0.5
[59] spatstat.core_2.1-2 ellipsis_0.3.1
[61] gplots_3.0.4 ggridges_0.5.2
[63] Rcpp_1.0.5 plyr_1.8.6
[65] progress_1.2.2 zlibbioc_1.34.0
[67] prettyunits_1.1.1 rpart_4.1-15
[69] deldir_0.2-10 pbapply_1.4-2
[71] GetoptLong_1.0.1 zoo_1.8-8
[73] ggrepel_0.8.2 cluster_2.1.0
[75] colorRamps_2.3 fs_1.5.0
[77] variancePartition_1.18.2 magrittr_1.5
[79] data.table_1.12.8 scattermore_0.7
[81] lmerTest_3.1-2 circlize_0.4.10
[83] lmtest_0.9-37 RANN_2.6.1
[85] whisker_0.4 fitdistrplus_1.1-1
[87] hms_0.5.3 patchwork_1.0.1
[89] mime_0.9 evaluate_0.14
[91] xtable_1.8-4 pbkrtest_0.4-8.6
[93] XML_3.99-0.4 gridExtra_2.3
[95] shape_1.4.4 compiler_4.0.5
[97] scater_1.16.2 tibble_3.0.3
[99] KernSmooth_2.23-17 crayon_1.3.4
[101] minqa_1.2.4 htmltools_0.5.0
[103] mgcv_1.8-31 later_1.1.0.1
[105] tidyr_1.1.0 geneplotter_1.66.0
[107] DBI_1.1.0 MASS_7.3-51.6
[109] rappdirs_0.3.1 boot_1.3-25
[111] Matrix_1.3-3 gdata_2.18.0
[113] igraph_1.2.5 pkgconfig_2.0.3
[115] numDeriv_2016.8-1.1 spatstat.sparse_2.0-0
[117] plotly_4.9.2.1 foreach_1.5.0
[119] annotate_1.66.0 vipor_0.4.5
[121] dqrng_0.2.1 blme_1.0-4
[123] XVector_0.28.0 digest_0.6.25
[125] sctransform_0.3.2 RcppAnnoy_0.0.18
[127] spatstat.data_2.1-0 rmarkdown_2.3
[129] leiden_0.3.3 uwot_0.1.10
[131] edgeR_3.30.3 DelayedMatrixStats_1.10.1
[133] shiny_1.5.0 gtools_3.8.2
[135] rjson_0.2.20 nloptr_1.2.2.2
[137] lifecycle_1.0.0 nlme_3.1-148
[139] jsonlite_1.7.2 BiocNeighbors_1.6.0
[141] limma_3.44.3 pillar_1.4.6
[143] lattice_0.20-41 fastmap_1.0.1
[145] httr_1.4.2 survival_3.2-3
[147] glue_1.4.2 png_0.1-7
[149] iterators_1.0.12 bit_1.1-15.2
[151] stringi_1.4.6 blob_1.2.1
[153] DESeq2_1.28.1 BiocSingular_1.4.0
[155] caTools_1.18.0 memoise_2.0.0
[157] irlba_2.3.3 future.apply_1.6.0