Cluster analysis of cell hashing test experiment
Katharina Hembach
5/19/2021
Last updated: 2021-05-19
Checks: 7 0
Knit directory: neural_scRNAseq/
This reproducible R Markdown analysis was created with workflowr (version 1.6.2). The Checks tab describes the reproducibility checks that were applied when the results were created. The Past versions tab lists the development history.
Great! Since the R Markdown file has been committed to the Git repository, you know the exact version of the code that produced these results.
Great job! The global environment was empty. Objects defined in the global environment can affect the analysis in your R Markdown file in unknown ways. For reproduciblity it's best to always run the code in an empty environment.
The command set.seed(20200522) was run prior to running the code in the R Markdown file. Setting a seed ensures that any results that rely on randomness, e.g. subsampling or permutations, are reproducible.
Great job! Recording the operating system, R version, and package versions is critical for reproducibility.
Nice! There were no cached chunks for this analysis, so you can be confident that you successfully produced the results during this run.
Great job! Using relative paths to the files within your workflowr project makes it easier to run your code on other machines.
Great! You are using Git for version control. Tracking code development and connecting the code version to the results is critical for reproducibility.
The results in this page were generated with repository version 83f986d. See the Past versions tab to see a history of the changes made to the R Markdown and HTML files.
Note that you need to be careful to ensure that all relevant files for the analysis have been committed to Git prior to generating the results (you can use wflow_publish or wflow_git_commit). workflowr only checks the R Markdown file, but you know if there are other scripts or data files that it depends on. Below is the status of the Git repository when the results were generated:
Ignored files:
    Ignored:    .DS_Store
    Ignored:    .Rhistory
    Ignored:    .Rproj.user/
    Ignored:    ._.DS_Store
    Ignored:    ._Filtered.pdf
    Ignored:    ._Rplots.pdf
    Ignored:    ._Unfiltered.pdf
    Ignored:    .__workflowr.yml
    Ignored:    ._coverage.pdf
    Ignored:    ._coverage_sashimi.pdf
    Ignored:    ._coverage_sashimi.png
    Ignored:    ._neural_scRNAseq.Rproj
    Ignored:    ._pbDS_cell_level.pdf
    Ignored:    ._pbDS_top_expr_umap.pdf
    Ignored:    ._pbDS_upset.pdf
    Ignored:    ._sashimi.pdf
    Ignored:    ._stmn2.pdf
    Ignored:    ._tdp.pdf
    Ignored:    analysis/.DS_Store
    Ignored:    analysis/.Rhistory
    Ignored:    analysis/._.DS_Store
    Ignored:    analysis/._01-preprocessing.Rmd
    Ignored:    analysis/._01-preprocessing.html
    Ignored:    analysis/._02.1-SampleQC.Rmd
    Ignored:    analysis/._03-filtering.Rmd
    Ignored:    analysis/._04-clustering.Rmd
    Ignored:    analysis/._04-clustering.knit.md
    Ignored:    analysis/._04.1-cell_cycle.Rmd
    Ignored:    analysis/._05-annotation.Rmd
    Ignored:    analysis/._07-cluster-analysis-all-timepoints.Rmd
    Ignored:    analysis/._Lam-0-NSC_no_integration.Rmd
    Ignored:    analysis/._Lam-01-NSC_integration.Rmd
    Ignored:    analysis/._Lam-02-NSC_annotation.Rmd
    Ignored:    analysis/._NSC-1-clustering.Rmd
    Ignored:    analysis/._NSC-2-annotation.Rmd
    Ignored:    analysis/.__site.yml
    Ignored:    analysis/._additional_filtering.Rmd
    Ignored:    analysis/._additional_filtering_clustering.Rmd
    Ignored:    analysis/._index.Rmd
    Ignored:    analysis/._organoid-01-1-qualtiy-control.Rmd
    Ignored:    analysis/._organoid-01-clustering.Rmd
    Ignored:    analysis/._organoid-02-integration.Rmd
    Ignored:    analysis/._organoid-03-cluster_analysis.Rmd
    Ignored:    analysis/._organoid-04-group_integration.Rmd
    Ignored:    analysis/._organoid-04-stage_integration.Rmd
    Ignored:    analysis/._organoid-05-group_integration_cluster_analysis.Rmd
    Ignored:    analysis/._organoid-05-stage_integration_cluster_analysis.Rmd
    Ignored:    analysis/._organoid-06-1-prepare-sce.Rmd
    Ignored:    analysis/._organoid-06-conos-analysis-Seurat.Rmd
    Ignored:    analysis/._organoid-06-conos-analysis-function.Rmd
    Ignored:    analysis/._organoid-06-conos-analysis.Rmd
    Ignored:    analysis/._organoid-06-group-integration-conos-analysis.Rmd
    Ignored:    analysis/._organoid-07-conos-visualization.Rmd
    Ignored:    analysis/._organoid-07-group-integration-conos-visualization.Rmd
    Ignored:    analysis/._organoid-08-conos-comparison.Rmd
    Ignored:    analysis/._organoid-0x-sample_integration.Rmd
    Ignored:    analysis/01-preprocessing_cache/
    Ignored:    analysis/02-1-SampleQC_cache/
    Ignored:    analysis/02-quality_control_cache/
    Ignored:    analysis/02.1-SampleQC_cache/
    Ignored:    analysis/03-filtering_cache/
    Ignored:    analysis/04-clustering_cache/
    Ignored:    analysis/04.1-cell_cycle_cache/
    Ignored:    analysis/05-annotation_cache/
    Ignored:    analysis/06-clustering-all-timepoints_cache/
    Ignored:    analysis/07-cluster-analysis-all-timepoints_cache/
    Ignored:    analysis/CH-test-01-preprocessing_cache/
    Ignored:    analysis/CH-test-02-transgene-expression_cache/
    Ignored:    analysis/Lam-01-NSC_integration_cache/
    Ignored:    analysis/Lam-02-NSC_annotation_cache/
    Ignored:    analysis/NSC-1-clustering_cache/
    Ignored:    analysis/NSC-2-annotation_cache/
    Ignored:    analysis/TDP-01-preprocessing_cache/
    Ignored:    analysis/TDP-02-quality_control_cache/
    Ignored:    analysis/TDP-03-filtering_cache/
    Ignored:    analysis/TDP-04-clustering_cache/
    Ignored:    analysis/TDP-05-00-filtering-plasmid-QC_cache/
    Ignored:    analysis/TDP-05-plasmid_expression_cache/
    Ignored:    analysis/TDP-06-cluster_analysis_cache/
    Ignored:    analysis/TDP-07-01-STMN2_expression_cache/
    Ignored:    analysis/TDP-07-cluster_12_cache/
    Ignored:    analysis/TDP-08-00-clustering-HA-D96_cache/
    Ignored:    analysis/TDP-08-01-HA-D96-expression-changes_cache/
    Ignored:    analysis/TDP-08-02-TDP_target_genes_cache/
    Ignored:    analysis/TDP-08-clustering-timeline-HA_cache/
    Ignored:    analysis/additional_filtering_cache/
    Ignored:    analysis/additional_filtering_clustering_cache/
    Ignored:    analysis/organoid-01-1-qualtiy-control_cache/
    Ignored:    analysis/organoid-01-clustering_cache/
    Ignored:    analysis/organoid-02-integration_cache/
    Ignored:    analysis/organoid-03-cluster_analysis_cache/
    Ignored:    analysis/organoid-04-group_integration_cache/
    Ignored:    analysis/organoid-04-stage_integration_cache/
    Ignored:    analysis/organoid-05-group_integration_cluster_analysis_cache/
    Ignored:    analysis/organoid-05-stage_integration_cluster_analysis_cache/
    Ignored:    analysis/organoid-06-conos-analysis_cache/
    Ignored:    analysis/organoid-06-conos-analysis_test_cache/
    Ignored:    analysis/organoid-06-group-integration-conos-analysis_cache/
    Ignored:    analysis/organoid-07-conos-visualization_cache/
    Ignored:    analysis/organoid-07-group-integration-conos-visualization_cache/
    Ignored:    analysis/organoid-08-conos-comparison_cache/
    Ignored:    analysis/organoid-0x-sample_integration_cache/
    Ignored:    analysis/sample5_QC_cache/
    Ignored:    analysis/timepoints-01-organoid-integration_cache/
    Ignored:    analysis/timepoints-02-cluster-analysis_cache/
    Ignored:    data/.DS_Store
    Ignored:    data/._.DS_Store
    Ignored:    data/._.smbdeleteAAA17ed8b4b
    Ignored:    data/._Lam_figure2_markers.R
    Ignored:    data/._README.md
    Ignored:    data/._Reactive_astrocytes_markers.xlsx
    Ignored:    data/._known_NSC_markers.R
    Ignored:    data/._known_cell_type_markers.R
    Ignored:    data/._metadata.csv
    Ignored:    data/._virus_cell_tropism_markers.R
    Ignored:    data/._~$Reactive_astrocytes_markers.xlsx
    Ignored:    data/data_sushi/
    Ignored:    data/filtered_feature_matrices/
    Ignored:    output/.DS_Store
    Ignored:    output/._.DS_Store
    Ignored:    output/._NSC_cluster2_marker_genes.txt
    Ignored:    output/._TDP-06-no_integration_cluster12_marker_genes.txt
    Ignored:    output/._TDP-06-no_integration_cluster13_marker_genes.txt
    Ignored:    output/._organoid_integration_cluster1_marker_genes.txt
    Ignored:    output/._tbl_TDP-08-01-muscat_cluster_0.txt
    Ignored:    output/._tbl_TDP-08-01-muscat_cluster_1.txt
    Ignored:    output/._tbl_TDP-08-01-muscat_cluster_10.txt
    Ignored:    output/._tbl_TDP-08-01-muscat_cluster_11.txt
    Ignored:    output/._tbl_TDP-08-01-muscat_cluster_12.txt
    Ignored:    output/._tbl_TDP-08-01-muscat_cluster_13.txt
    Ignored:    output/._tbl_TDP-08-01-muscat_cluster_14.txt
    Ignored:    output/._tbl_TDP-08-01-muscat_cluster_5.txt
    Ignored:    output/._tbl_TDP-08-01-muscat_cluster_7.txt
    Ignored:    output/._tbl_TDP-08-01-muscat_cluster_8.txt
    Ignored:    output/._tbl_TDP-08-01-muscat_cluster_all.xlsx
    Ignored:    output/._tbl_TDP-08-02-targets_hek_cluster_0.txt
    Ignored:    output/._tbl_TDP-08-02-targets_hek_cluster_1.txt
    Ignored:    output/._tbl_TDP-08-02-targets_hek_cluster_10.txt
    Ignored:    output/._tbl_TDP-08-02-targets_hek_cluster_11.txt
    Ignored:    output/._tbl_TDP-08-02-targets_hek_cluster_12.txt
    Ignored:    output/._tbl_TDP-08-02-targets_hek_cluster_13.txt
    Ignored:    output/._tbl_TDP-08-02-targets_hek_cluster_14.txt
    Ignored:    output/._tbl_TDP-08-02-targets_hek_cluster_5.txt
    Ignored:    output/._tbl_TDP-08-02-targets_hek_cluster_7.txt
    Ignored:    output/._tbl_TDP-08-02-targets_hek_cluster_8.txt
    Ignored:    output/._tbl_TDP-08-02-targets_hek_cluster_all.xlsx
    Ignored:    output/._~$tbl_TDP-08-02-targets_hek_cluster_all.xlsx
    Ignored:    output/CH-test-01-preprocessing.rds
    Ignored:    output/CH-test-01-preprocessing_singlets.rds
    Ignored:    output/CH-test-01-preprocessing_singlets_filtered.rds
    Ignored:    output/CH-test-01-preprocessing_so.rds
    Ignored:    output/CH-test-01-preprocessing_so_filtered.rds
    Ignored:    output/CH-test-03-cluster-analysis_so.rds
    Ignored:    output/CH-test-03_scran_markers.rds
    Ignored:    output/Lam-01-clustering.rds
    Ignored:    output/NSC_1_clustering.rds
    Ignored:    output/NSC_cluster1_marker_genes.txt
    Ignored:    output/NSC_cluster2_marker_genes.txt
    Ignored:    output/NSC_cluster3_marker_genes.txt
    Ignored:    output/NSC_cluster4_marker_genes.txt
    Ignored:    output/NSC_cluster5_marker_genes.txt
    Ignored:    output/NSC_cluster6_marker_genes.txt
    Ignored:    output/NSC_cluster7_marker_genes.txt
    Ignored:    output/TDP-06-no_integration_cluster0_marker_genes.txt
    Ignored:    output/TDP-06-no_integration_cluster10_marker_genes.txt
    Ignored:    output/TDP-06-no_integration_cluster11_marker_genes.txt
    Ignored:    output/TDP-06-no_integration_cluster12_marker_genes.txt
    Ignored:    output/TDP-06-no_integration_cluster13_marker_genes.txt
    Ignored:    output/TDP-06-no_integration_cluster14_marker_genes.txt
    Ignored:    output/TDP-06-no_integration_cluster15_marker_genes.txt
    Ignored:    output/TDP-06-no_integration_cluster16_marker_genes.txt
    Ignored:    output/TDP-06-no_integration_cluster17_marker_genes.txt
    Ignored:    output/TDP-06-no_integration_cluster1_marker_genes.txt
    Ignored:    output/TDP-06-no_integration_cluster2_marker_genes.txt
    Ignored:    output/TDP-06-no_integration_cluster3_marker_genes.txt
    Ignored:    output/TDP-06-no_integration_cluster4_marker_genes.txt
    Ignored:    output/TDP-06-no_integration_cluster5_marker_genes.txt
    Ignored:    output/TDP-06-no_integration_cluster6_marker_genes.txt
    Ignored:    output/TDP-06-no_integration_cluster7_marker_genes.txt
    Ignored:    output/TDP-06-no_integration_cluster8_marker_genes.txt
    Ignored:    output/TDP-06-no_integration_cluster9_marker_genes.txt
    Ignored:    output/TDP-06_scran_markers.rds
    Ignored:    output/additional_filtering.rds
    Ignored:    output/conos/
    Ignored:    output/conos_organoid-06-conos-analysis.rds
    Ignored:    output/conos_organoid-06-group-integration-conos-analysis.rds
    Ignored:    output/figures/
    Ignored:    output/organoid_integration_cluster10_marker_genes.txt
    Ignored:    output/organoid_integration_cluster11_marker_genes.txt
    Ignored:    output/organoid_integration_cluster12_marker_genes.txt
    Ignored:    output/organoid_integration_cluster13_marker_genes.txt
    Ignored:    output/organoid_integration_cluster14_marker_genes.txt
    Ignored:    output/organoid_integration_cluster15_marker_genes.txt
    Ignored:    output/organoid_integration_cluster16_marker_genes.txt
    Ignored:    output/organoid_integration_cluster17_marker_genes.txt
    Ignored:    output/organoid_integration_cluster1_marker_genes.txt
    Ignored:    output/organoid_integration_cluster2_marker_genes.txt
    Ignored:    output/organoid_integration_cluster3_marker_genes.txt
    Ignored:    output/organoid_integration_cluster4_marker_genes.txt
    Ignored:    output/organoid_integration_cluster5_marker_genes.txt
    Ignored:    output/organoid_integration_cluster6_marker_genes.txt
    Ignored:    output/organoid_integration_cluster7_marker_genes.txt
    Ignored:    output/organoid_integration_cluster8_marker_genes.txt
    Ignored:    output/organoid_integration_cluster9_marker_genes.txt
    Ignored:    output/res_TDP-08-01-muscat.rds
    Ignored:    output/sce_01_preprocessing.rds
    Ignored:    output/sce_02_quality_control.rds
    Ignored:    output/sce_03_filtering.rds
    Ignored:    output/sce_03_filtering_all_genes.rds
    Ignored:    output/sce_06-1-prepare-sce.rds
    Ignored:    output/sce_TDP-08-01-muscat.rds
    Ignored:    output/sce_TDP_01_preprocessing.rds
    Ignored:    output/sce_TDP_02_quality_control.rds
    Ignored:    output/sce_TDP_03_filtering.rds
    Ignored:    output/sce_TDP_03_filtering_all_genes.rds
    Ignored:    output/sce_organoid-01-clustering.rds
    Ignored:    output/sce_preprocessing.rds
    Ignored:    output/so_04-stage_integration.rds
    Ignored:    output/so_04_1_cell_cycle.rds
    Ignored:    output/so_04_clustering.rds
    Ignored:    output/so_06-clustering_all_timepoints.rds
    Ignored:    output/so_08-00_clustering_HA_D96.rds
    Ignored:    output/so_08-clustering_timeline_HA.rds
    Ignored:    output/so_0x-sample_integration.rds
    Ignored:    output/so_CH-test-02-transgene_expression.rds
    Ignored:    output/so_TDP-06-cluster-analysis.rds
    Ignored:    output/so_TDP_04_clustering.rds
    Ignored:    output/so_TDP_05_plasmid_expression.rds
    Ignored:    output/so_additional_filtering_clustering.rds
    Ignored:    output/so_integrated_organoid-02-integration.rds
    Ignored:    output/so_merged_organoid-02-integration.rds
    Ignored:    output/so_organoid-01-clustering.rds
    Ignored:    output/so_sample_organoid-01-clustering.rds
    Ignored:    output/so_timepoints-01-organoid_integration.rds
    Ignored:    output/tbl_TDP-08-01-muscat.rds
    Ignored:    output/tbl_TDP-08-01-muscat_cluster_0.txt
    Ignored:    output/tbl_TDP-08-01-muscat_cluster_1.txt
    Ignored:    output/tbl_TDP-08-01-muscat_cluster_10.txt
    Ignored:    output/tbl_TDP-08-01-muscat_cluster_11.txt
    Ignored:    output/tbl_TDP-08-01-muscat_cluster_12.txt
    Ignored:    output/tbl_TDP-08-01-muscat_cluster_13.txt
    Ignored:    output/tbl_TDP-08-01-muscat_cluster_14.txt
    Ignored:    output/tbl_TDP-08-01-muscat_cluster_5.txt
    Ignored:    output/tbl_TDP-08-01-muscat_cluster_7.txt
    Ignored:    output/tbl_TDP-08-01-muscat_cluster_8.txt
    Ignored:    output/tbl_TDP-08-01-muscat_cluster_all.xlsx
    Ignored:    output/tbl_TDP-08-02-targets_hek.rds
    Ignored:    output/tbl_TDP-08-02-targets_hek_cluster_0.txt
    Ignored:    output/tbl_TDP-08-02-targets_hek_cluster_1.txt
    Ignored:    output/tbl_TDP-08-02-targets_hek_cluster_10.txt
    Ignored:    output/tbl_TDP-08-02-targets_hek_cluster_11.txt
    Ignored:    output/tbl_TDP-08-02-targets_hek_cluster_12.txt
    Ignored:    output/tbl_TDP-08-02-targets_hek_cluster_13.txt
    Ignored:    output/tbl_TDP-08-02-targets_hek_cluster_14.txt
    Ignored:    output/tbl_TDP-08-02-targets_hek_cluster_5.txt
    Ignored:    output/tbl_TDP-08-02-targets_hek_cluster_7.txt
    Ignored:    output/tbl_TDP-08-02-targets_hek_cluster_8.txt
    Ignored:    output/tbl_TDP-08-02-targets_hek_cluster_all.xlsx
    Ignored:    output/~$tbl_TDP-08-02-targets_hek_cluster_all.xlsx
    Ignored:    scripts/.DS_Store
    Ignored:    scripts/._.DS_Store
    Ignored:    scripts/._bu_Rcode.R
    Ignored:    scripts/._plasmid_expression.sh
    Ignored:    scripts/._plasmid_expression_cell_hashing_test.sh
    Ignored:    scripts/._prepare_salmon_transcripts.R

Untracked files:
    Untracked:  Filtered.pdf
    Untracked:  Rplots.pdf
    Untracked:  Unfiltered
    Untracked:  Unfiltered.pdf
    Untracked:  analysis/Lam-0-NSC_no_integration.Rmd
    Untracked:  analysis/TDP-07-01-STMN2_expression copy.Rmd
    Untracked:  analysis/additional_filtering.Rmd
    Untracked:  analysis/additional_filtering_clustering.Rmd
    Untracked:  analysis/organoid-01-1-qualtiy-control.Rmd
    Untracked:  analysis/organoid-06-conos-analysis-Seurat.Rmd
    Untracked:  analysis/organoid-06-conos-analysis-function.Rmd
    Untracked:  analysis/organoid-07-conos-visualization.Rmd
    Untracked:  analysis/organoid-07-group-integration-conos-visualization.Rmd
    Untracked:  analysis/organoid-08-conos-comparison.Rmd
    Untracked:  analysis/organoid-0x-sample_integration.Rmd
    Untracked:  analysis/sample5_QC.Rmd
    Untracked:  coverage.pdf
    Untracked:  coverage_sashimi.pdf
    Untracked:  coverage_sashimi.png
    Untracked:  data/Homo_sapiens.GRCh38.98.sorted.gtf
    Untracked:  data/Kanton_et_al/
    Untracked:  data/Lam_et_al/
    Untracked:  data/Sep2020/
    Untracked:  data/cell_hashing_test/
    Untracked:  data/cell_hashing_test_FB/
    Untracked:  data/reference/
    Untracked:  data/virus_cell_tropism_markers.R
    Untracked:  data/~$Reactive_astrocytes_markers.xlsx
    Untracked:  pbDS_cell_level.pdf
    Untracked:  pbDS_heatmap.pdf
    Untracked:  pbDS_top_expr_umap.pdf
    Untracked:  pbDS_upset.pdf
    Untracked:  sashimi.pdf
    Untracked:  scripts/bu_Rcode.R
    Untracked:  scripts/bu_code.Rmd
    Untracked:  scripts/plasmid_expression_cell_hashing_test.sh
    Untracked:  scripts/prepare_salmon_transcripts_cell_hashing_test.R
    Untracked:  scripts/salmon-latest_linux_x86_64/
    Untracked:  stmn2.pdf
    Untracked:  tdp.pdf

Unstaged changes:
    Modified:   analysis/05-annotation.Rmd
    Modified:   analysis/TDP-04-clustering.Rmd
    Modified:   analysis/TDP-08-01-HA-D96-expression-changes.Rmd
    Modified:   analysis/_site.yml
    Modified:   analysis/organoid-02-integration.Rmd
    Modified:   analysis/organoid-04-group_integration.Rmd
    Modified:   analysis/organoid-06-conos-analysis.Rmd
Note that any generated files, e.g. HTML, png, CSS, etc., are not included in this status report because it is ok for generated content to have uncommitted changes.
These are the previous versions of the repository in which changes were made to the R Markdown (analysis/CH-test-03-cluster-analysis.Rmd) and HTML (docs/CH-test-03-cluster-analysis.html) files. If you've configured a remote Git repository (see ?wflow_git_remote), click on the hyperlinks in the table below to view the files as they were in that past version.
| File | Version | Author | Date | Message |
|---|---|---|---|---|
| Rmd | 83f986d | khembach | 2021-05-19 | add heatmap of neuronal clusters and cluster 12 marker gene expression |
| Rmd | 29caa75 | khembach | 2021-05-19 | Merge branch 'master' of https://github.com/khembach/neural_scRNAseq |
| html | c425894 | khembach | 2021-05-19 | Build site. |
| Rmd | f04b0df | khembach | 2021-05-19 | add heatmap with relative sample abundance per cluster |
| Rmd | 7f5ea7a | khembach | 2021-05-19 | add heatmap with relative sample abundance per cluster |
| html | d55a2c2 | khembach | 2021-05-19 | Build site. |
| Rmd | ab048ce | khembach | 2021-05-19 | analyze clusters of cell hashing test experiment |
Load packages
library(ComplexHeatmap)
library(cowplot)
library(ggplot2)
library(dplyr)
library(muscat)
library(purrr)
library(RColorBrewer)
library(viridis)
library(scran)
library(Seurat)
library(SingleCellExperiment)
library(stringr)
Load data & convert to SCE
so <- readRDS(file.path("output", "so_CH-test-02-transgene_expression.rds"))
sce <- as.SingleCellExperiment(so, assay = "RNA")
colData(sce) <- as.data.frame(colData(sce)) %>%
    mutate_if(is.character, as.factor) %>%
    DataFrame(row.names = colnames(sce))
Number of clusters by resolution
cluster_cols <- grep("res.[0-9]", colnames(colData(sce)), value = TRUE)
sapply(colData(sce)[cluster_cols], nlevels)
RNA_snn_res.0.6 RNA_snn_res.0.2 RNA_snn_res.0.4 RNA_snn_res.0.8 RNA_snn_res.1
10 6 11 16 16 Cluster-sample counts
# set cluster IDs to resolution 0.4 clustering
so <- SetIdent(so, value = "RNA_snn_res.0.8")
so@meta.data$cluster_id <- Idents(so)
sce$cluster_id <- Idents(so)
(n_cells <- table(sce$cluster_id, sce$sample_id))
     GA50-EGFP HA-GA50 TDP-43-HA
  0        280     246       285
  1        155     135       212
  2        185     134       149
  3        208     138        63
  4         85      98       121
  5         93      93        98
  6         84      89        99
  7         96      66       108
  8        111      68        83
  9        115      61        41
  10       139      62         3
  11        53      50        51
  12        33      37        53
  13        39      34         7
  14         8      14        46
  15        15       4         5
Relative cluster-abundances
fqs <- prop.table(n_cells, margin = 2)
mat <- round(as.matrix(unclass(fqs))*100, 2)
colfunc <- colorRampPalette(c("ghostwhite", "deepskyblue4"))
Heatmap(mat,
    col = colfunc(10),
    name = "Percentage\nof cells",
    cluster_rows = FALSE,
    cluster_columns = FALSE,
    row_names_side = "left",
    row_title = "cluster ID",
    column_title = "sample ID",
    column_title_side = "bottom",
    rect_gp = gpar(col = "white"),
    cell_fun = function(i, j, x, y, width, height, fill)
        grid.text(mat[j, i], x = x, y = y,
            gp = gpar(col = "black", fontsize = 10)))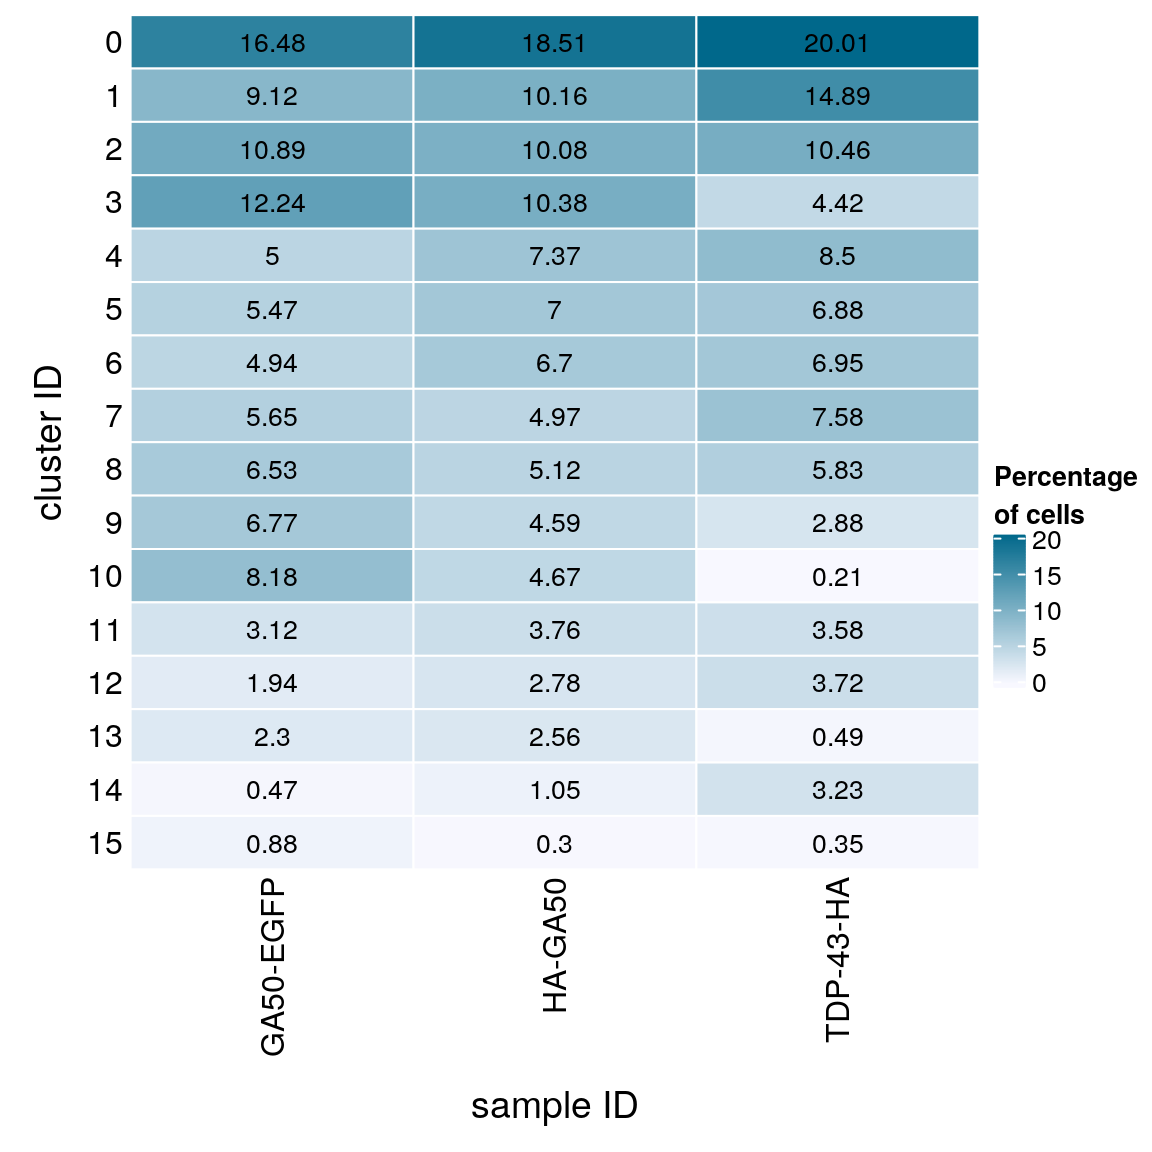
(n_cells <- table(sce$sample_id, sce$cluster_id))
              0   1   2   3   4   5   6   7   8   9  10  11  12  13  14  15
  GA50-EGFP 280 155 185 208  85  93  84  96 111 115 139  53  33  39   8  15
  HA-GA50   246 135 134 138  98  93  89  66  68  61  62  50  37  34  14   4
  TDP-43-HA 285 212 149  63 121  98  99 108  83  41   3  51  53   7  46   5
fqs <- prop.table(n_cells, margin = 2)
mat <- round(as.matrix(unclass(fqs))*100, 2)
Heatmap(mat,
col = colfunc(10),
name = "Percentage\nof cells",
cluster_rows = FALSE,
cluster_columns = FALSE,
row_names_side = "left",
row_title = "sample ID",
column_title = "cluster ID",
column_title_side = "bottom",
rect_gp = gpar(col = "white"),
cell_fun = function(i, j, x, y, width, height, fill)
grid.text(mat[j, i], x = x, y = y,
gp = gpar(col = "black", fontsize = 10)))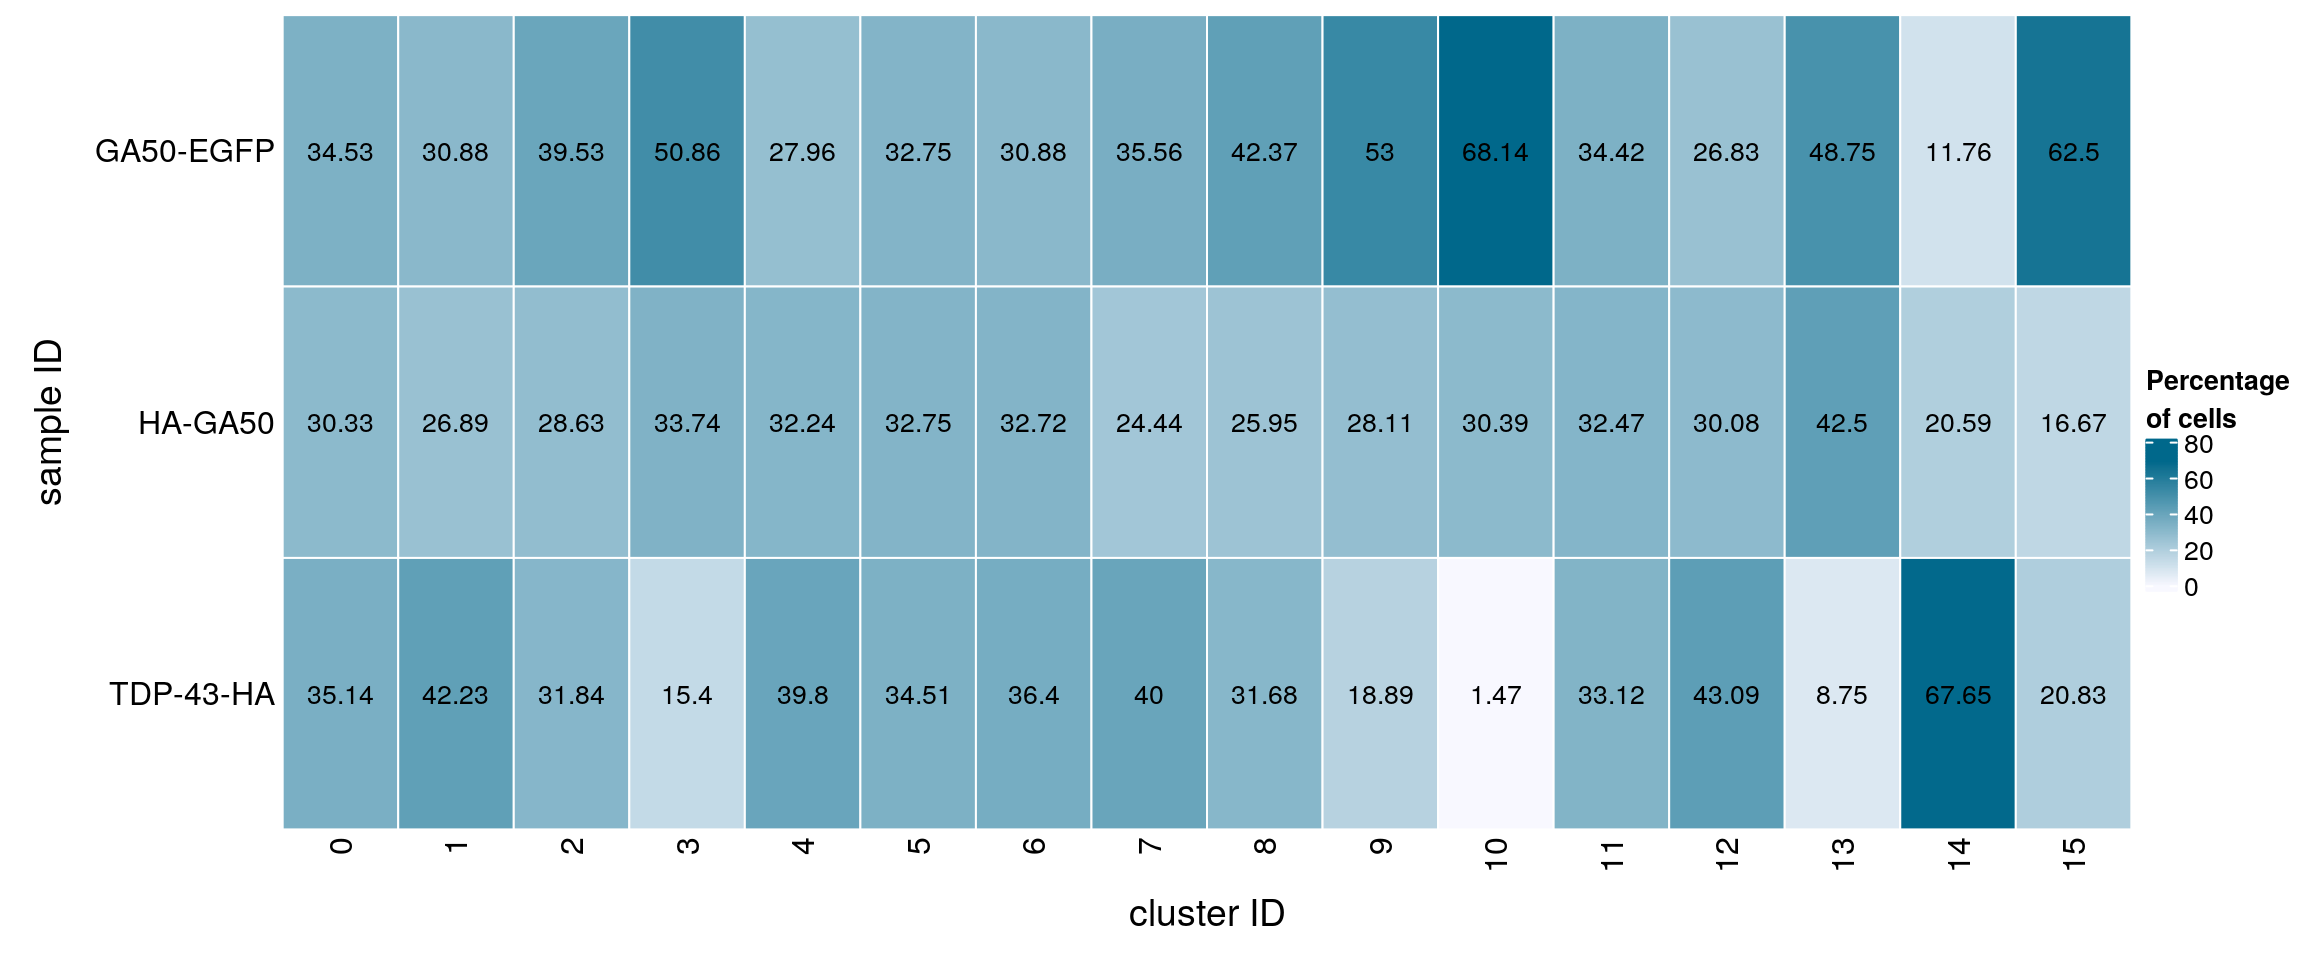
| Version | Author | Date |
|---|---|---|
| c425894 | khembach | 2021-05-19 |
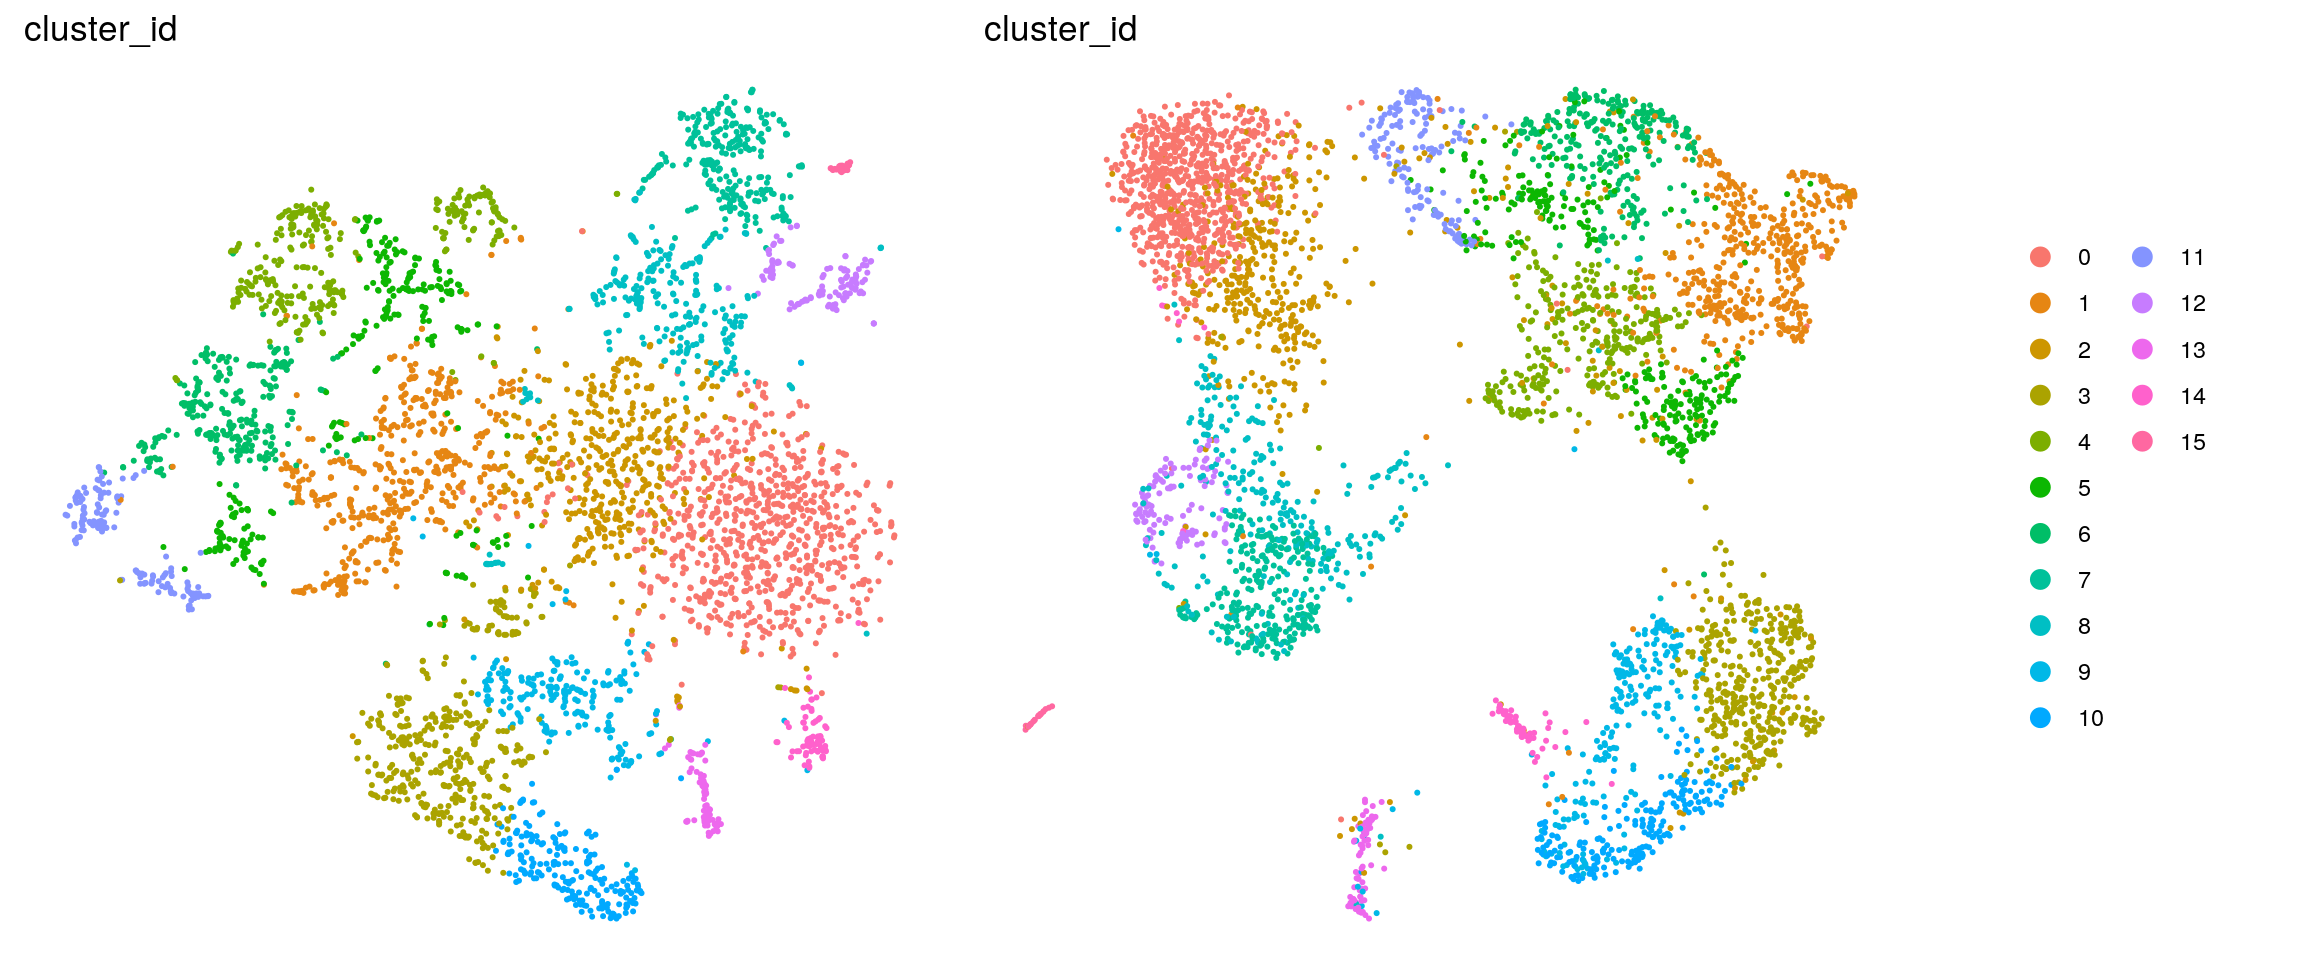
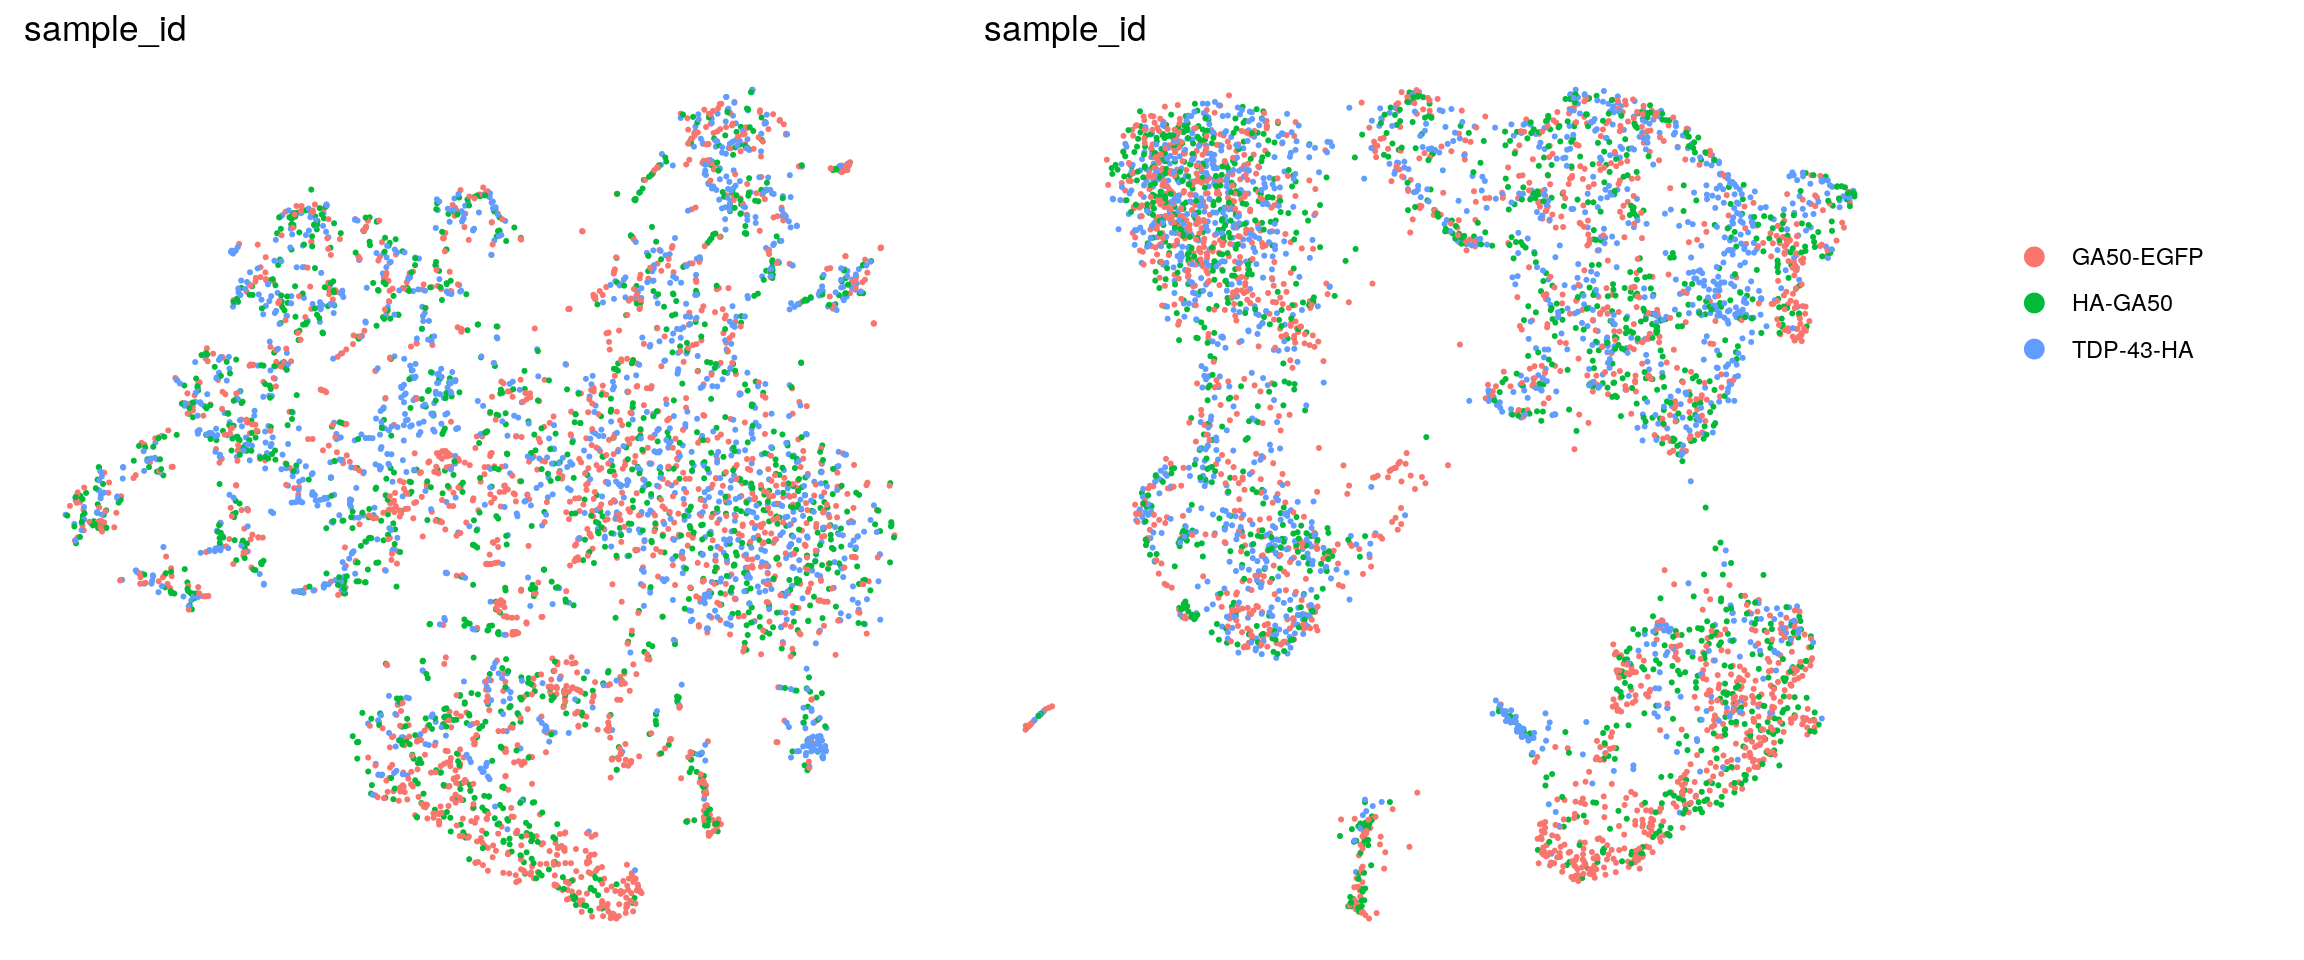
DR colored by cluster ID
.plot_dr <- function(so, dr, id)
    DimPlot(so, group.by = id, reduction = dr, pt.size = 0.4) +
        guides(col = guide_legend(nrow = 11,
            override.aes = list(size = 3, alpha = 1))) +
        theme_void() + theme(aspect.ratio = 1)
ids <- c("cluster_id", "sample_id")
for (id in ids) {
    cat("## ", id, "\n")
    p1 <- .plot_dr(so, "tsne", id)
    lgd <- get_legend(p1)
    p1 <- p1 + theme(legend.position = "none")
    p2 <- .plot_dr(so, "umap", id) + theme(legend.position = "none")
    ps <- plot_grid(plotlist = list(p1, p2), nrow = 1)
    p <- plot_grid(ps, lgd, nrow = 1, rel_widths = c(1, 0.2))
    print(p)
    cat("\n\n")
}
Find markers using scran
Markers
We identify candidate marker genes for each cluster that enable a separation of that group from any other group. The null hypothesis is that the log FC between a cluster and the compared cluster is 2.
scran_markers <- findMarkers(sce,
    groups = sce$cluster_id, direction = "up", lfc = 2,
    full.stats = TRUE, log.p = FALSE)
Heatmap of mean marker-exprs. by cluster
We aggregate the cells to pseudobulks and plot the average expression of the condidate marker genes in each of the clusters.
## including marker genes of rank 1 and 2
gs <- lapply(scran_markers, function(u) rownames(u)[u$Top %in% 1:2])
## candidate cluster markers
lapply(gs, function(x) {
  y <- str_split(x, pattern = "\\.", simplify = TRUE)[,2]
  y[which(y == "")] <- x[which(y == "")]
  y
  })
$`0`
[1] "RTN4" "VGF" "STMN2" "RPLP1" "TMSB4X"
[6] "MT-RNR2" "GAP43" "TAC1" "RPS24" "FTH1"
[11] "MT-ATP6" "STMN2-alevin"
$`1`
[1] "VGF" "WSB1" "MT-RNR2" "SCG2" "DST" "STMN2" "ANK3"
[8] "MT-RNR1" "MT-ATP6"
$`2`
[1] "VGF" "STMN2" "VIM" "FTL" "MT-RNR2" "MT-ATP6" "MT-ND5"
[8] "RPL32" "RPL34" "MT-RNR1" "MT-ND1" "MT-CO3"
$`3`
[1] "TUBB" "CLU" "DYNC2H1" "CST3" "PCP4"
[6] "STMN2-alevin" "NSG2" "NPTX2" "STMN2" "RPL7A"
[11] "RPLP1"
$`4`
[1] "PNOC" "RTN1" "CRABP1" "STMN2-alevin" "MLLT11"
[6] "SPP1" "SCRG1" "STMN2" "RPS13" "TUBA1A"
[11] "PCP4"
$`5`
[1] "S100A10" "IGFBP5" "STMN2-alevin" "SH3BGRL3" "TAC1"
[6] "STMN2" "B2M" "MT-RNR2"
$`6`
[1] "UTS2" "FABP7" "CRABP1" "STMN2-alevin" "RPS8"
[6] "SCG2" "TAC1" "STMN2" "TUBA1A" "RTN1"
$`7`
[1] "C1orf61" "SPARCL1" "SPP1" "VIM" "GFAP" "FABP5"
$`8`
[1] "C1orf61" "STMN2" "VIM" "MT-RNR2" "MT-ATP6"
[6] "STMN2-alevin"
$`9`
[1] "MAP2" "DST" "PLCG2" "WSB1" "MT-RNR2" "MT-CO2"
[7] "MT-ATP6" "TDP43-HA" "PCED1A" "MT-RNR1" "MT-ND2" "MT-ND4"
$`10`
[1] "SPOCK3" "CLU" "RPS13" "TDP43-HA" "STMN2-alevin"
[6] "SELENOK" "STMN2" "DYNC2H1" "TAC3"
$`11`
[1] "SH3BGRL3" "TAC1" "CRH" "STMN2-alevin" "STMN2"
[6] "TUBA1A"
$`12`
[1] "PTGDS" "VIM" "IFITM3" "DLK1" "B2M" "FTL"
$`13`
[1] "S100A16" "CLU" "TAC3" "CALB1" "APOE"
$`14`
[1] "PLCG2" "RSRP1" "CKS2" "MT-RNR2" "TDP43-HA"
$`15`
[1] "PTN" "VIM" "PCLAF" "S100A10" "C1orf61" "DBI" "HMGB2"
[8] "TUBA1B" sub <- sce[unique(unlist(gs)), ]
pbs <- aggregateData(sub, assay = "logcounts", by = "cluster_id", fun = "mean")
mat <- t(muscat:::.scale(assay(pbs)))
## remove the Ensembl ID from the gene names
cnames <- colnames(mat)
colnames(mat) <- str_split(cnames, pattern = "\\.", simplify = TRUE)[,2]
colnames(mat)[which(colnames(mat) == "")] <- cnames[which(colnames(mat) == "")]
Heatmap(mat,
name = "scaled avg.\nexpression",
col = viridis(10),
cluster_rows = FALSE,
cluster_columns = FALSE,
row_names_side = "left",
row_title = "cluster_id",
rect_gp = gpar(col = "white"))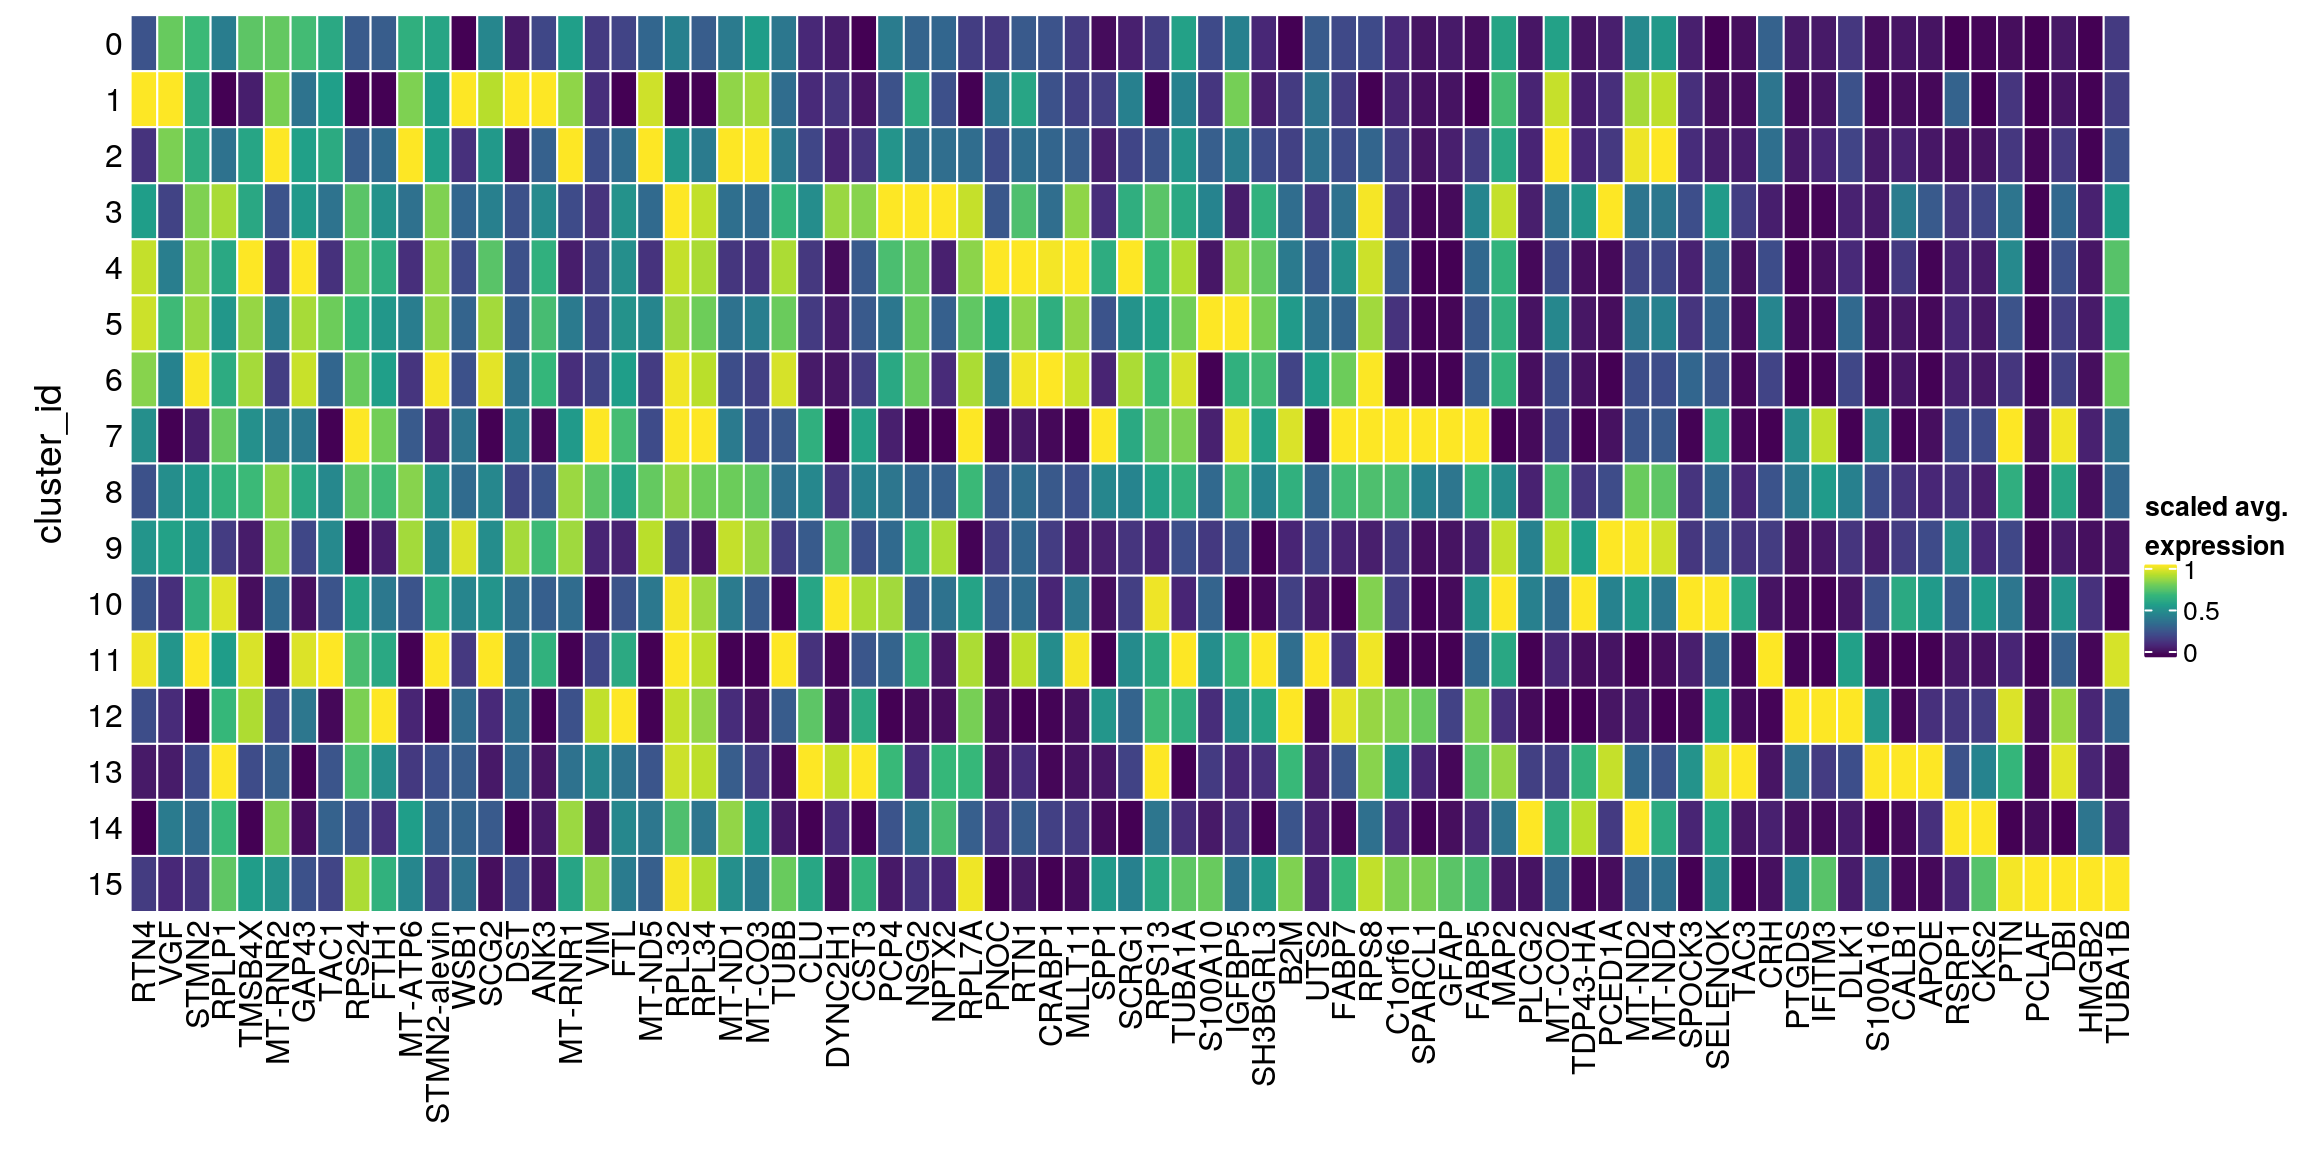
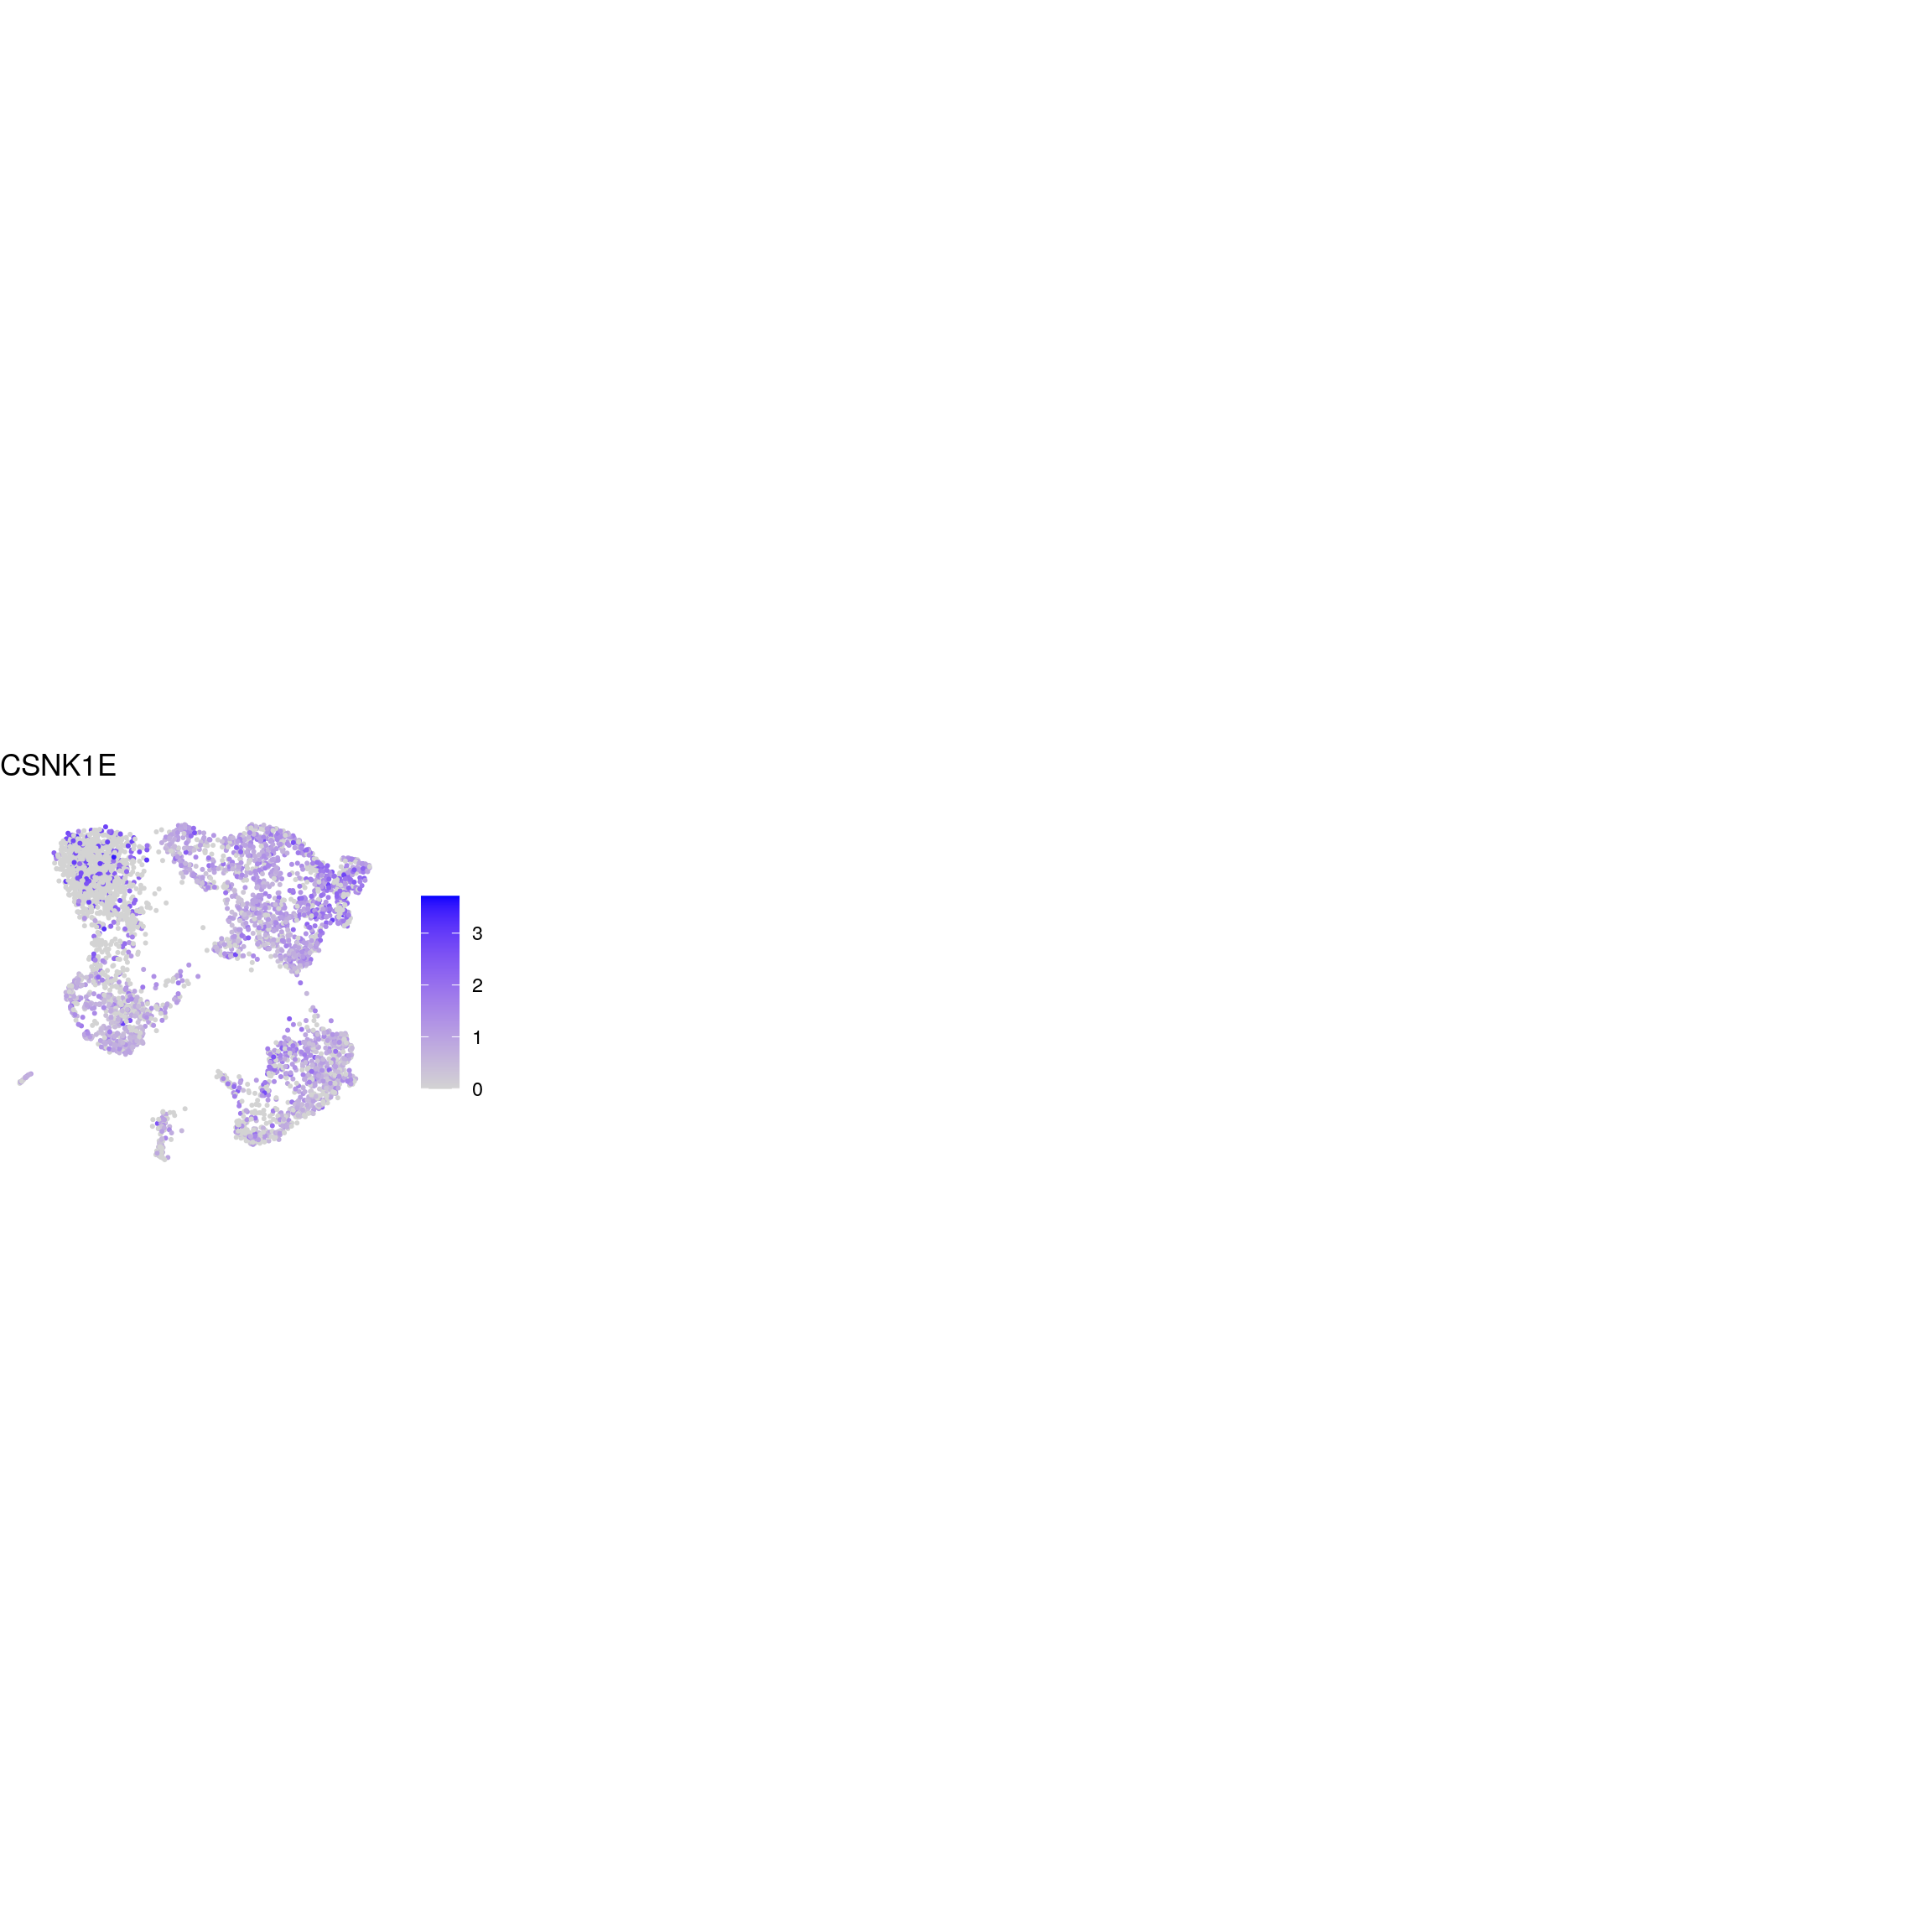
Known marker genes
Apart from the usual marker genes, we also want to analyse the expression of Casein Kinase 1 Epsilon (CSNK1E).
## source file with list of known marker genes
source(file.path("data", "known_cell_type_markers.R"))
fs[["kinase"]] <- "CSNK1E"

fs <- lapply(fs, sapply, function(g)
    grep(pattern = paste0("\\.", g, "$"), rownames(sce), value = TRUE)
  )
fs <- lapply(fs, function(x) unlist(x[lengths(x) !=0]) )

gs <- gsub(".*\\.", "", unlist(fs))
ns <- vapply(fs, length, numeric(1))
ks <- rep.int(names(fs), ns)
labs <- lapply(fs, function(x) gsub(".*\\.", "",x))
Heatmap of mean marker-exprs. by cluster
n_cells <- table(sce$cluster_id, sce$sample_id)
# split cells by cluster
cs_by_k <- split(colnames(sce), sce$cluster_id)
# compute cluster-marker means
ms_by_cluster <- lapply(fs, function(gs) vapply(cs_by_k, function(i)
        Matrix::rowMeans(logcounts(sce)[gs, i, drop = FALSE]),
        numeric(length(gs))))
# prep. for plotting & scale b/w 0 and 1
mat <- do.call("rbind", ms_by_cluster)
mat <- muscat:::.scale(mat)
rownames(mat) <- gs
cols <- muscat:::.cluster_colors[seq_along(fs)]
cols <- setNames(cols, names(fs))
row_anno <- rowAnnotation(
    df = data.frame(label = factor(ks, levels = names(fs))),
    col = list(label = cols), gp = gpar(col = "white"))
# percentage of cells from each of the samples per cluster
sample_props <- prop.table(n_cells, margin = 1)
col_mat <- as.matrix(unclass(sample_props))
sample_cols <- c("#882255", "#11588A",  "#117733")
sample_cols <- setNames(sample_cols, colnames(col_mat))
col_anno <- HeatmapAnnotation(
    perc_sample = anno_barplot(col_mat, gp = gpar(fill = sample_cols),
                               height = unit(2, "cm"),
                               border = FALSE),
    annotation_label = "fraction of sample\nin cluster",
    gap = unit(10, "points"))
col_lgd <- Legend(labels = names(sample_cols),
       title = "sample",
       legend_gp = gpar(fill = sample_cols))

hm <- Heatmap(mat,
    name = "scaled avg.\nexpression",
    col = viridis(10),
    cluster_rows = FALSE,
    cluster_columns = FALSE,
    row_names_side = "left",
    column_title = "cluster_id",
    column_title_side = "bottom",
    column_names_side = "bottom",
    column_names_rot = 0,
    column_names_centered = TRUE,
    rect_gp = gpar(col = "white"),
    left_annotation = row_anno,
    top_annotation = col_anno)
draw(hm, annotation_legend_list = list(col_lgd))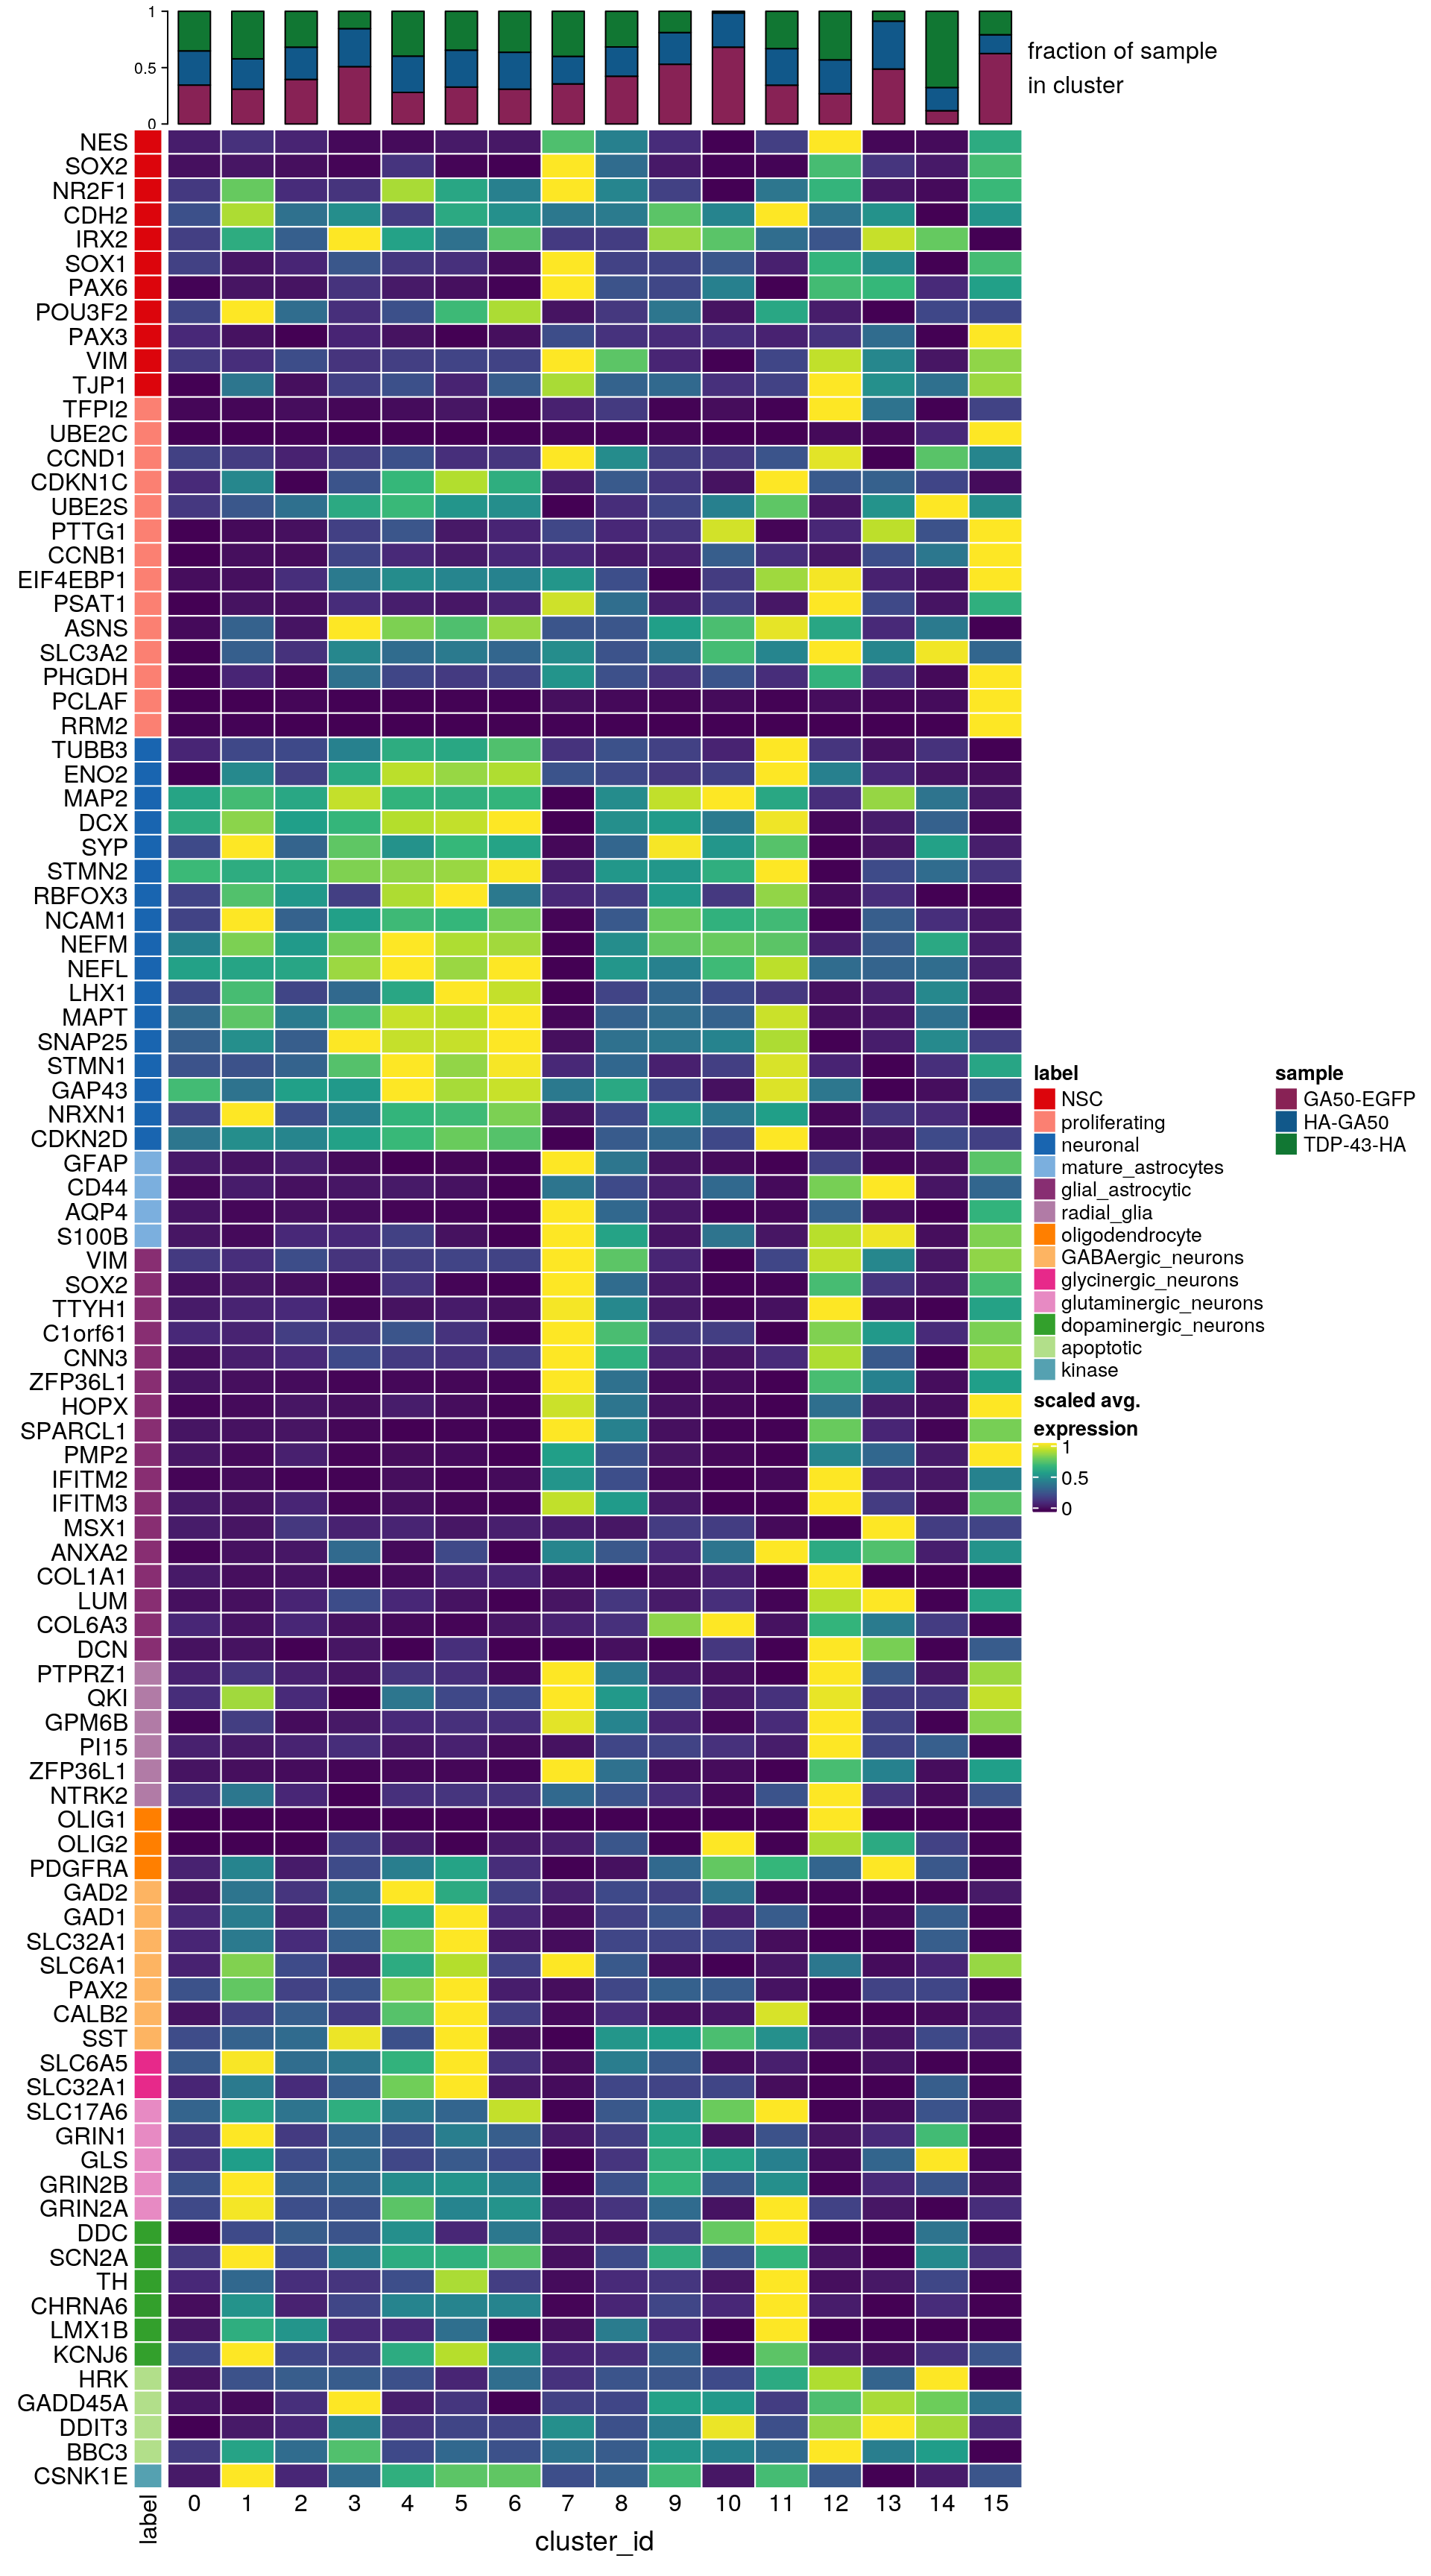
| Version | Author | Date |
|---|---|---|
| d55a2c2 | khembach | 2021-05-19 |
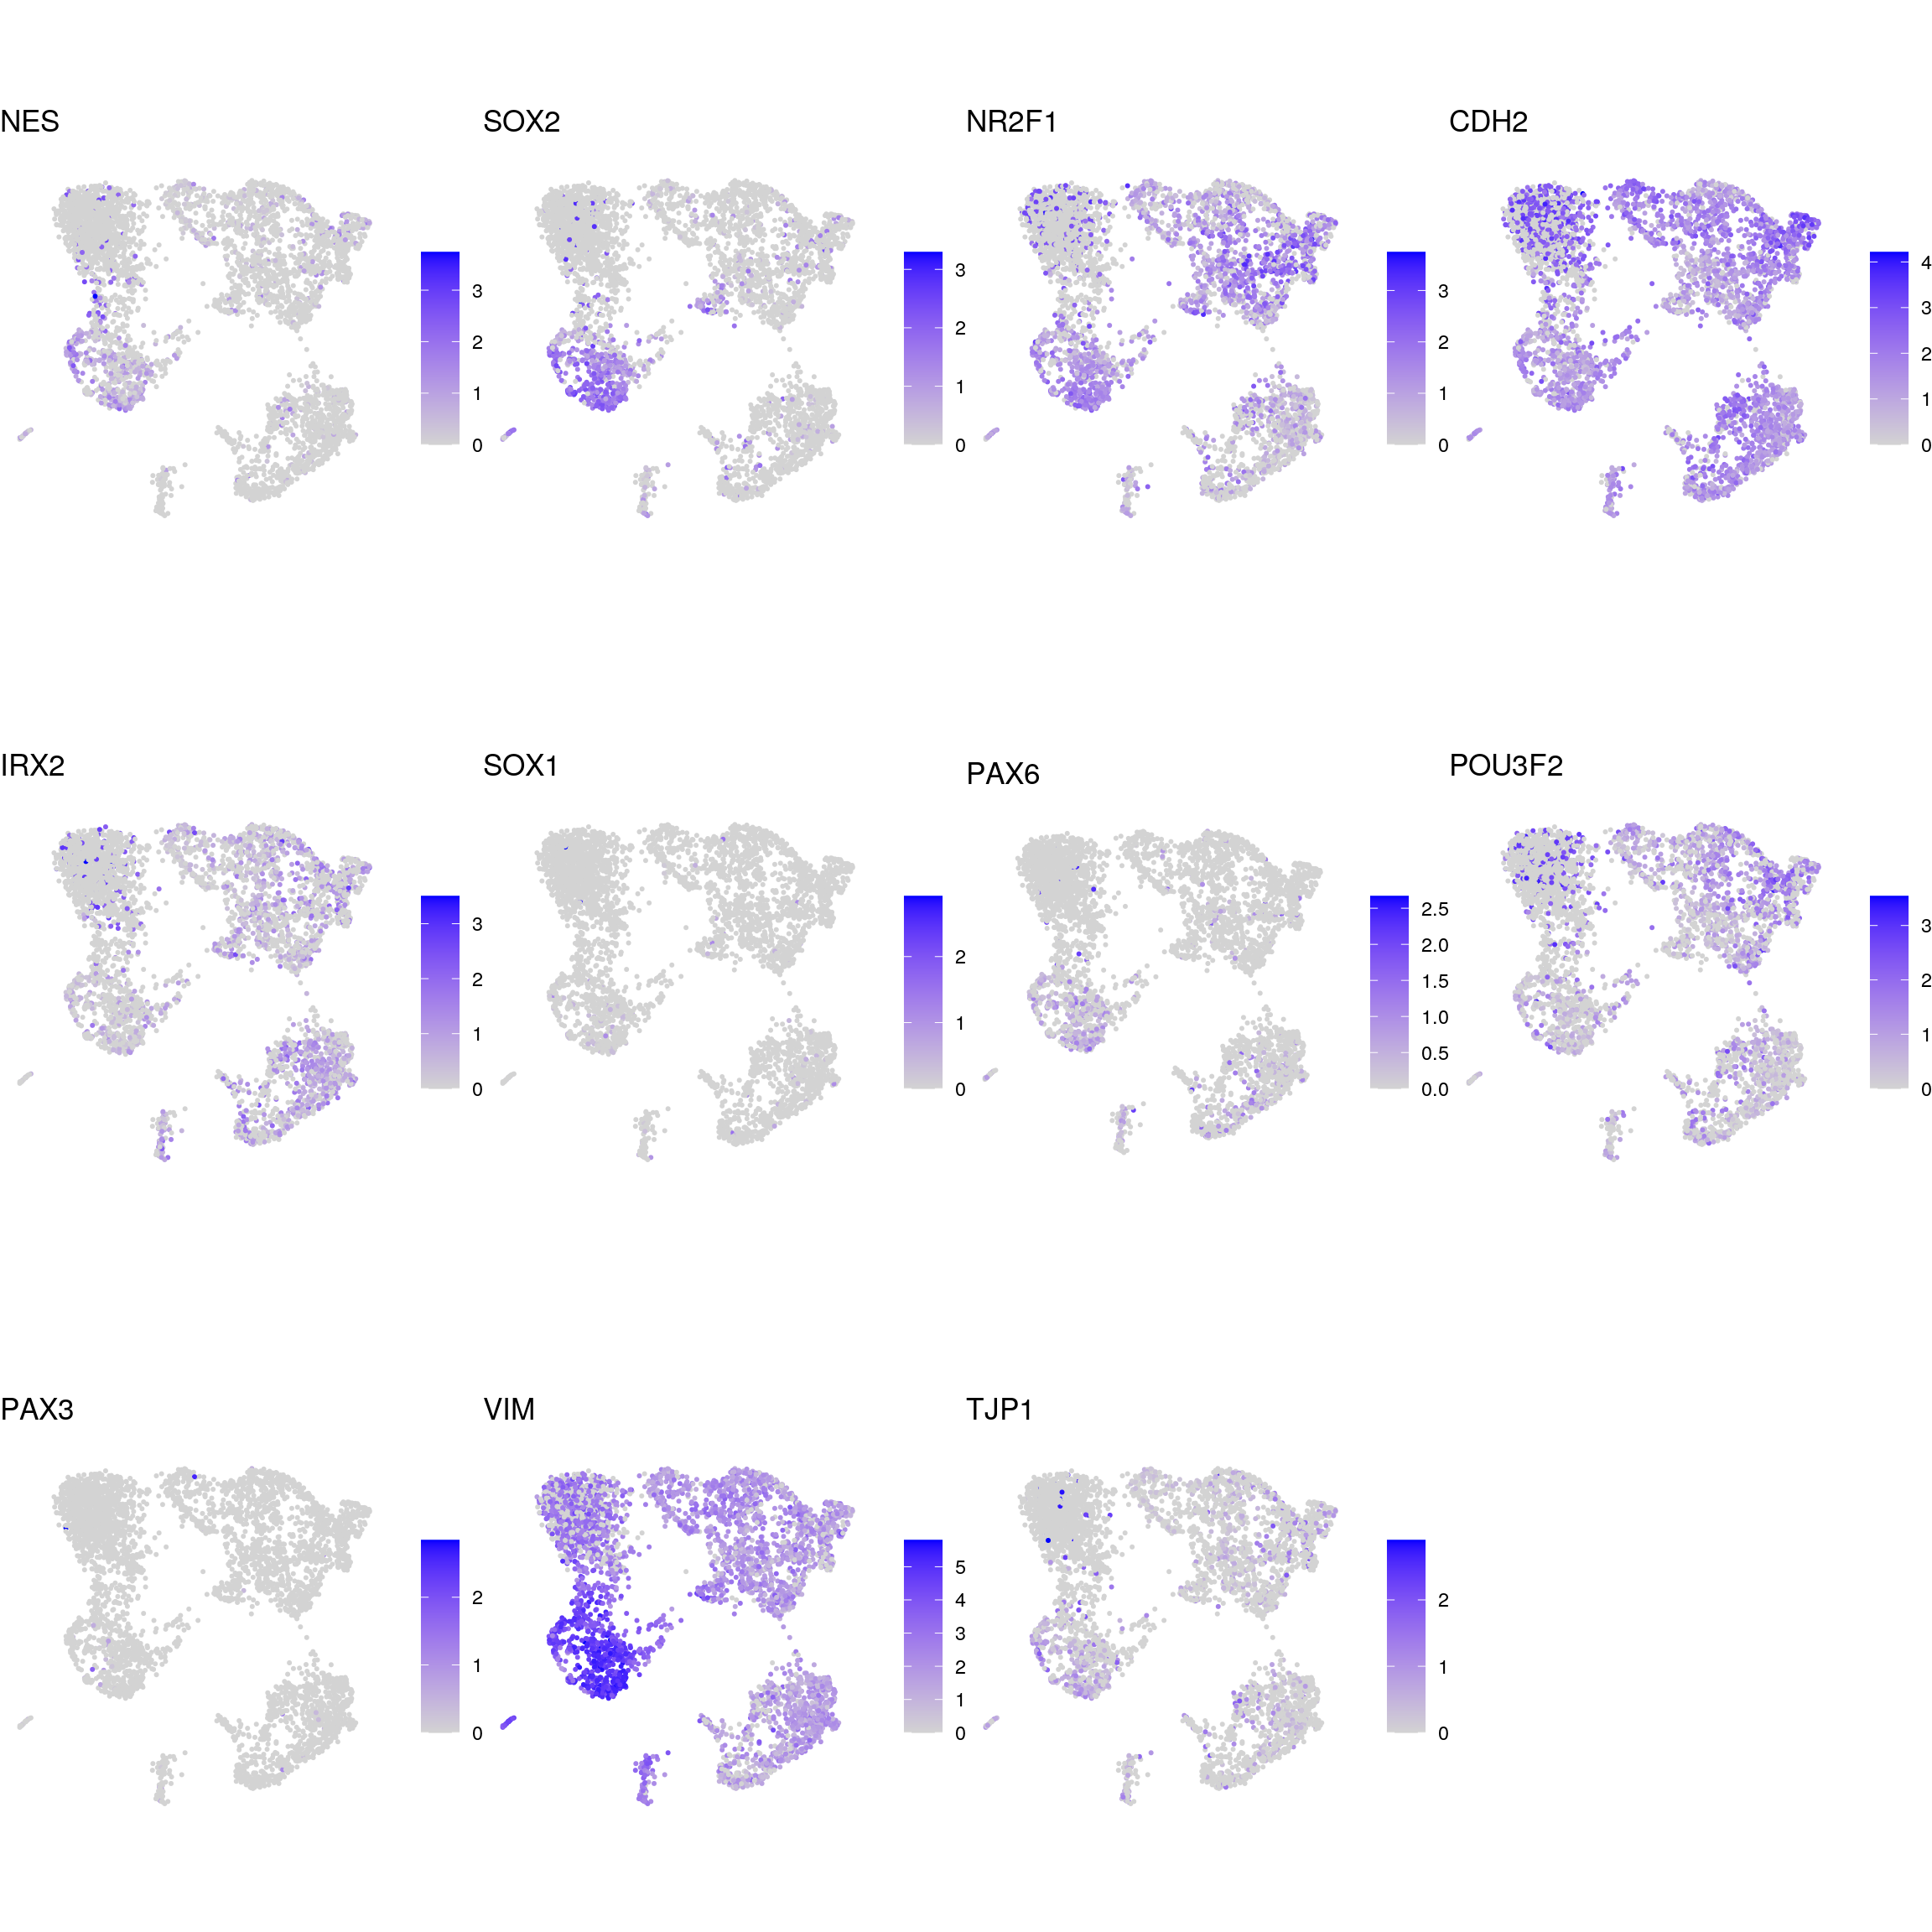
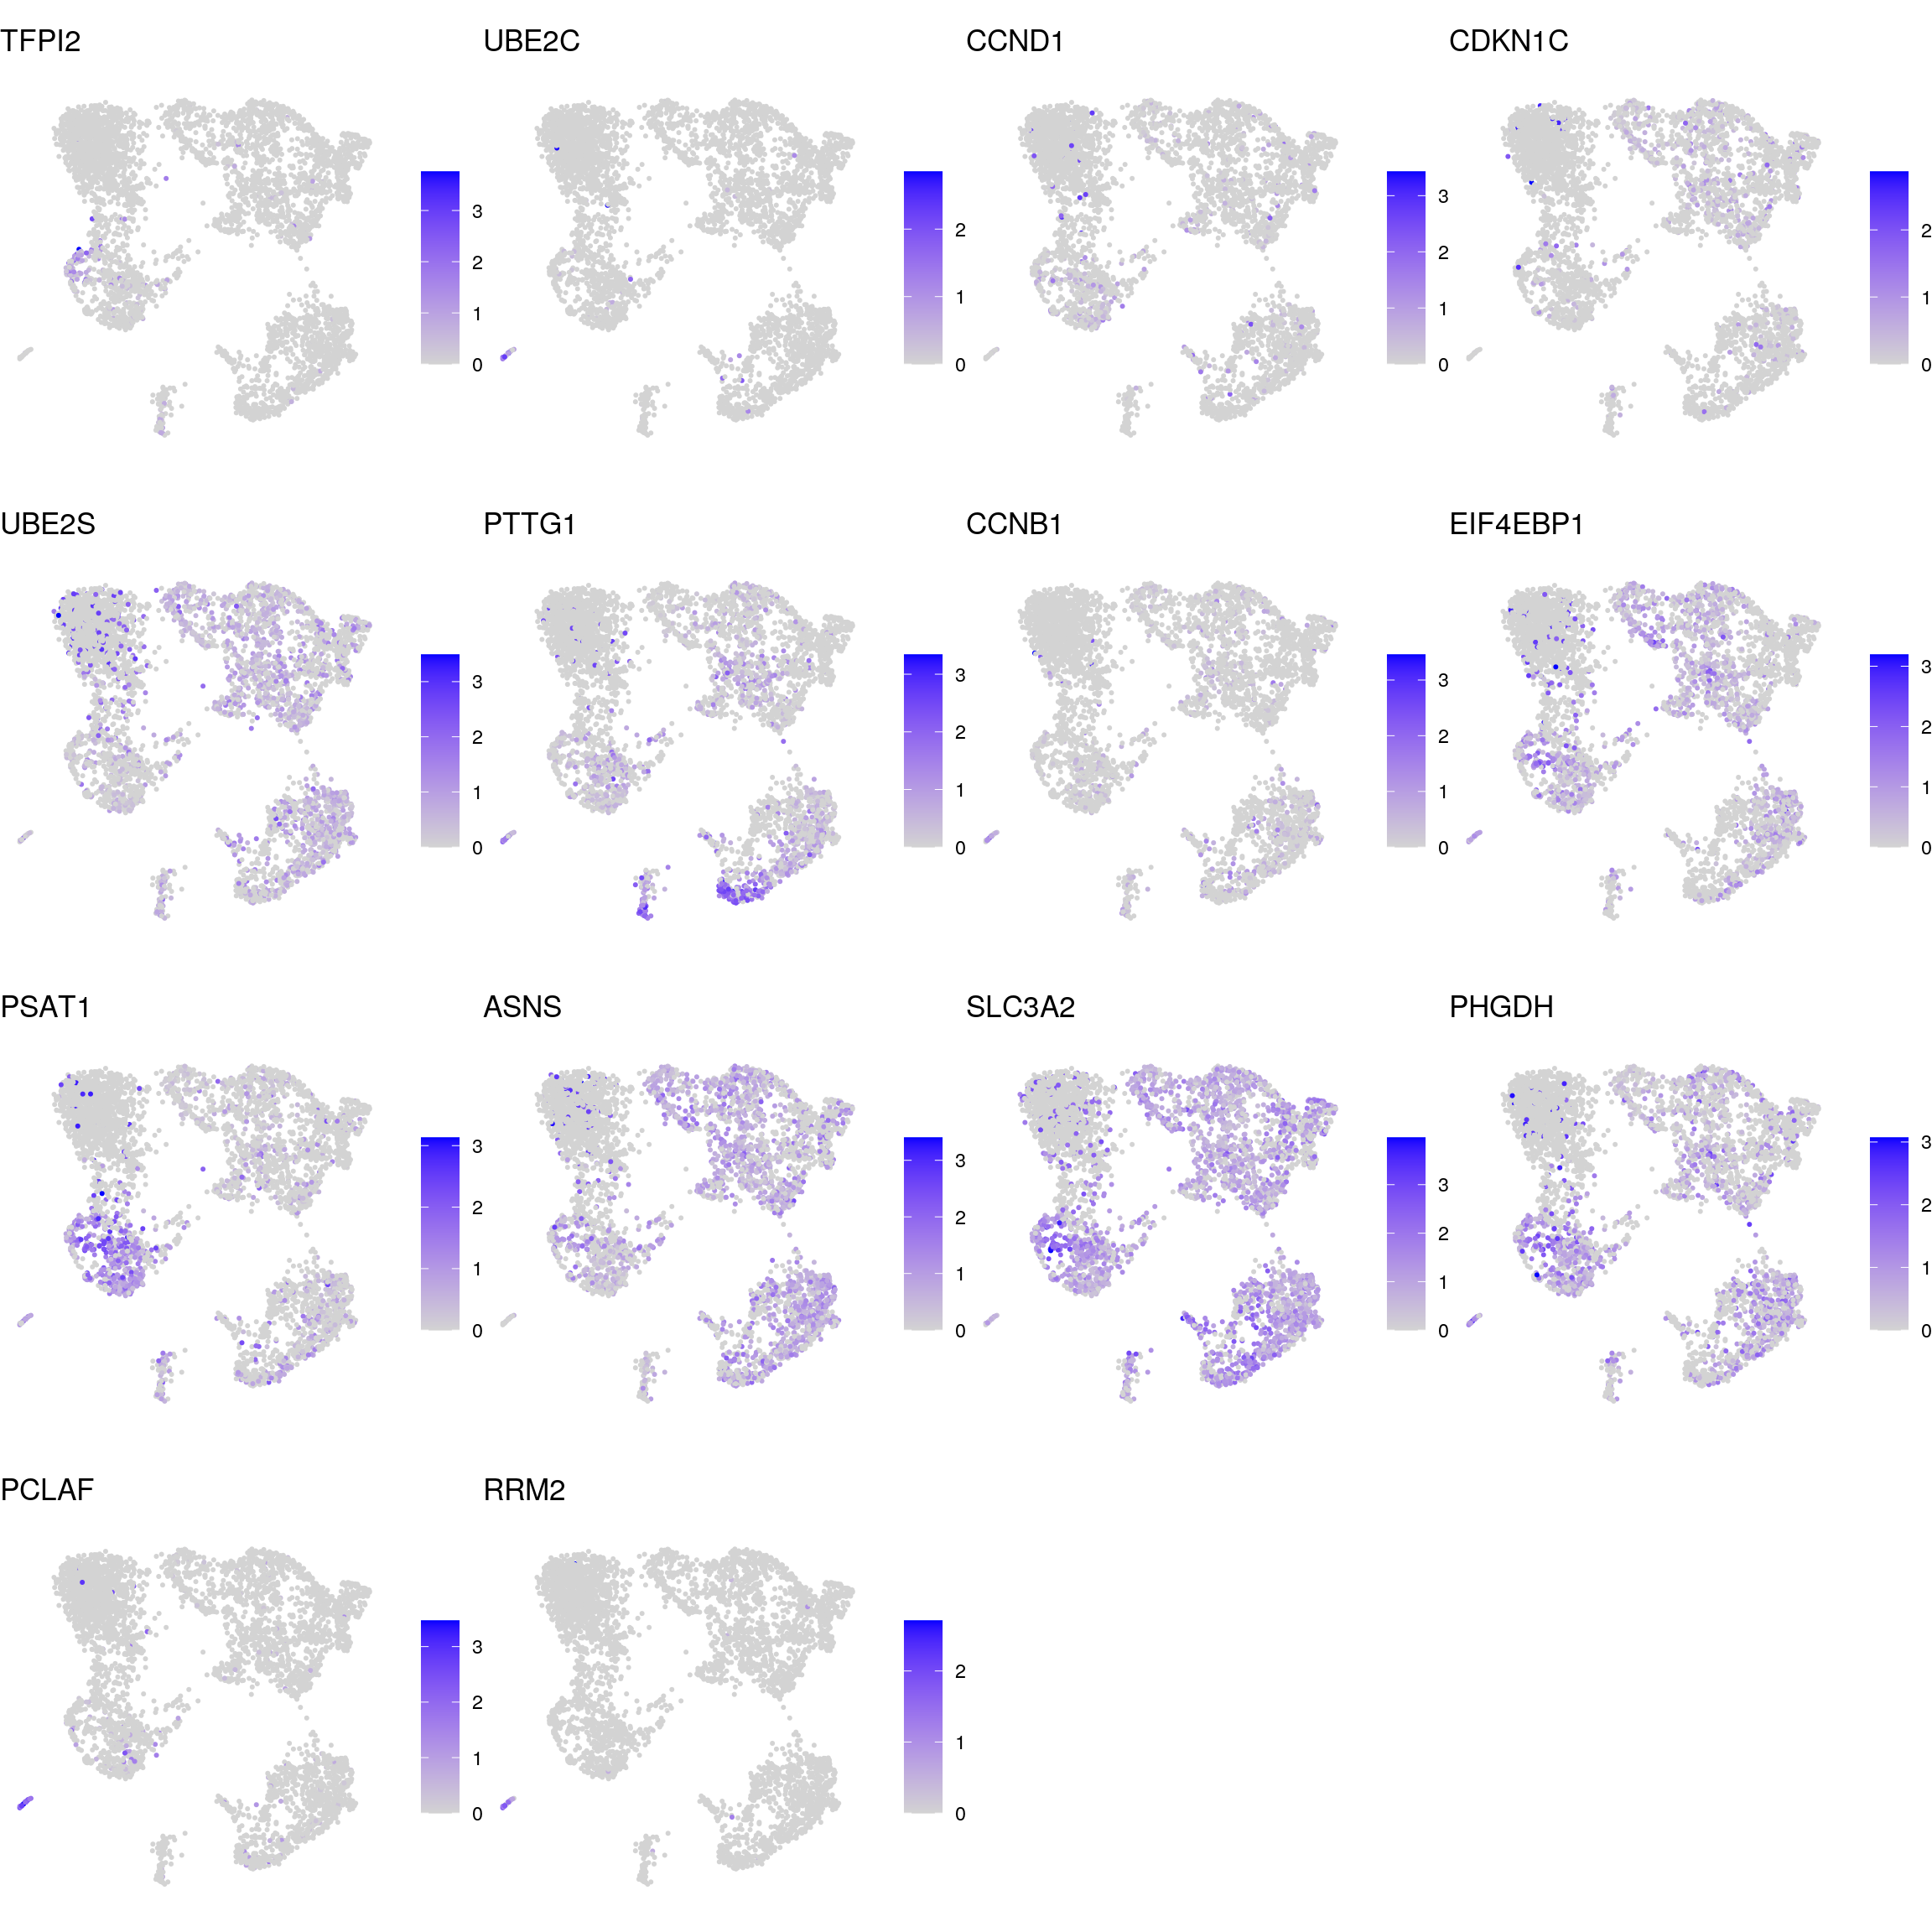
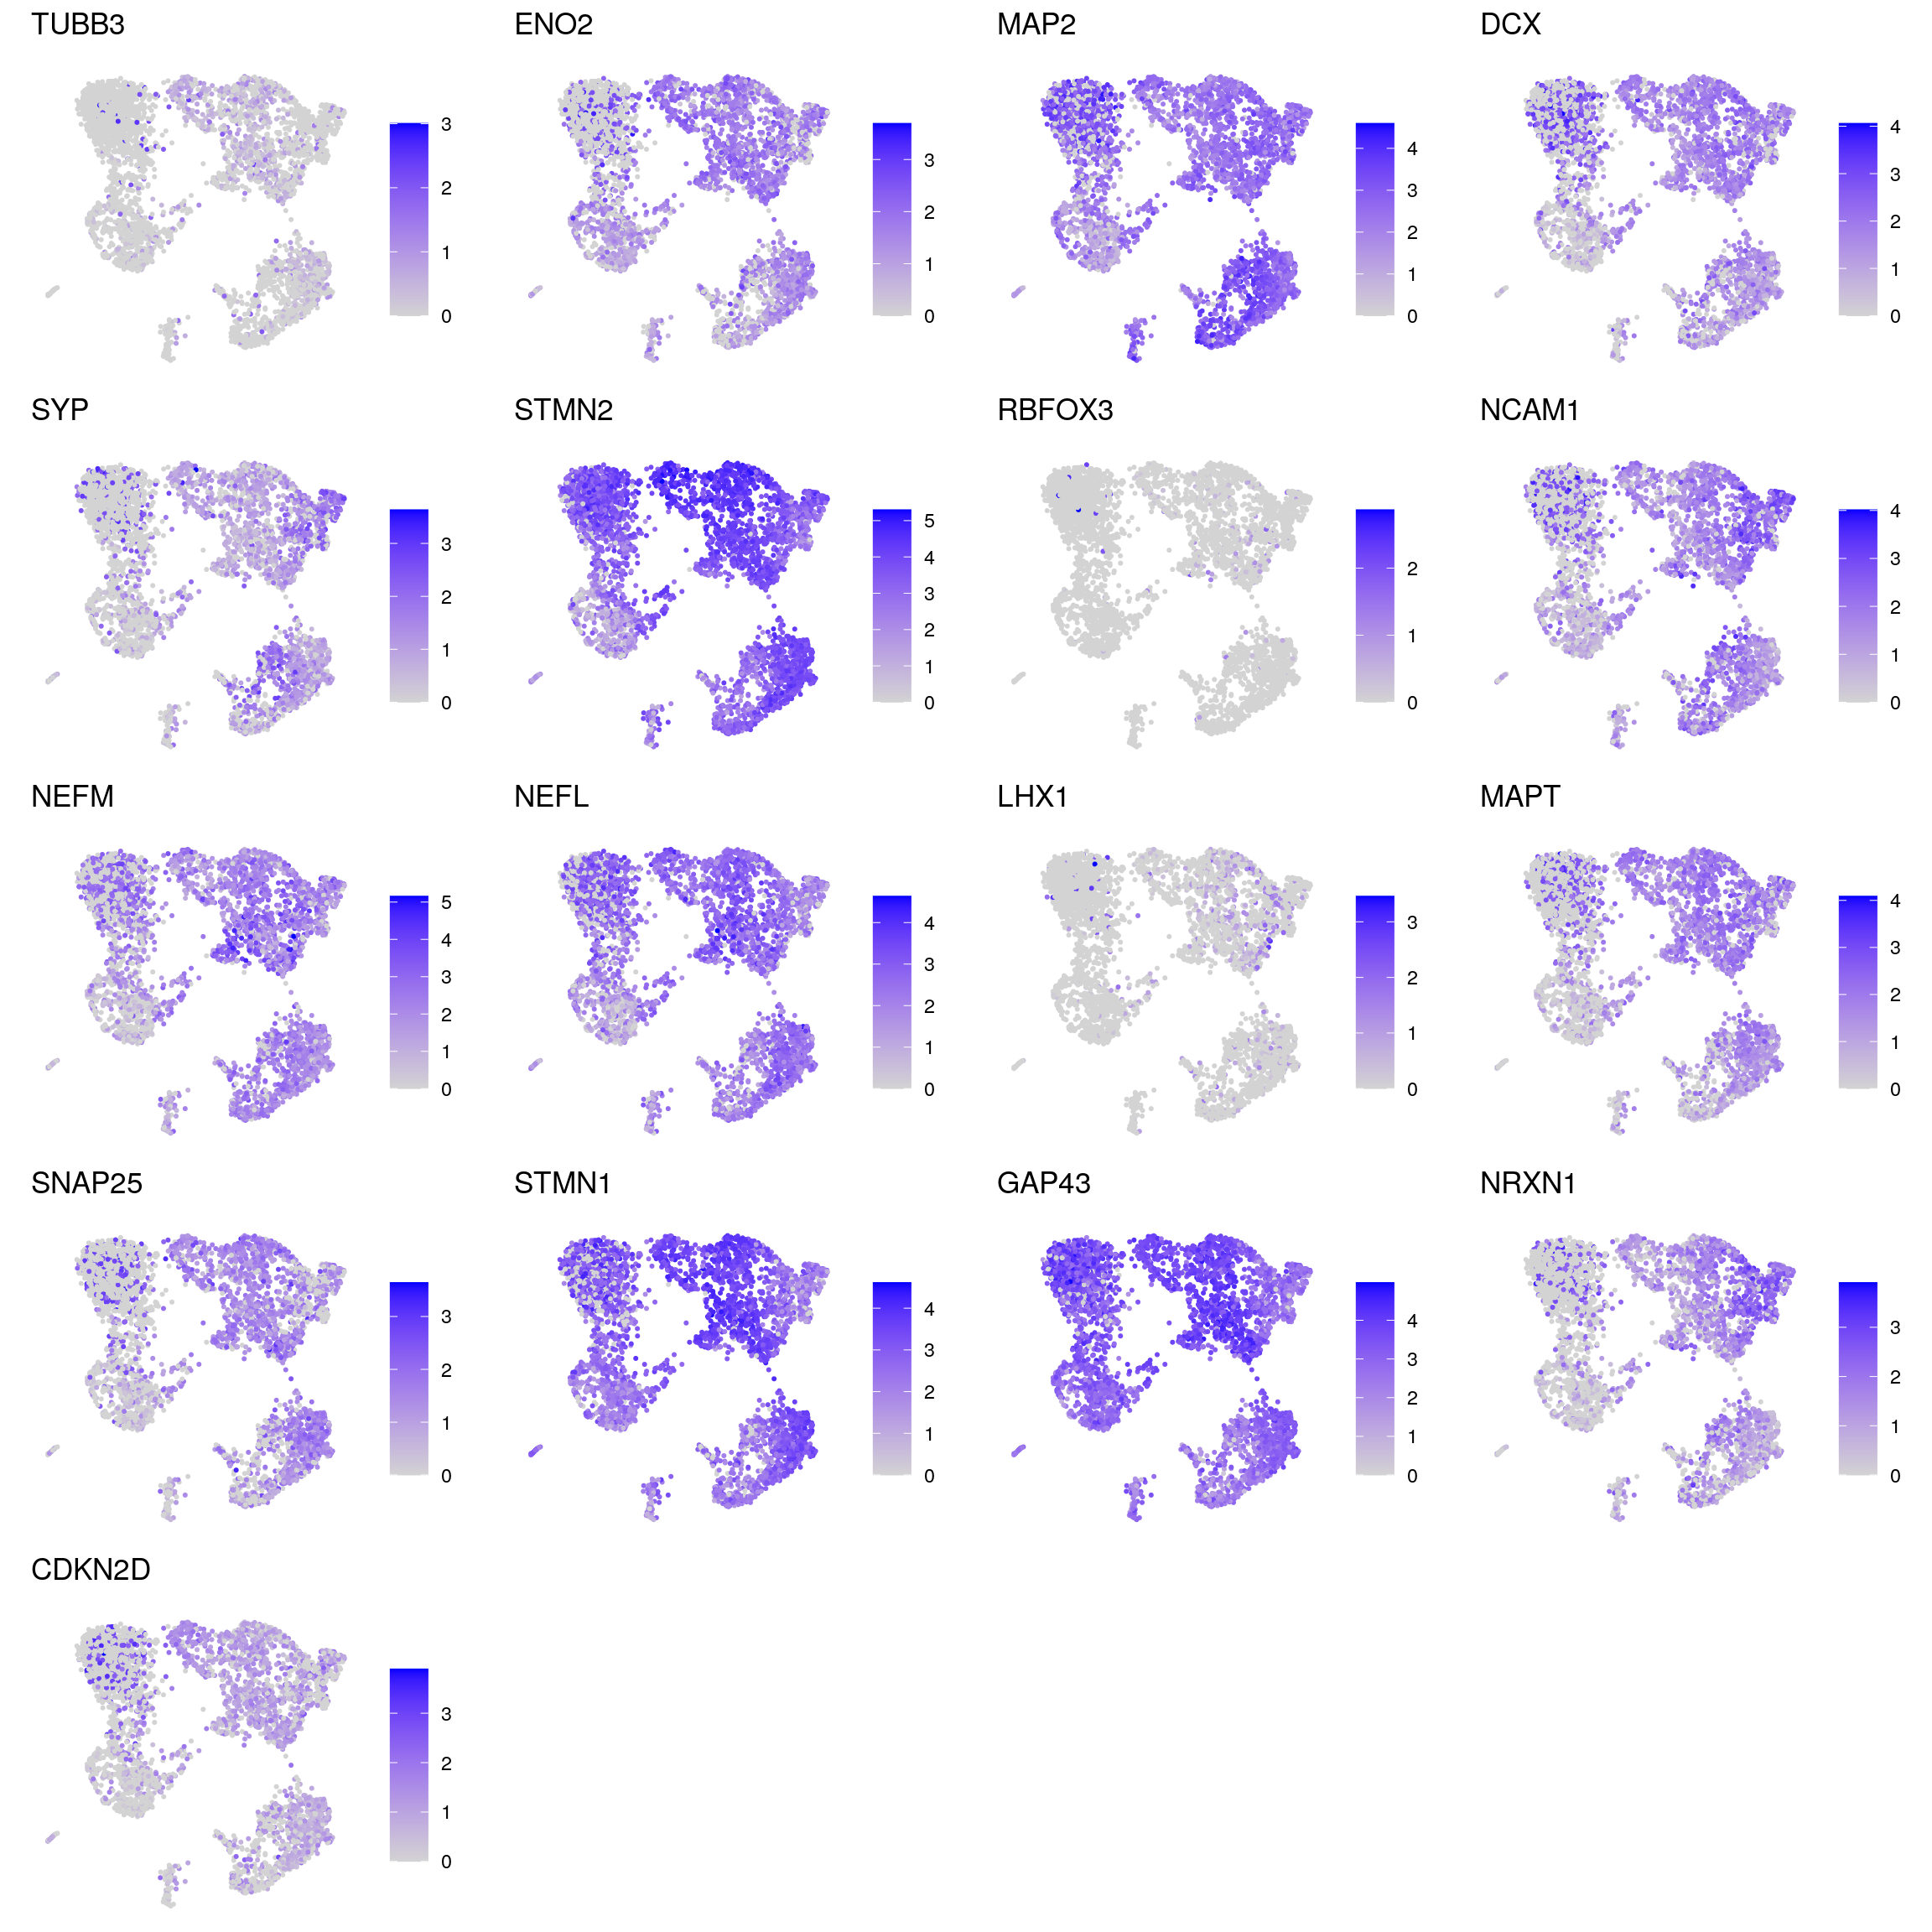
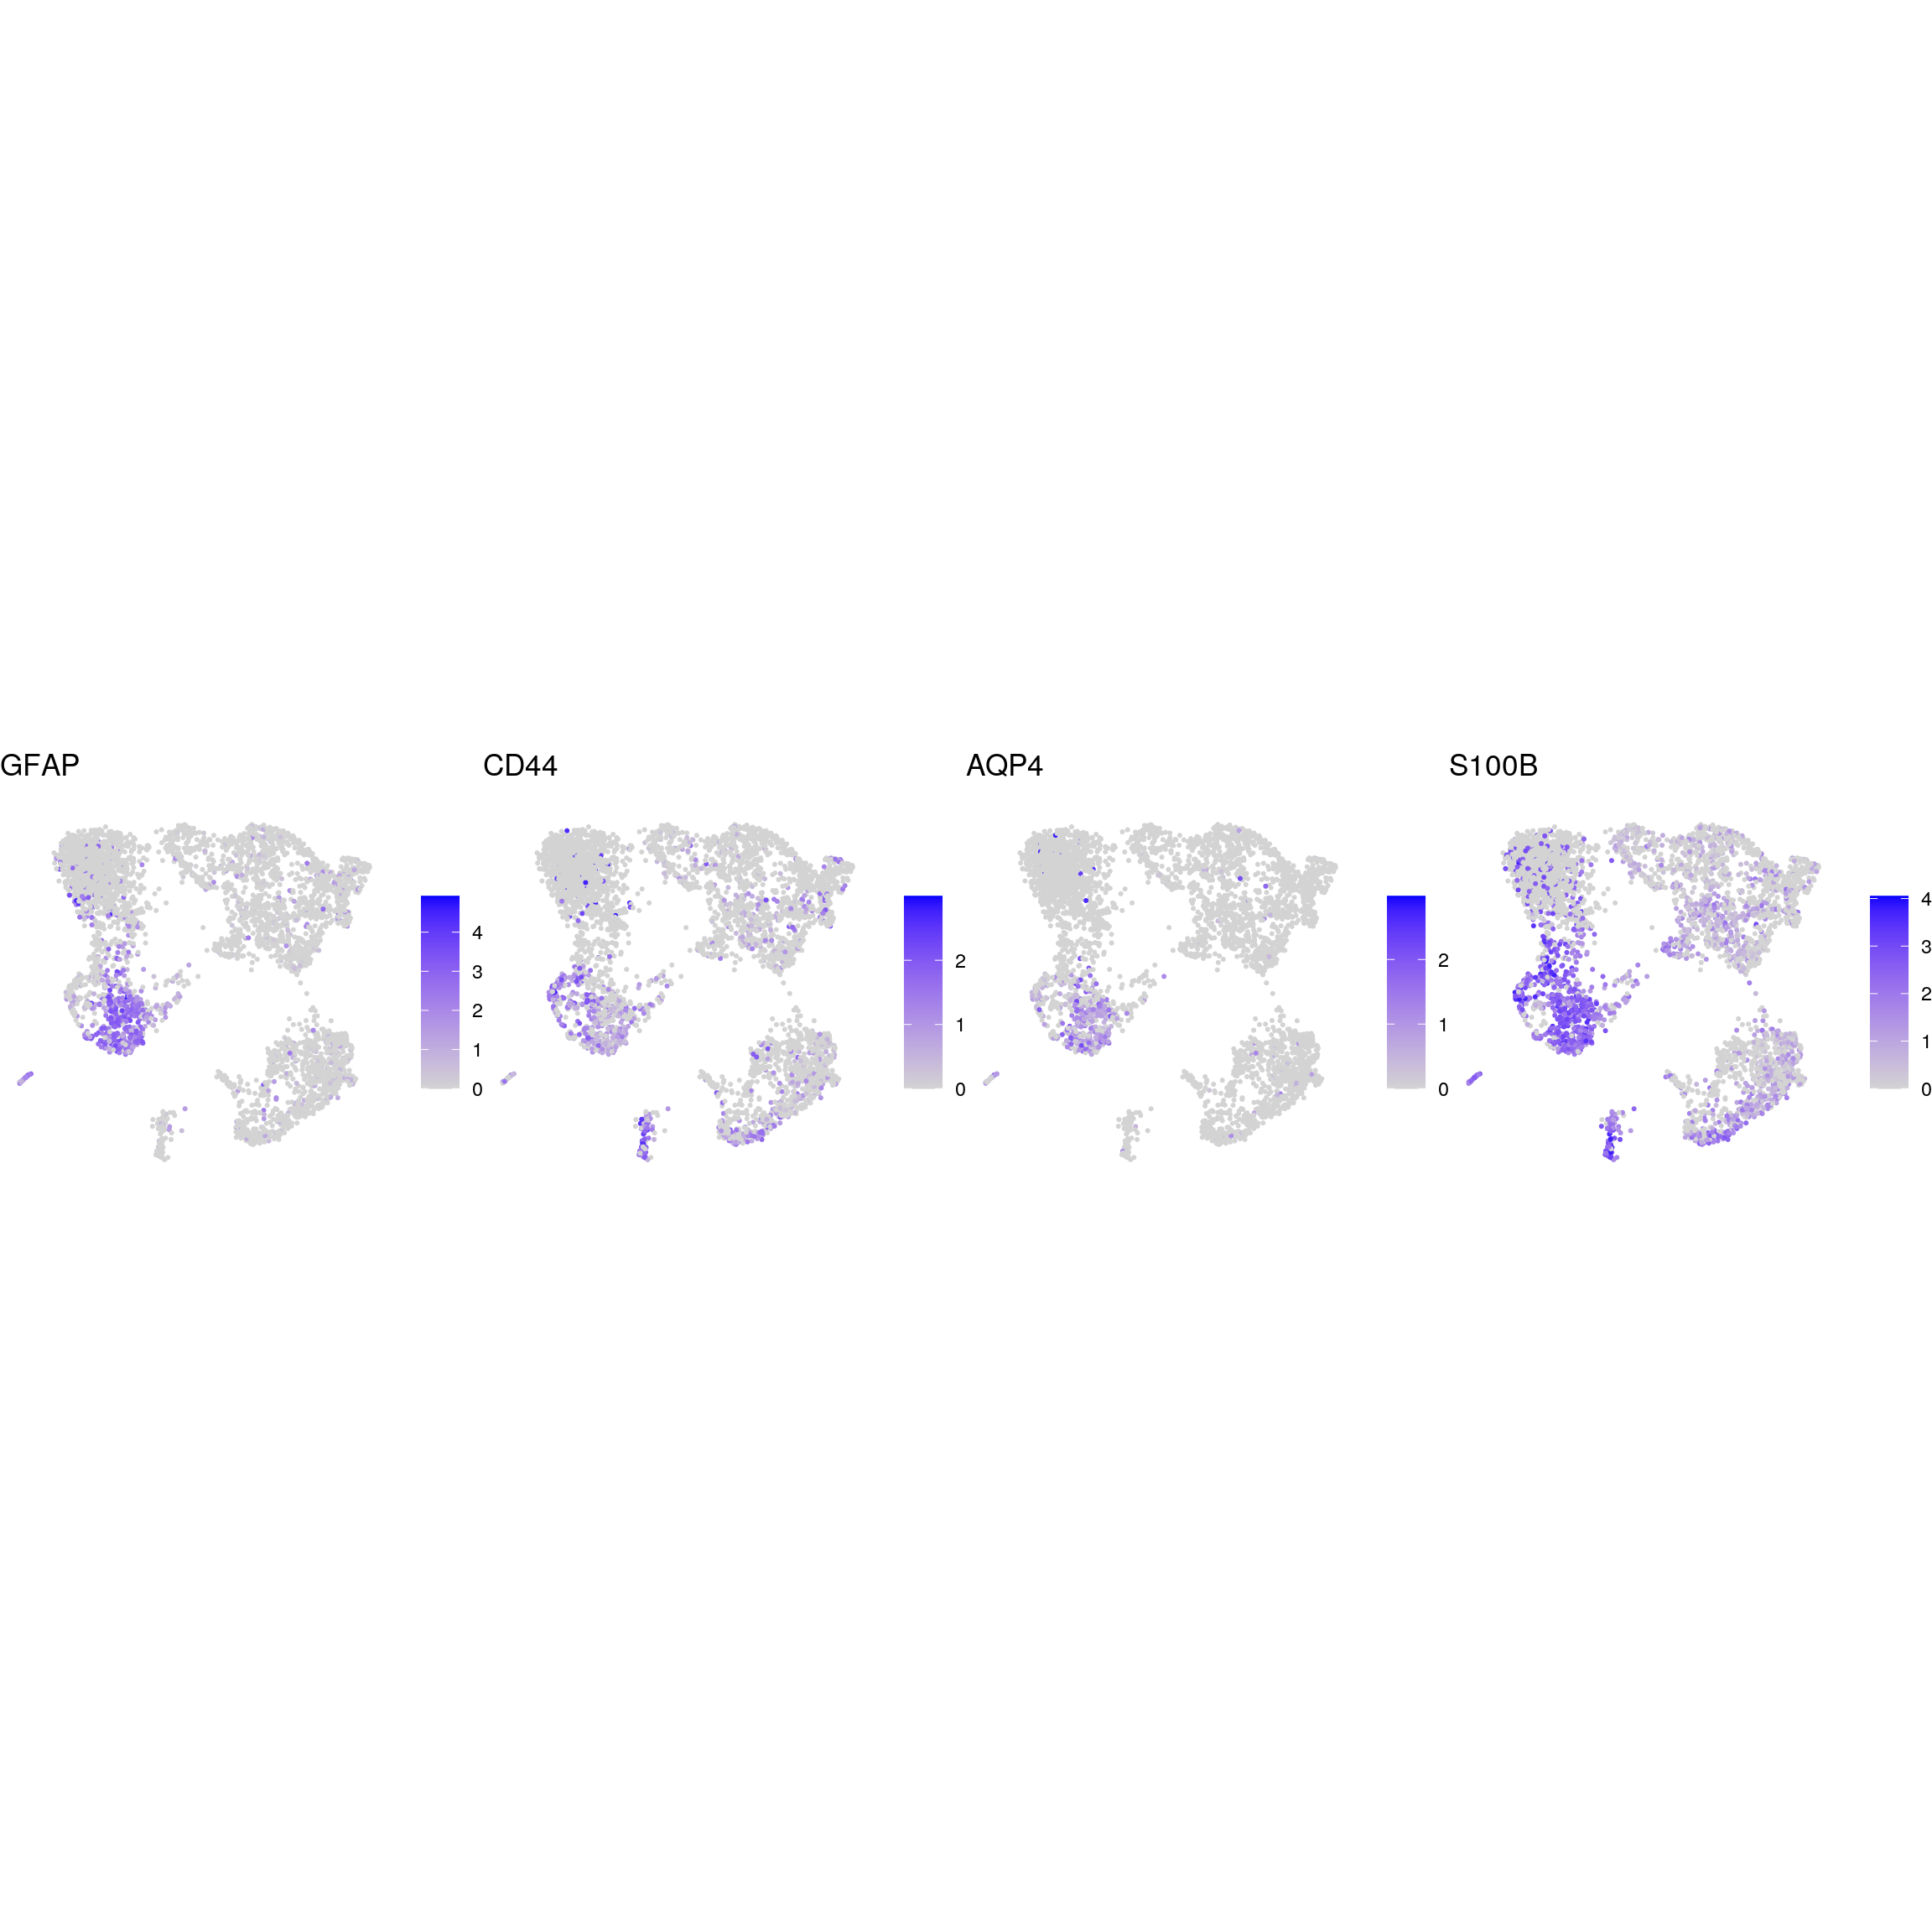
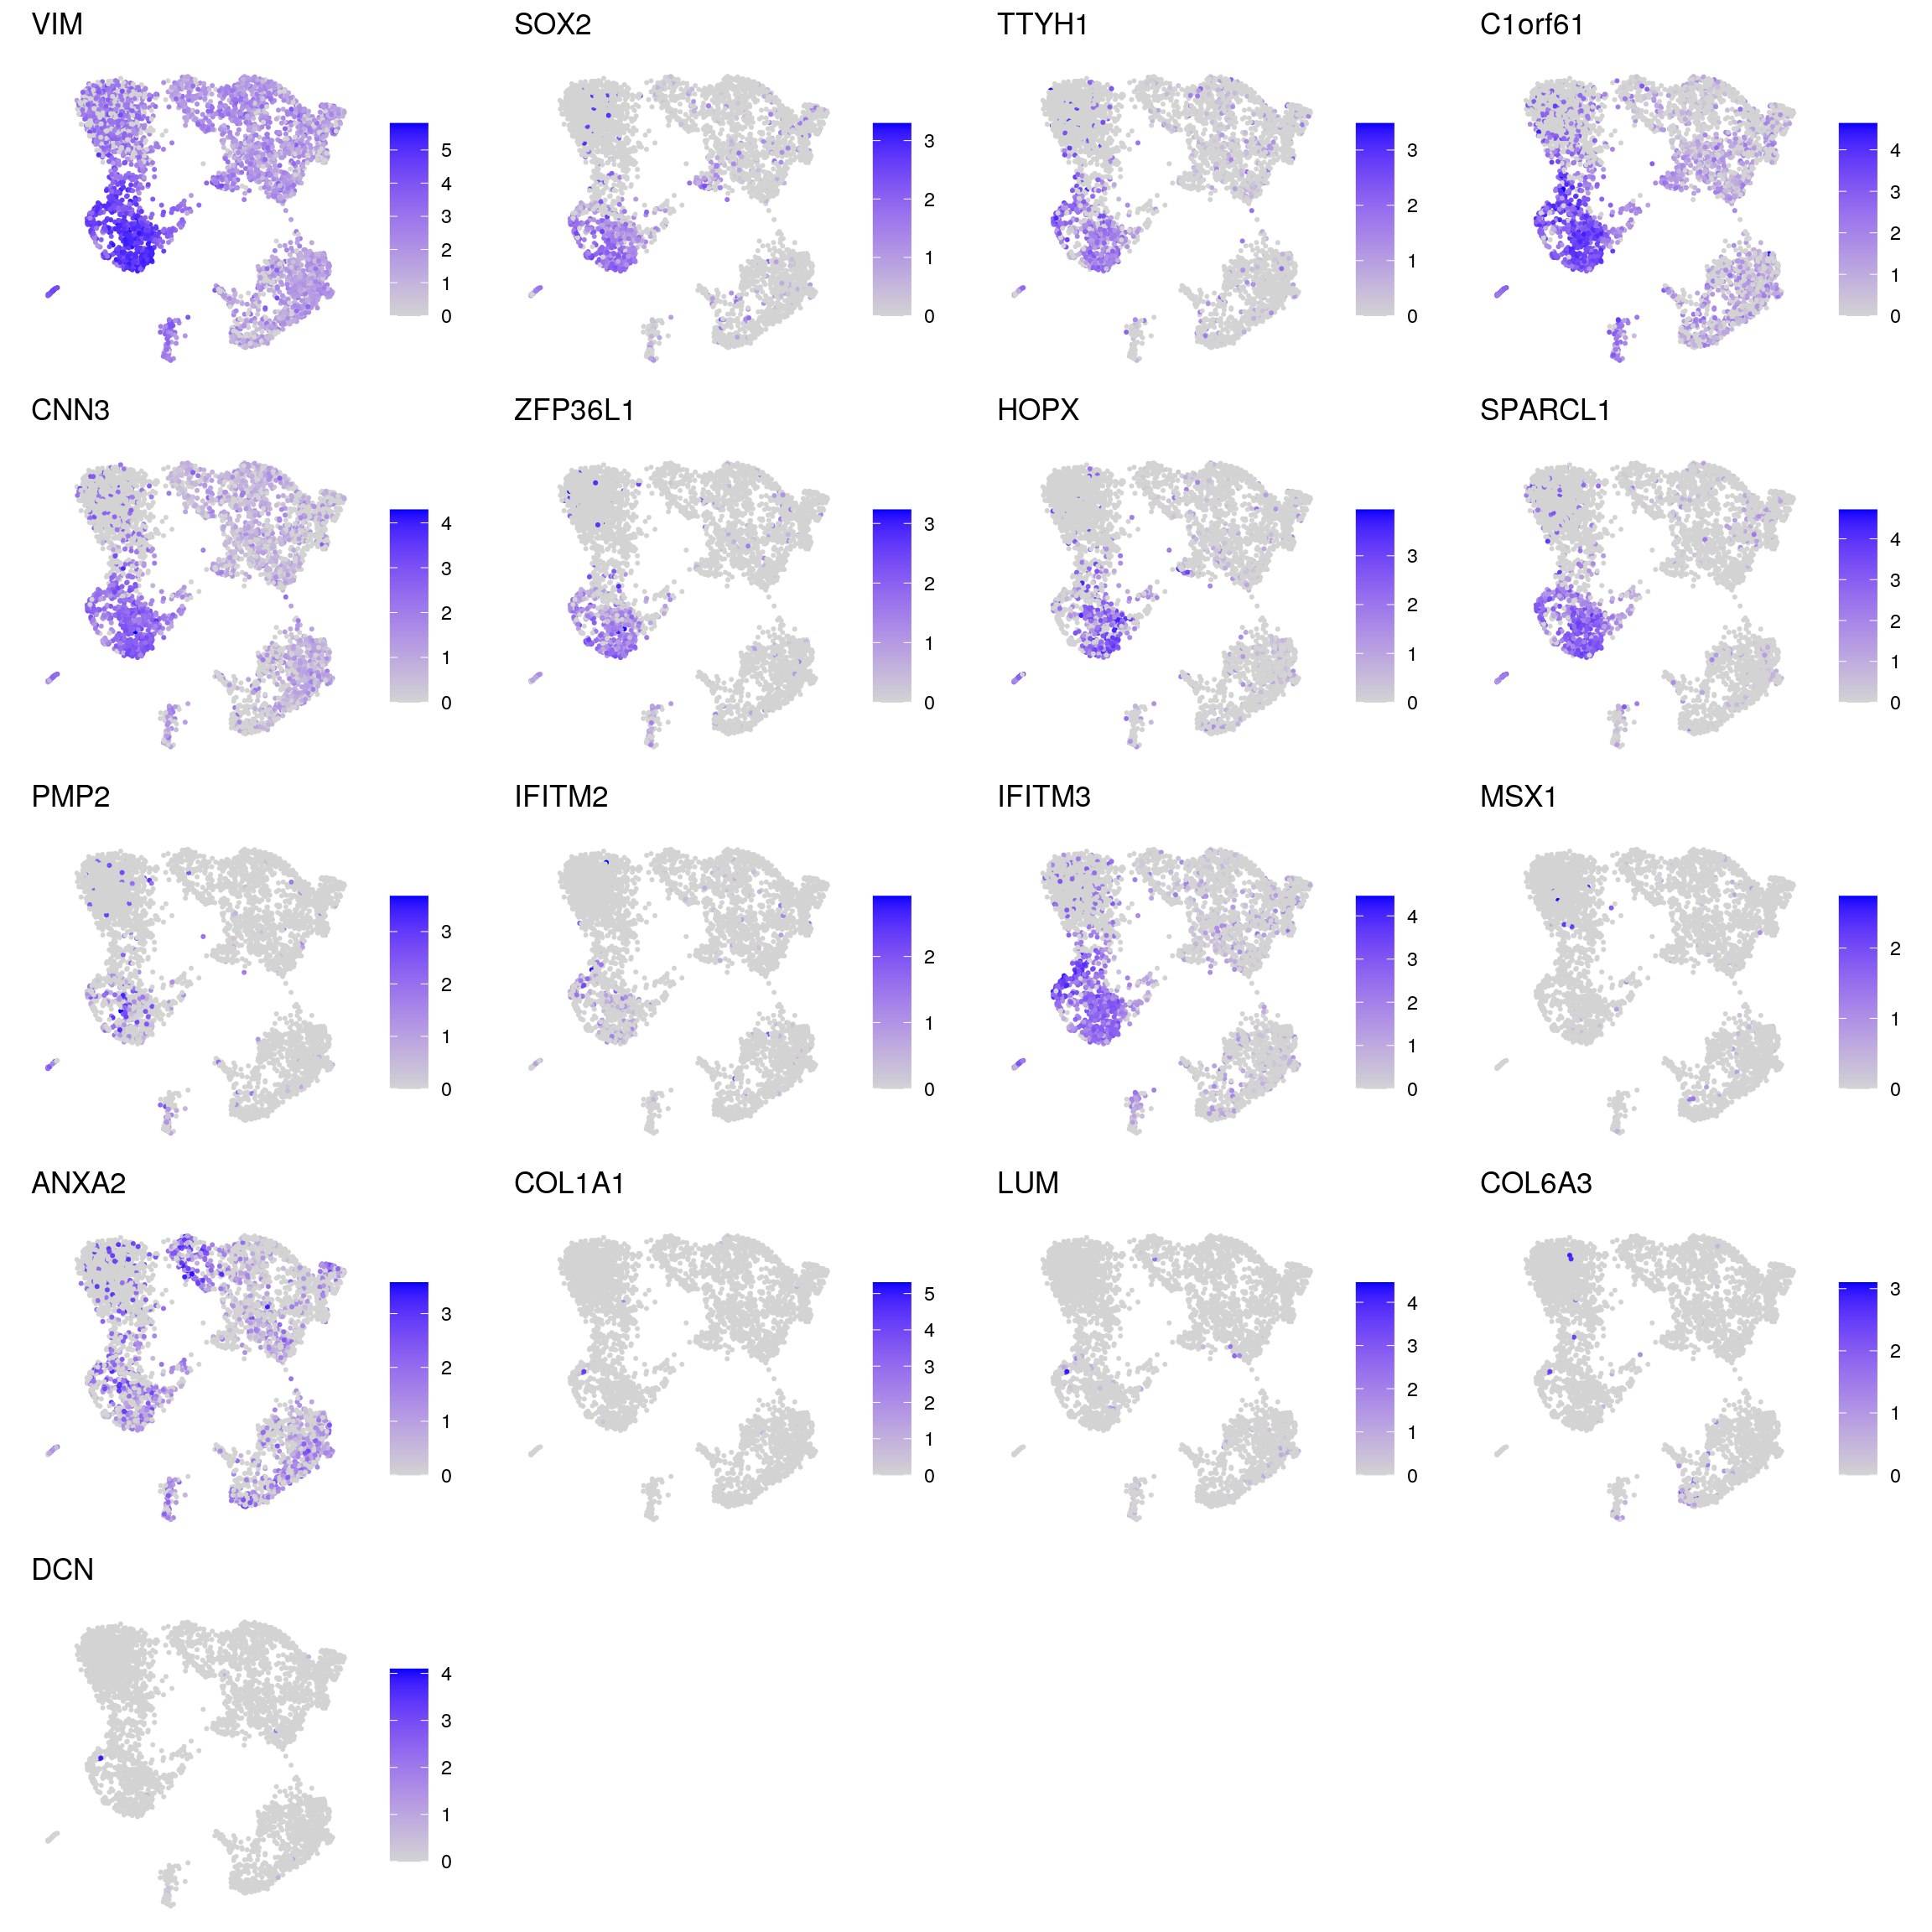
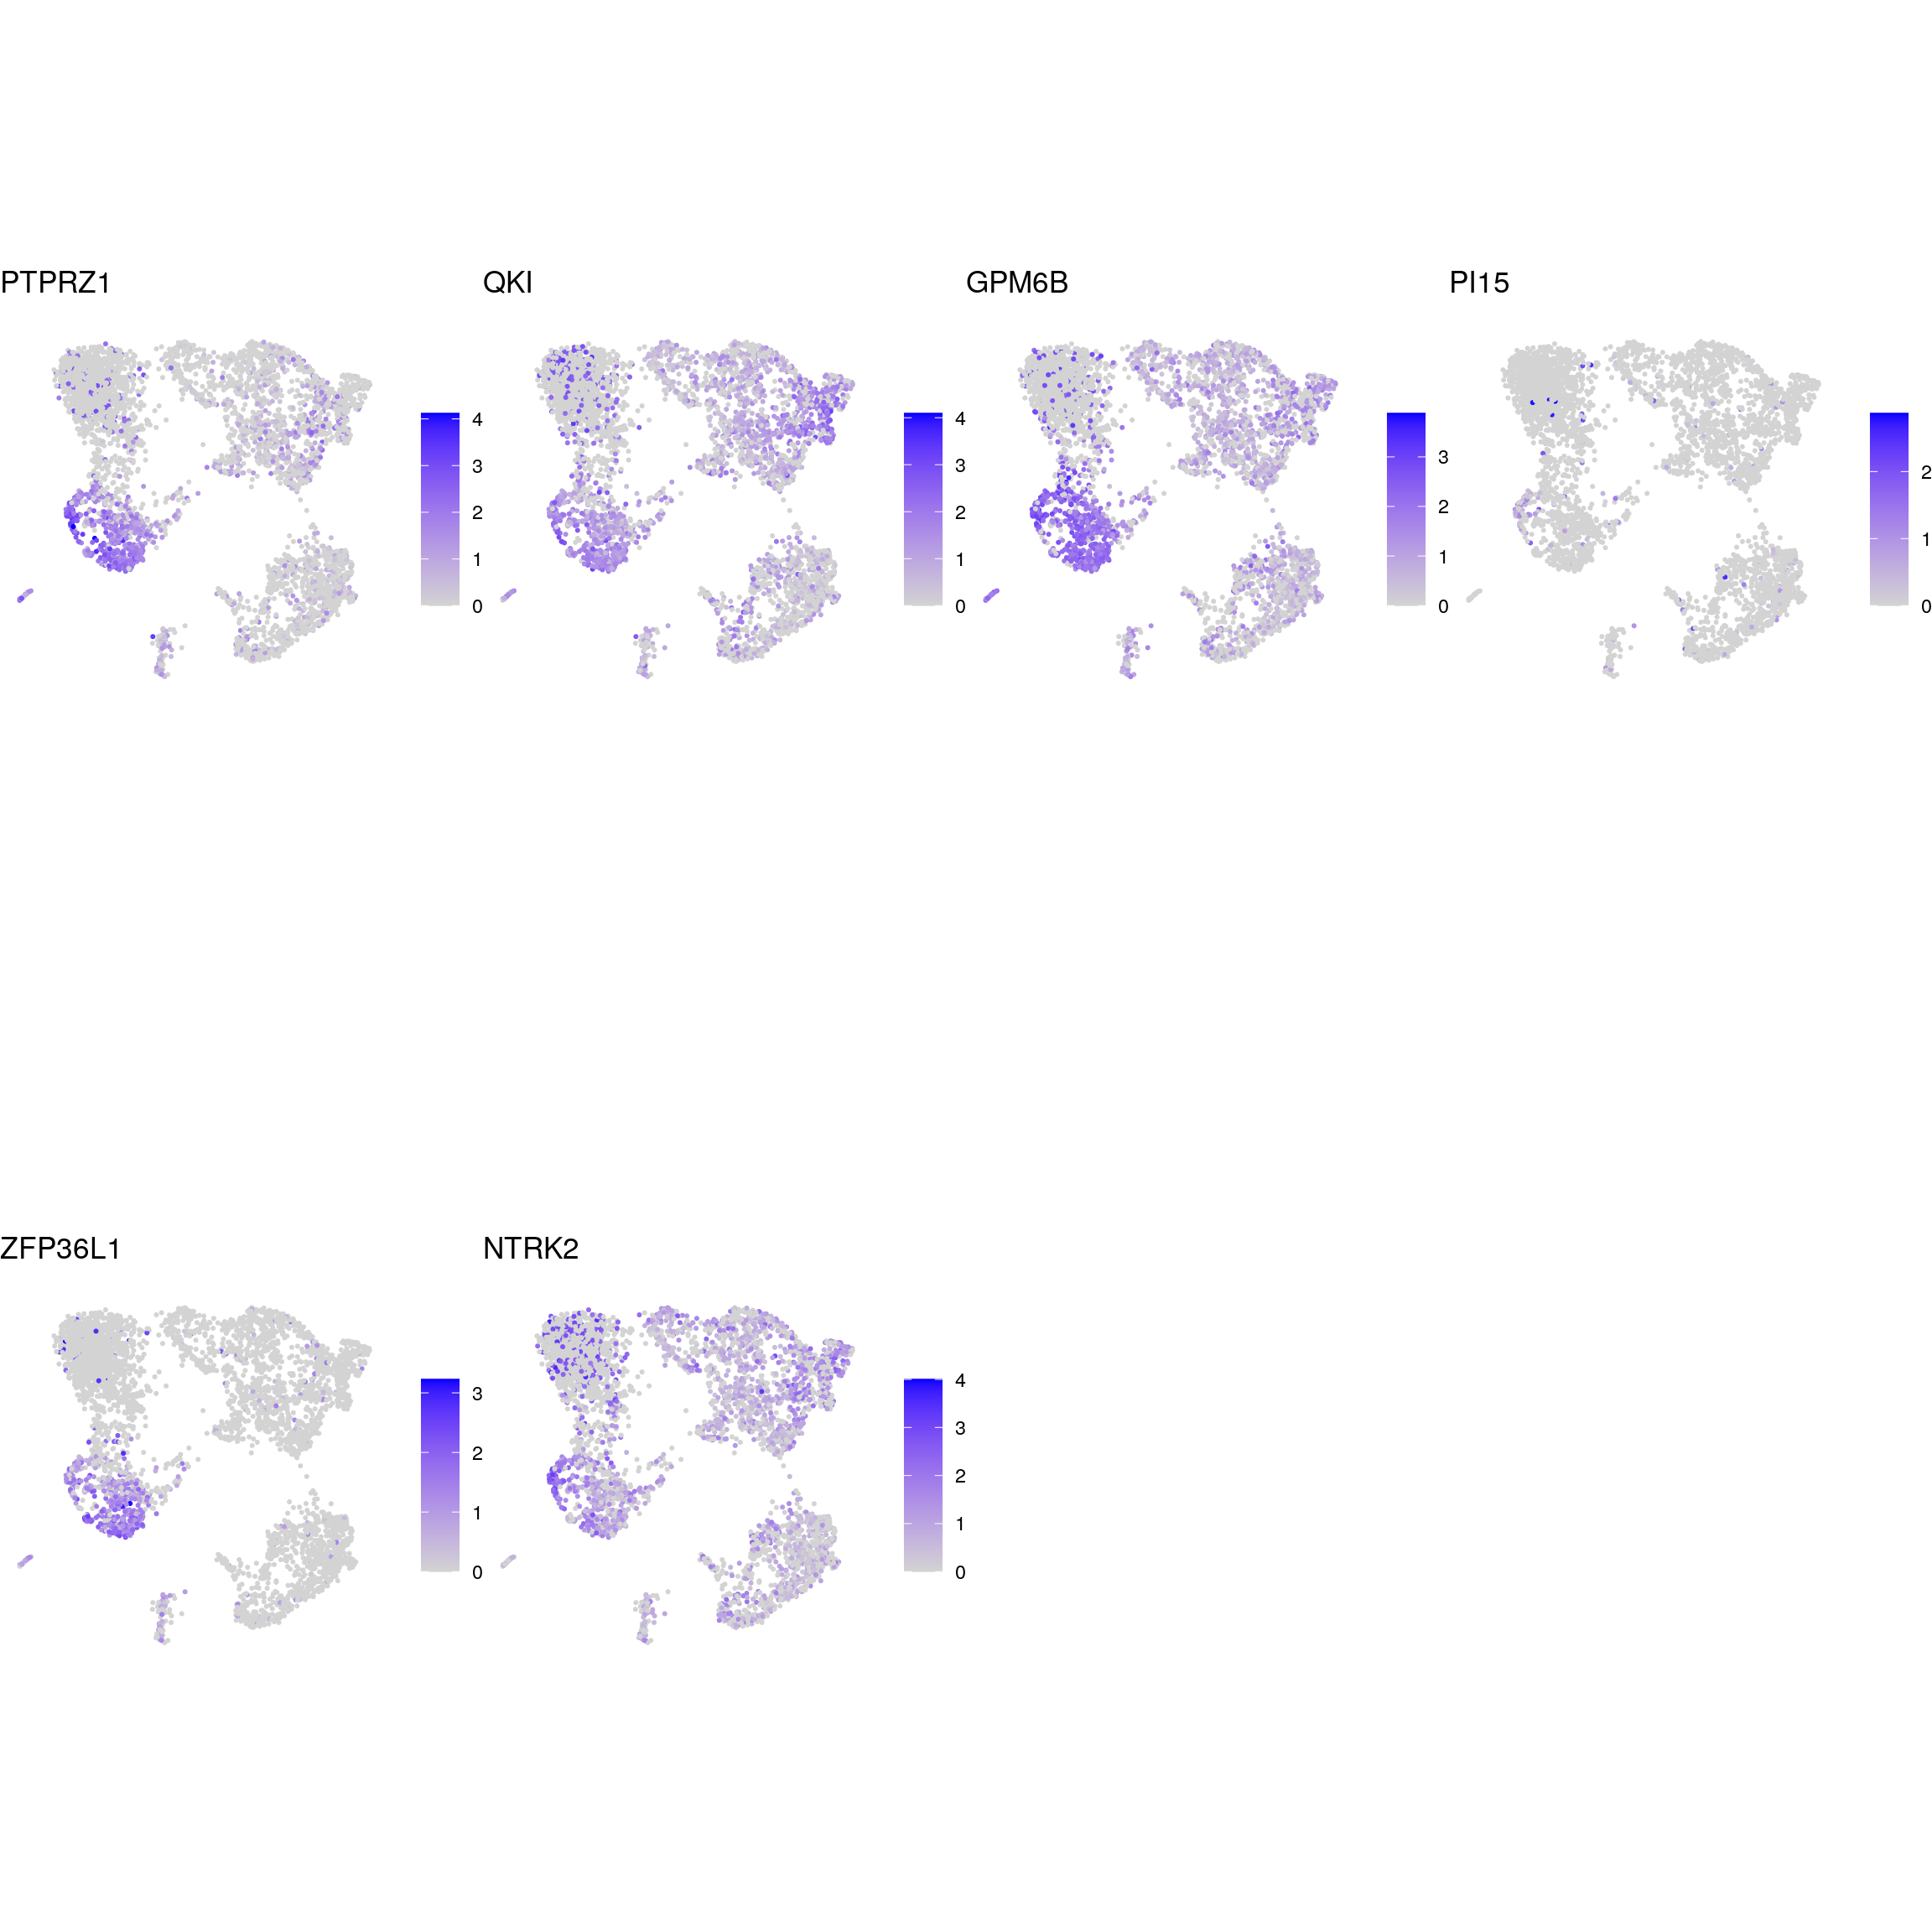
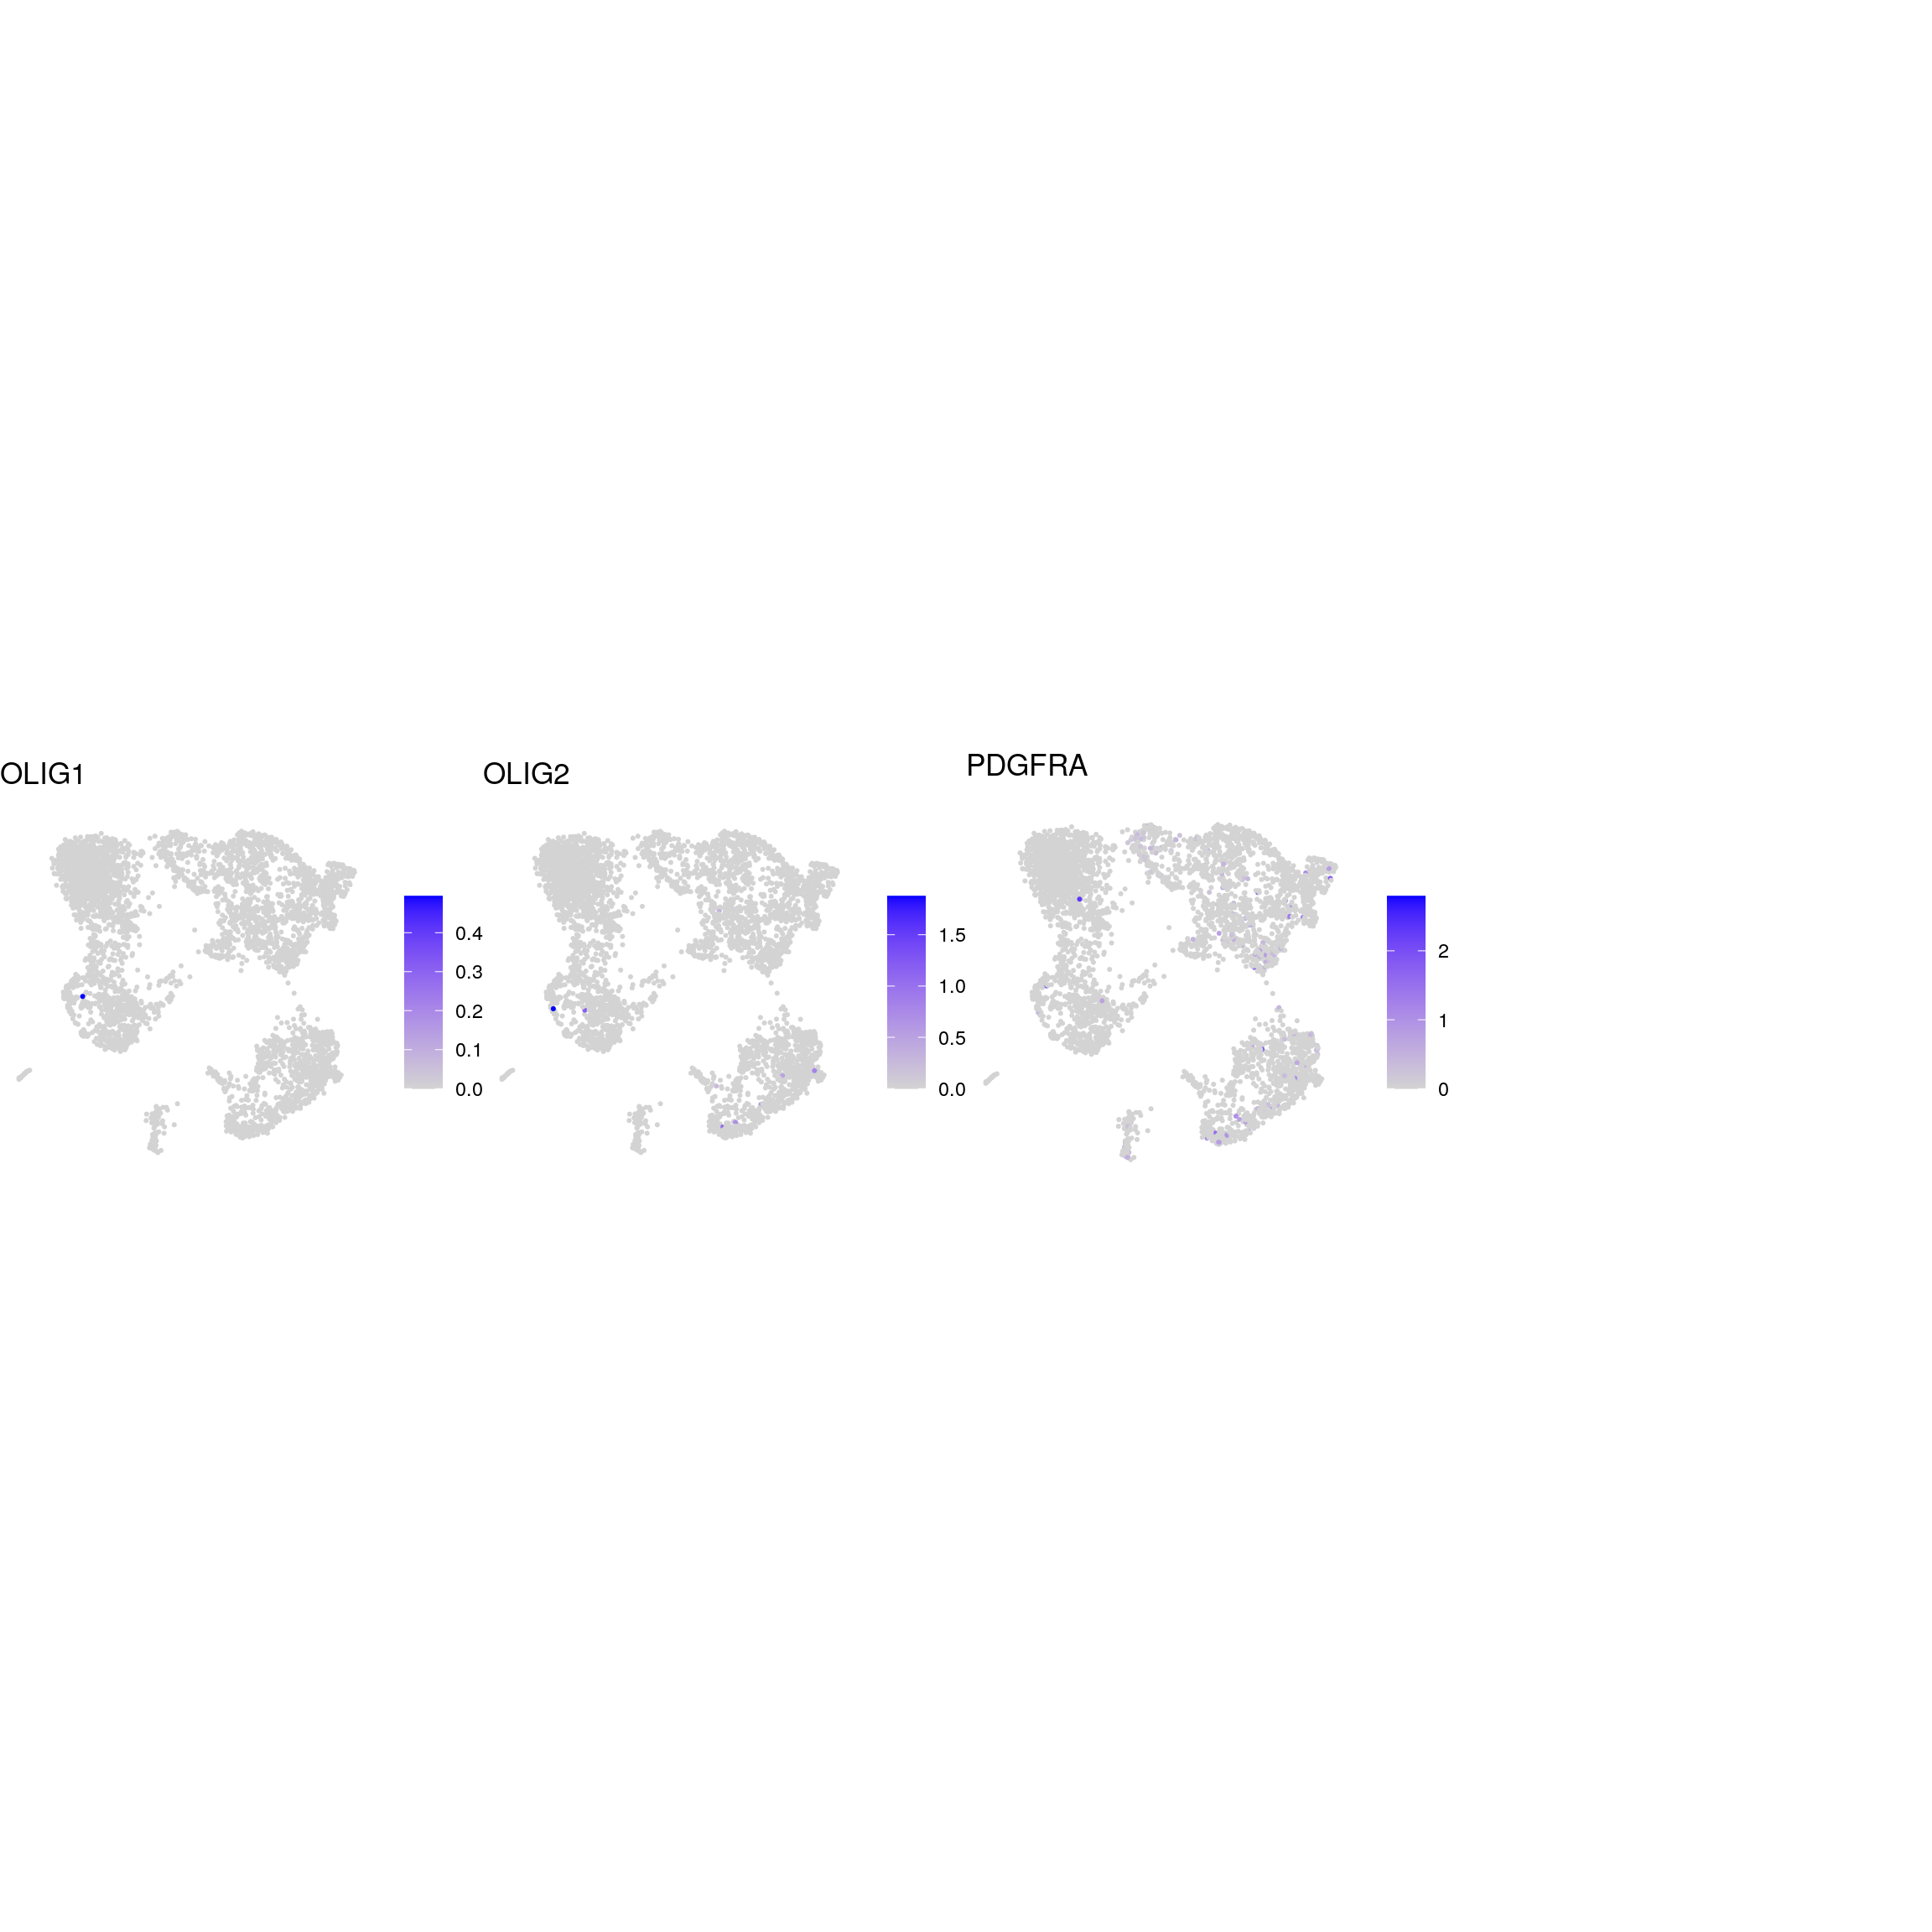
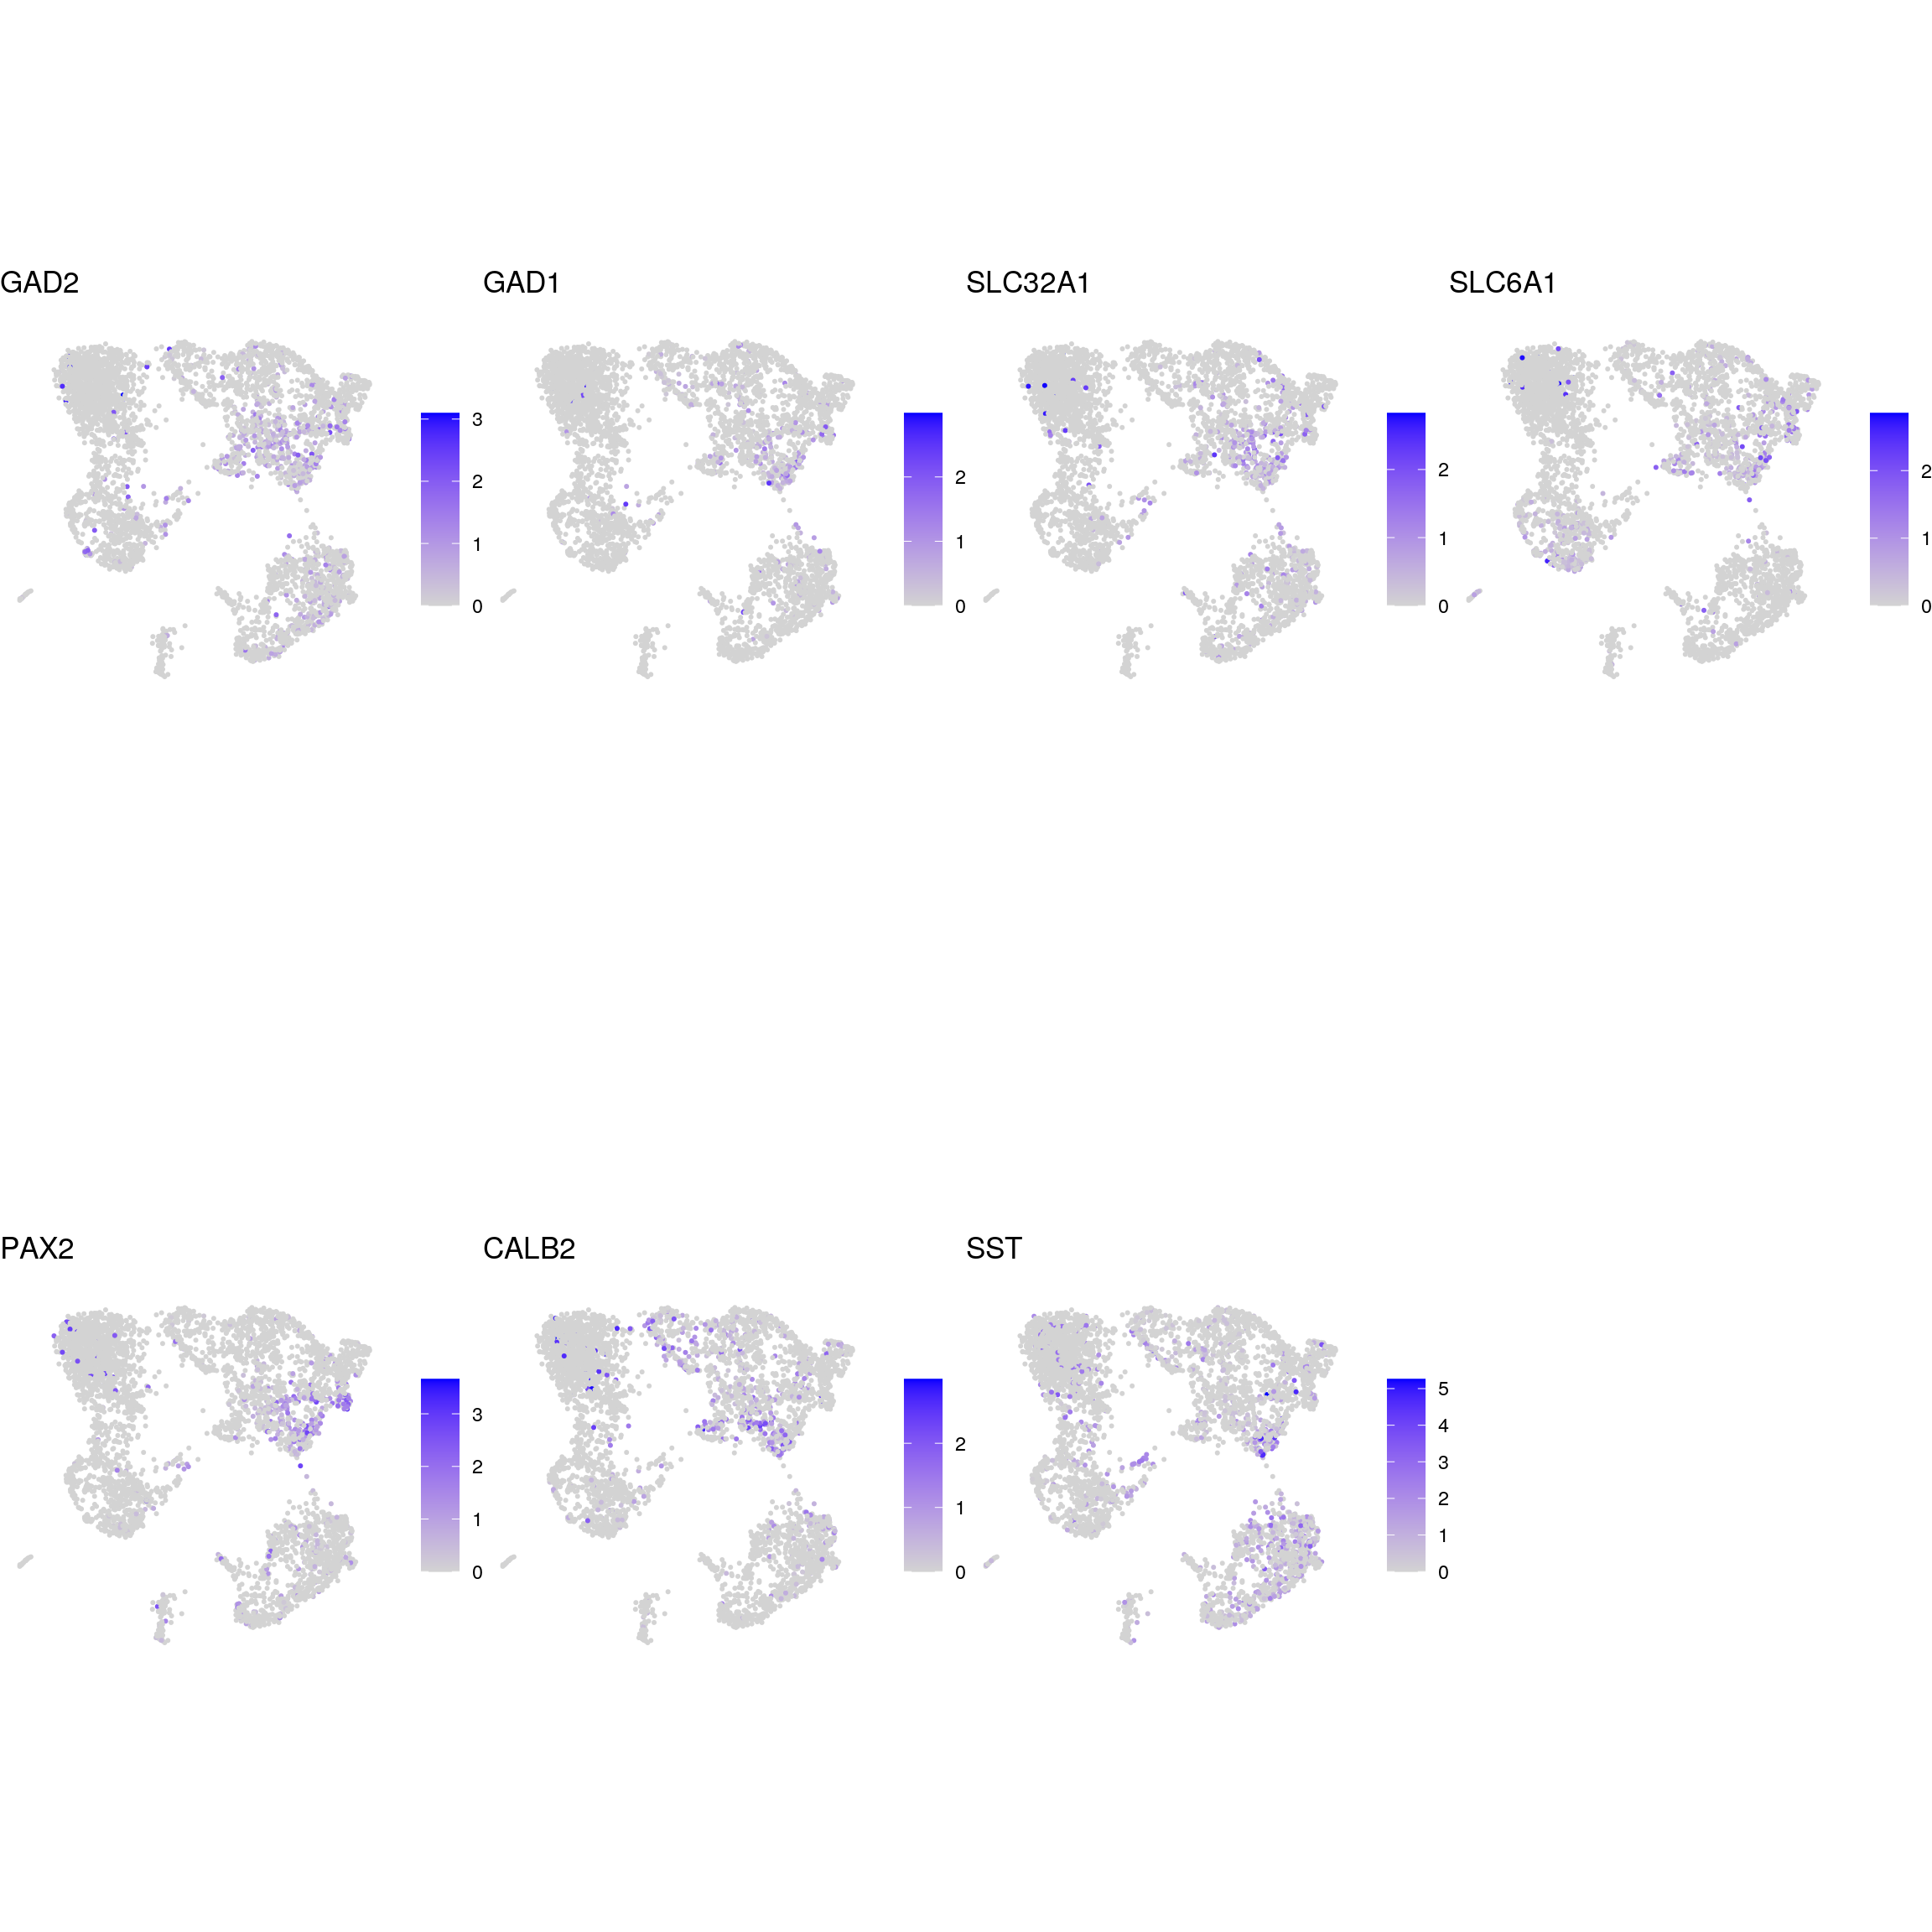
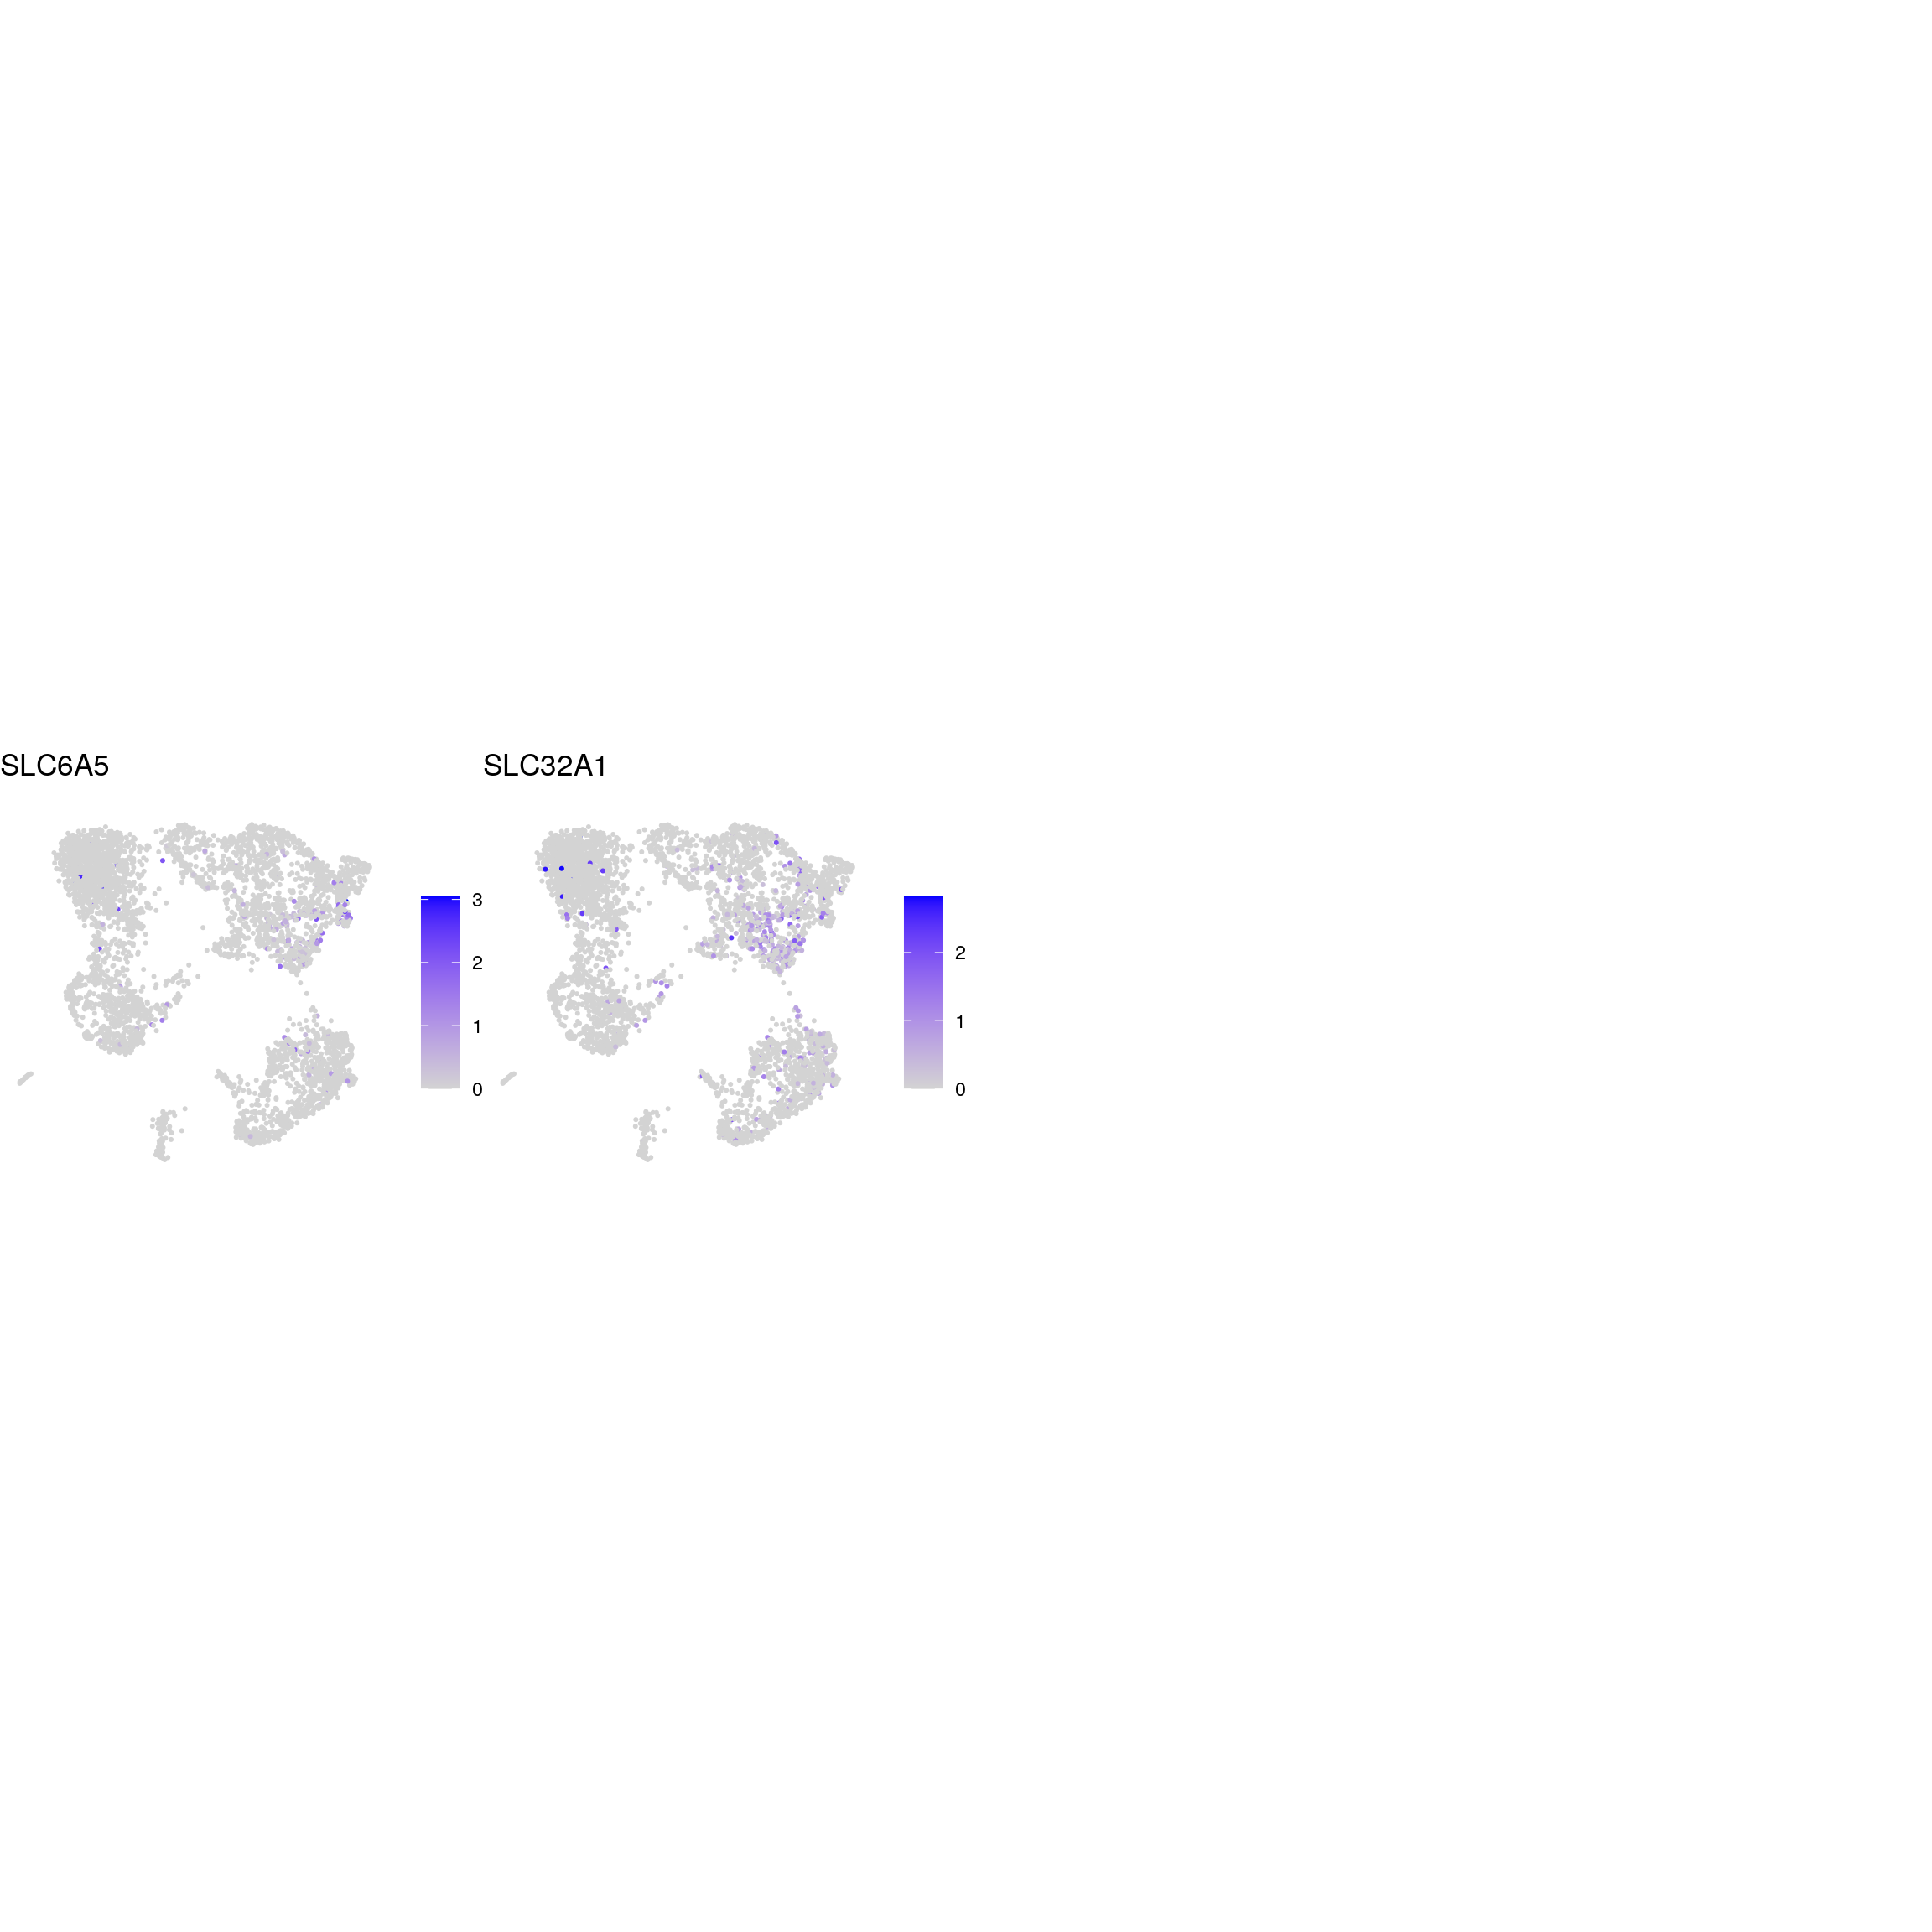
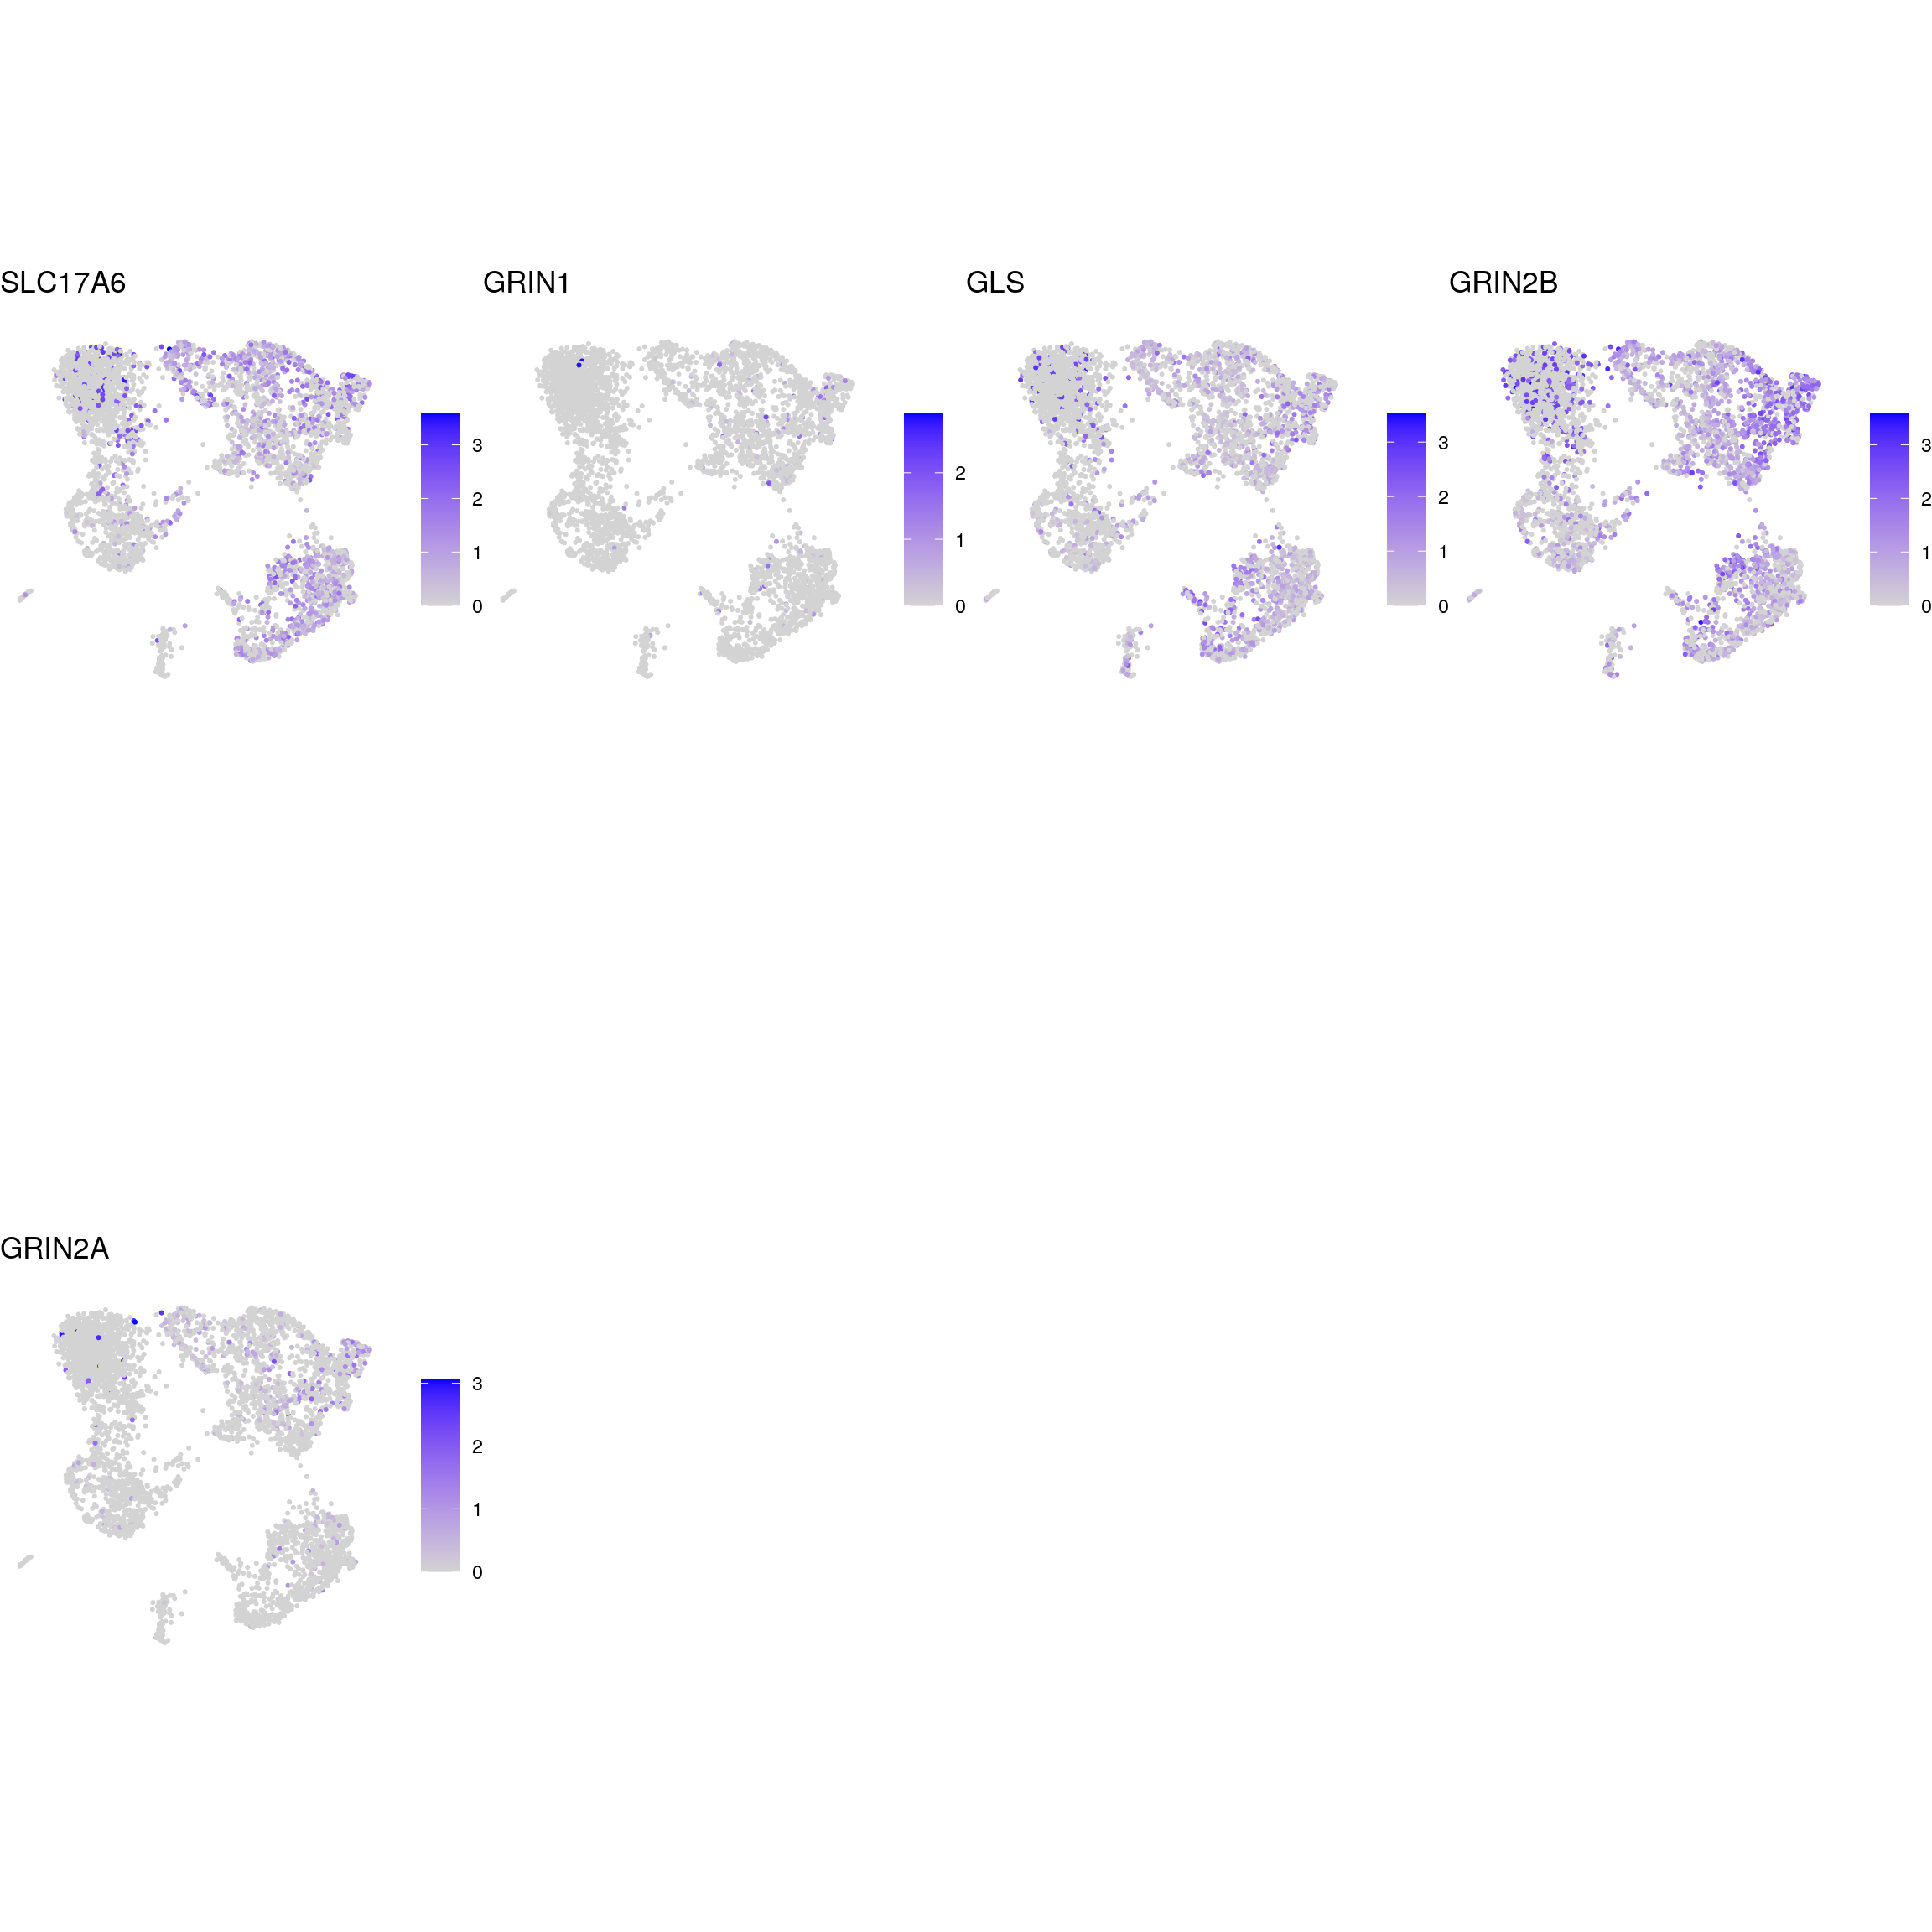
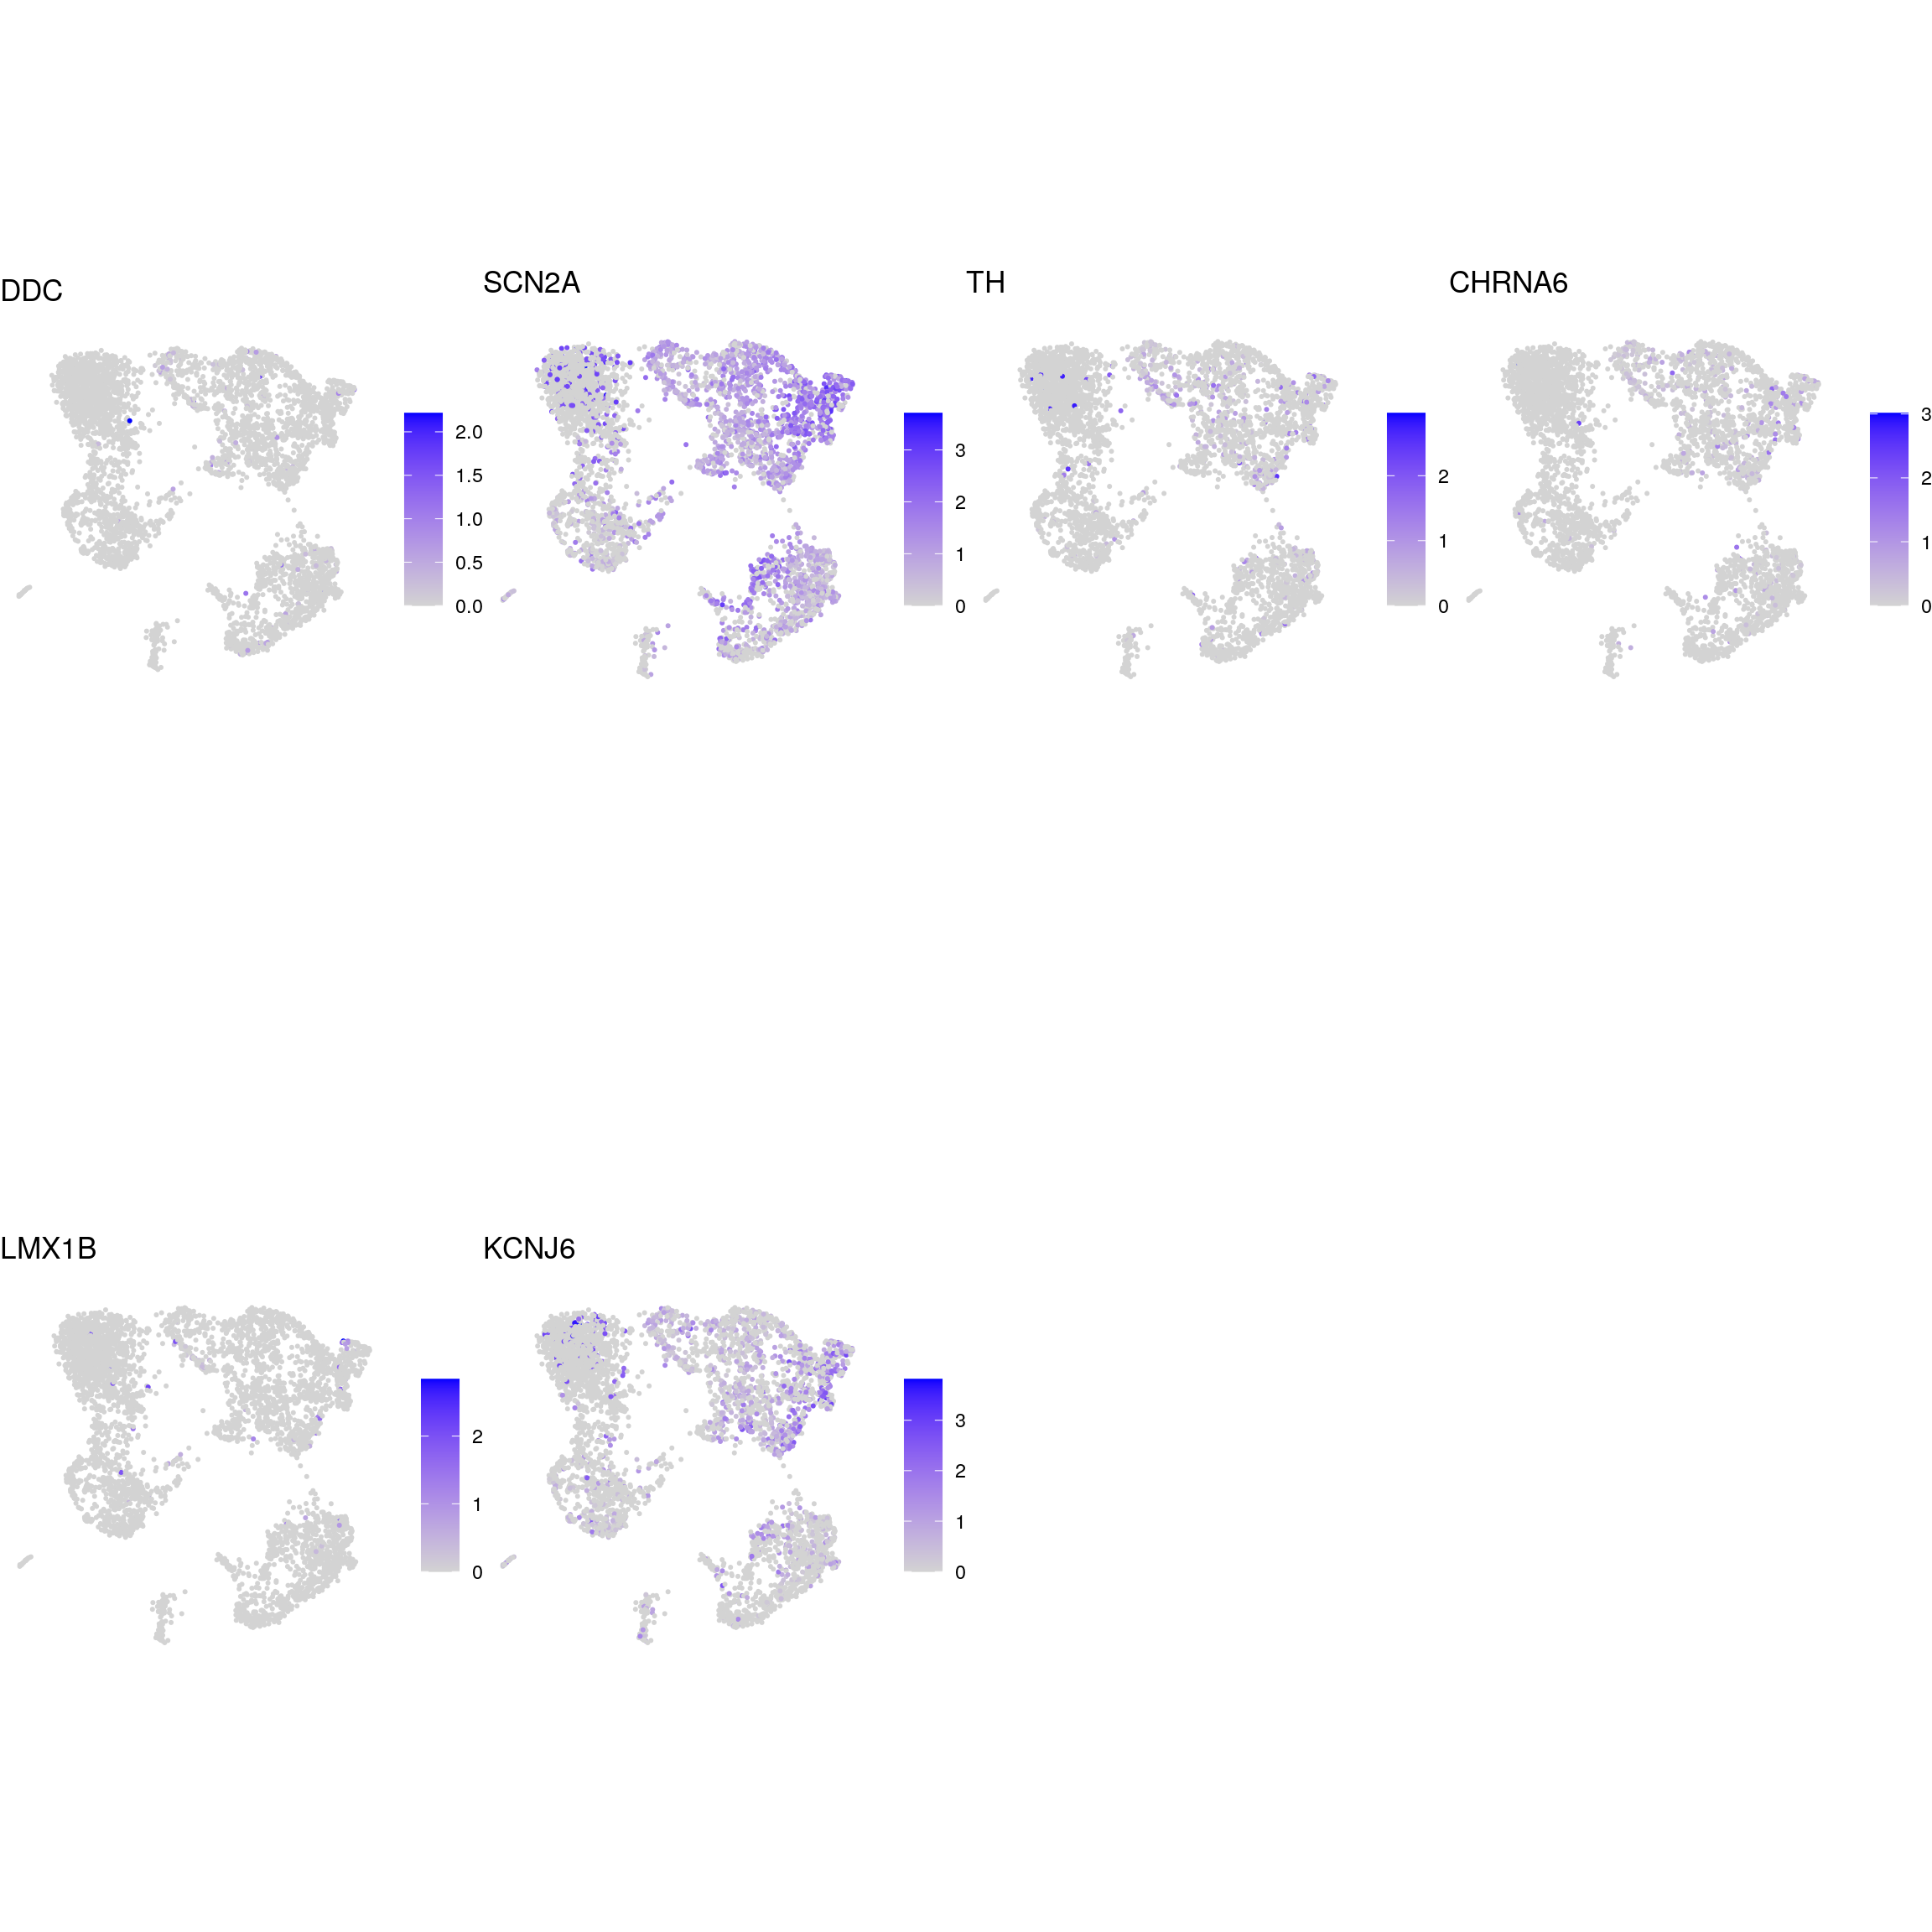
DR colored by marker expression
# UMAPs colored by marker-expression
for (m in seq_along(fs)) {
    cat("## ", names(fs)[m], "\n")
    ps <- lapply(seq_along(fs[[m]]), function(i) {
        if (!fs[[m]][i] %in% rownames(so)) return(NULL)
        FeaturePlot(so, features = fs[[m]][i], reduction = "umap",
                    pt.size = 0.4) +
            theme(aspect.ratio = 1, legend.position = "none") +
            ggtitle(labs[[m]][i]) + theme_void() + theme(aspect.ratio = 1)
    })
    # arrange plots in grid
    ps <- ps[!vapply(ps, is.null, logical(1))]
    p <- plot_grid(plotlist = ps, ncol = 4, label_size = 10)
    print(p)
    cat("\n\n")
}
kinase
| Version | Author | Date |
|---|---|---|
| d55a2c2 | khembach | 2021-05-19 |
## plot the expression of the endogenous TDP-43 and TDP-HA
transg <- c("ENSG00000120948.TARDBP", "ENSG00000120948.TARDBP-alevin", "TDP43-HA",
         "GA50-EGFP", "HA-GA50")
names(transg) <- c("TARDBP", "TARDBP-alevin", "TDP-HA", "GA50-EGFP", "HA-GA50")
cat("## transgenes\n")
transgenes
ps <- lapply(seq_along(transg), function(i) {
    if (!transg[i] %in% rownames(so)) return(NULL)
    FeaturePlot(so, features = transg[i], reduction = "umap", pt.size = 0.4) +
        theme(aspect.ratio = 1, legend.position = "none") +
        ggtitle(names(transg)[i]) + theme_void() + theme(aspect.ratio = 1)
})
# arrange plots in grid
ps <- ps[!vapply(ps, is.null, logical(1))]
p <- plot_grid(plotlist = ps, ncol = 4, label_size = 10)
print(p)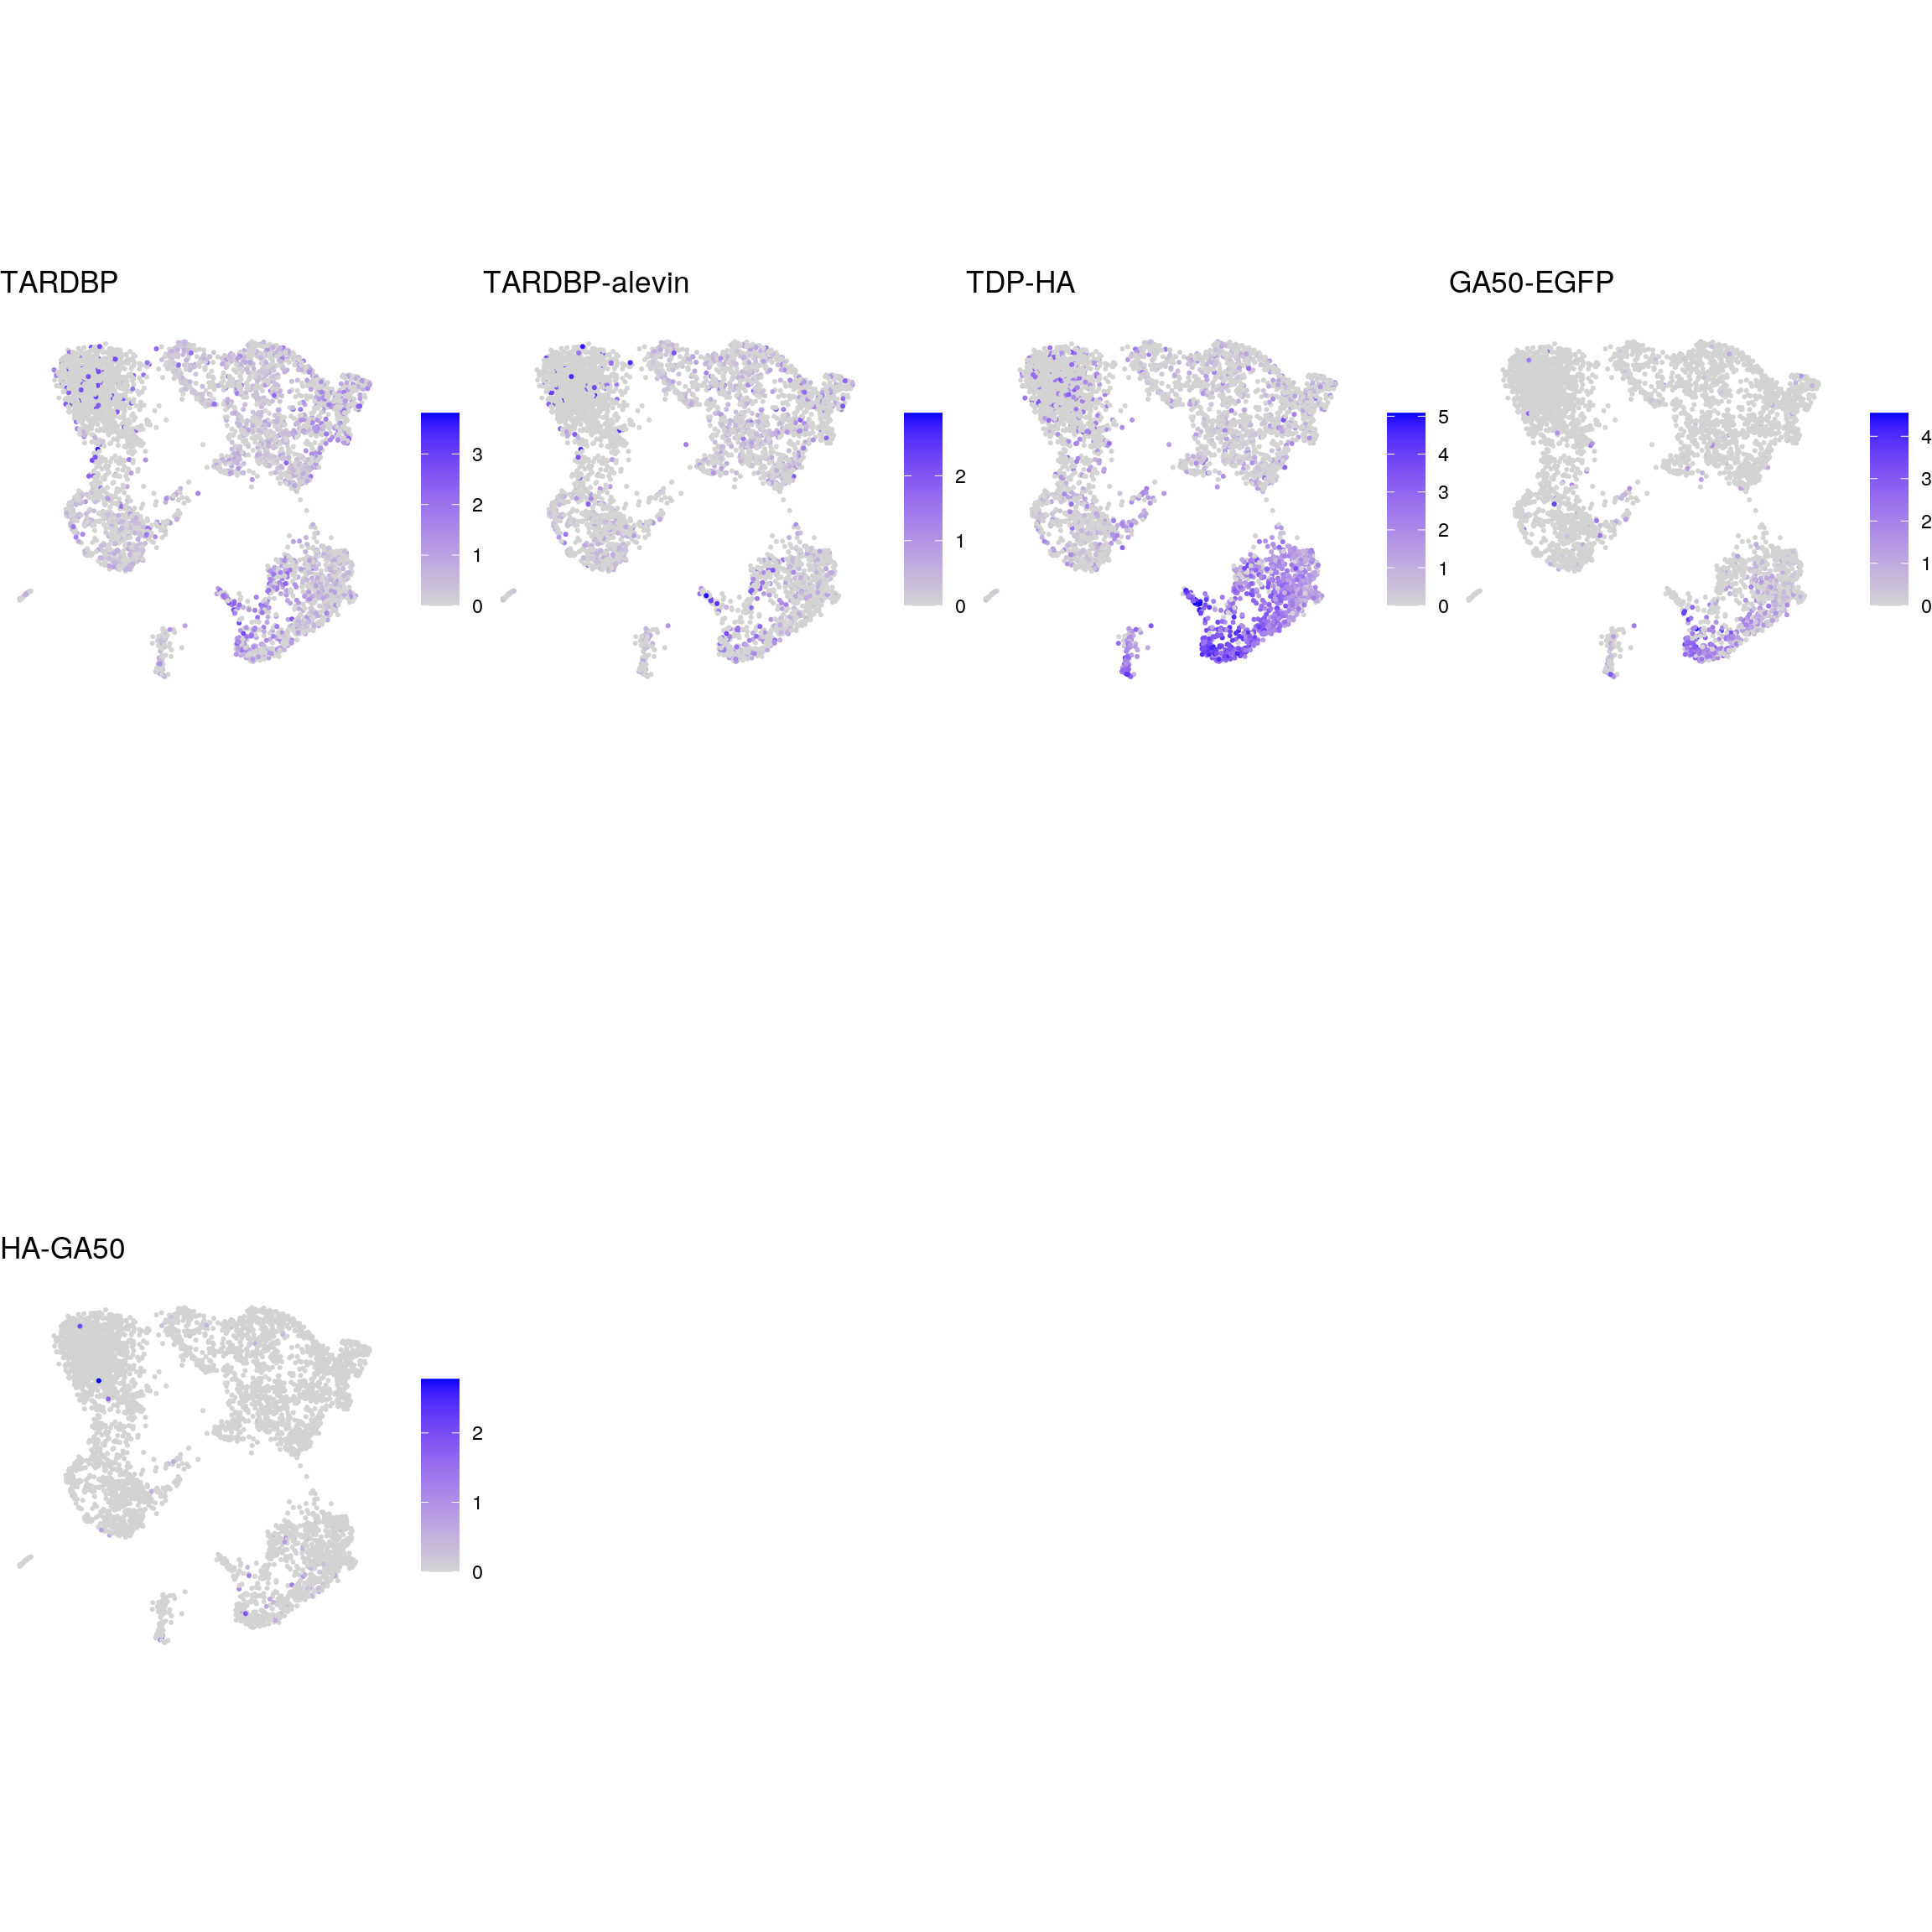
| Version | Author | Date |
|---|---|---|
| d55a2c2 | khembach | 2021-05-19 |
cat("\n\n")Reactive astrocyte markers
## source file with list of known marker genes
source(file.path("data", "reactive_astrocyte_markers.R"))
fs <- lapply(fs, sapply, function(g)
    grep(pattern = paste0("\\.", g, "$"), rownames(sce), value = TRUE)
  )
fs <- lapply(fs, function(x) unlist(x[lengths(x) !=0]) )

gs <- gsub(".*\\.", "", unlist(fs))
ns <- vapply(fs, length, numeric(1))
ks <- rep.int(names(fs), ns)
labs <- lapply(fs, function(x) gsub(".*\\.", "",x))
Heatmap of reactive astrocyte markers
# compute cluster-marker means
ms_by_cluster <- lapply(fs, function(gs) vapply(cs_by_k, function(i)
        Matrix::rowMeans(logcounts(sce)[gs, i, drop = FALSE]),
        numeric(length(gs))))
# prep. for plotting & scale b/w 0 and 1
mat <- do.call("rbind", ms_by_cluster)
mat <- muscat:::.scale(mat)
rownames(mat) <- gs
cols <- muscat:::.cluster_colors[seq_along(fs)]
cols <- setNames(cols, names(fs))
row_anno <- rowAnnotation(
    df = data.frame(label = factor(ks, levels = names(fs))),
    col = list(label = cols), gp = gpar(col = "white"))
# percentage of cells from each of the samples per cluster
sample_props <- prop.table(n_cells, margin = 1)
col_mat <- as.matrix(unclass(sample_props))
sample_cols <- c("#882255", "#11588A",  "#117733")
sample_cols <- setNames(sample_cols, colnames(col_mat))
col_anno <- HeatmapAnnotation(
    perc_sample = anno_barplot(col_mat, gp = gpar(fill = sample_cols),
                               height = unit(2, "cm"),
                               border = FALSE),
    annotation_label = "fraction of sample\nin cluster",
    gap = unit(10, "points"))
col_lgd <- Legend(labels = names(sample_cols),
       title = "sample",
       legend_gp = gpar(fill = sample_cols))

hm <- Heatmap(mat,
    name = "scaled avg.\nexpression",
    col = viridis(10),
    cluster_rows = FALSE,
    cluster_columns = FALSE,
    row_names_side = "left",
    column_title = "cluster_id",
    column_title_side = "bottom",
    column_names_side = "bottom",
    column_names_rot = 0,
    column_names_centered = TRUE,
    rect_gp = gpar(col = "white"),
    left_annotation = row_anno,
    top_annotation = col_anno)
draw(hm, annotation_legend_list = list(col_lgd))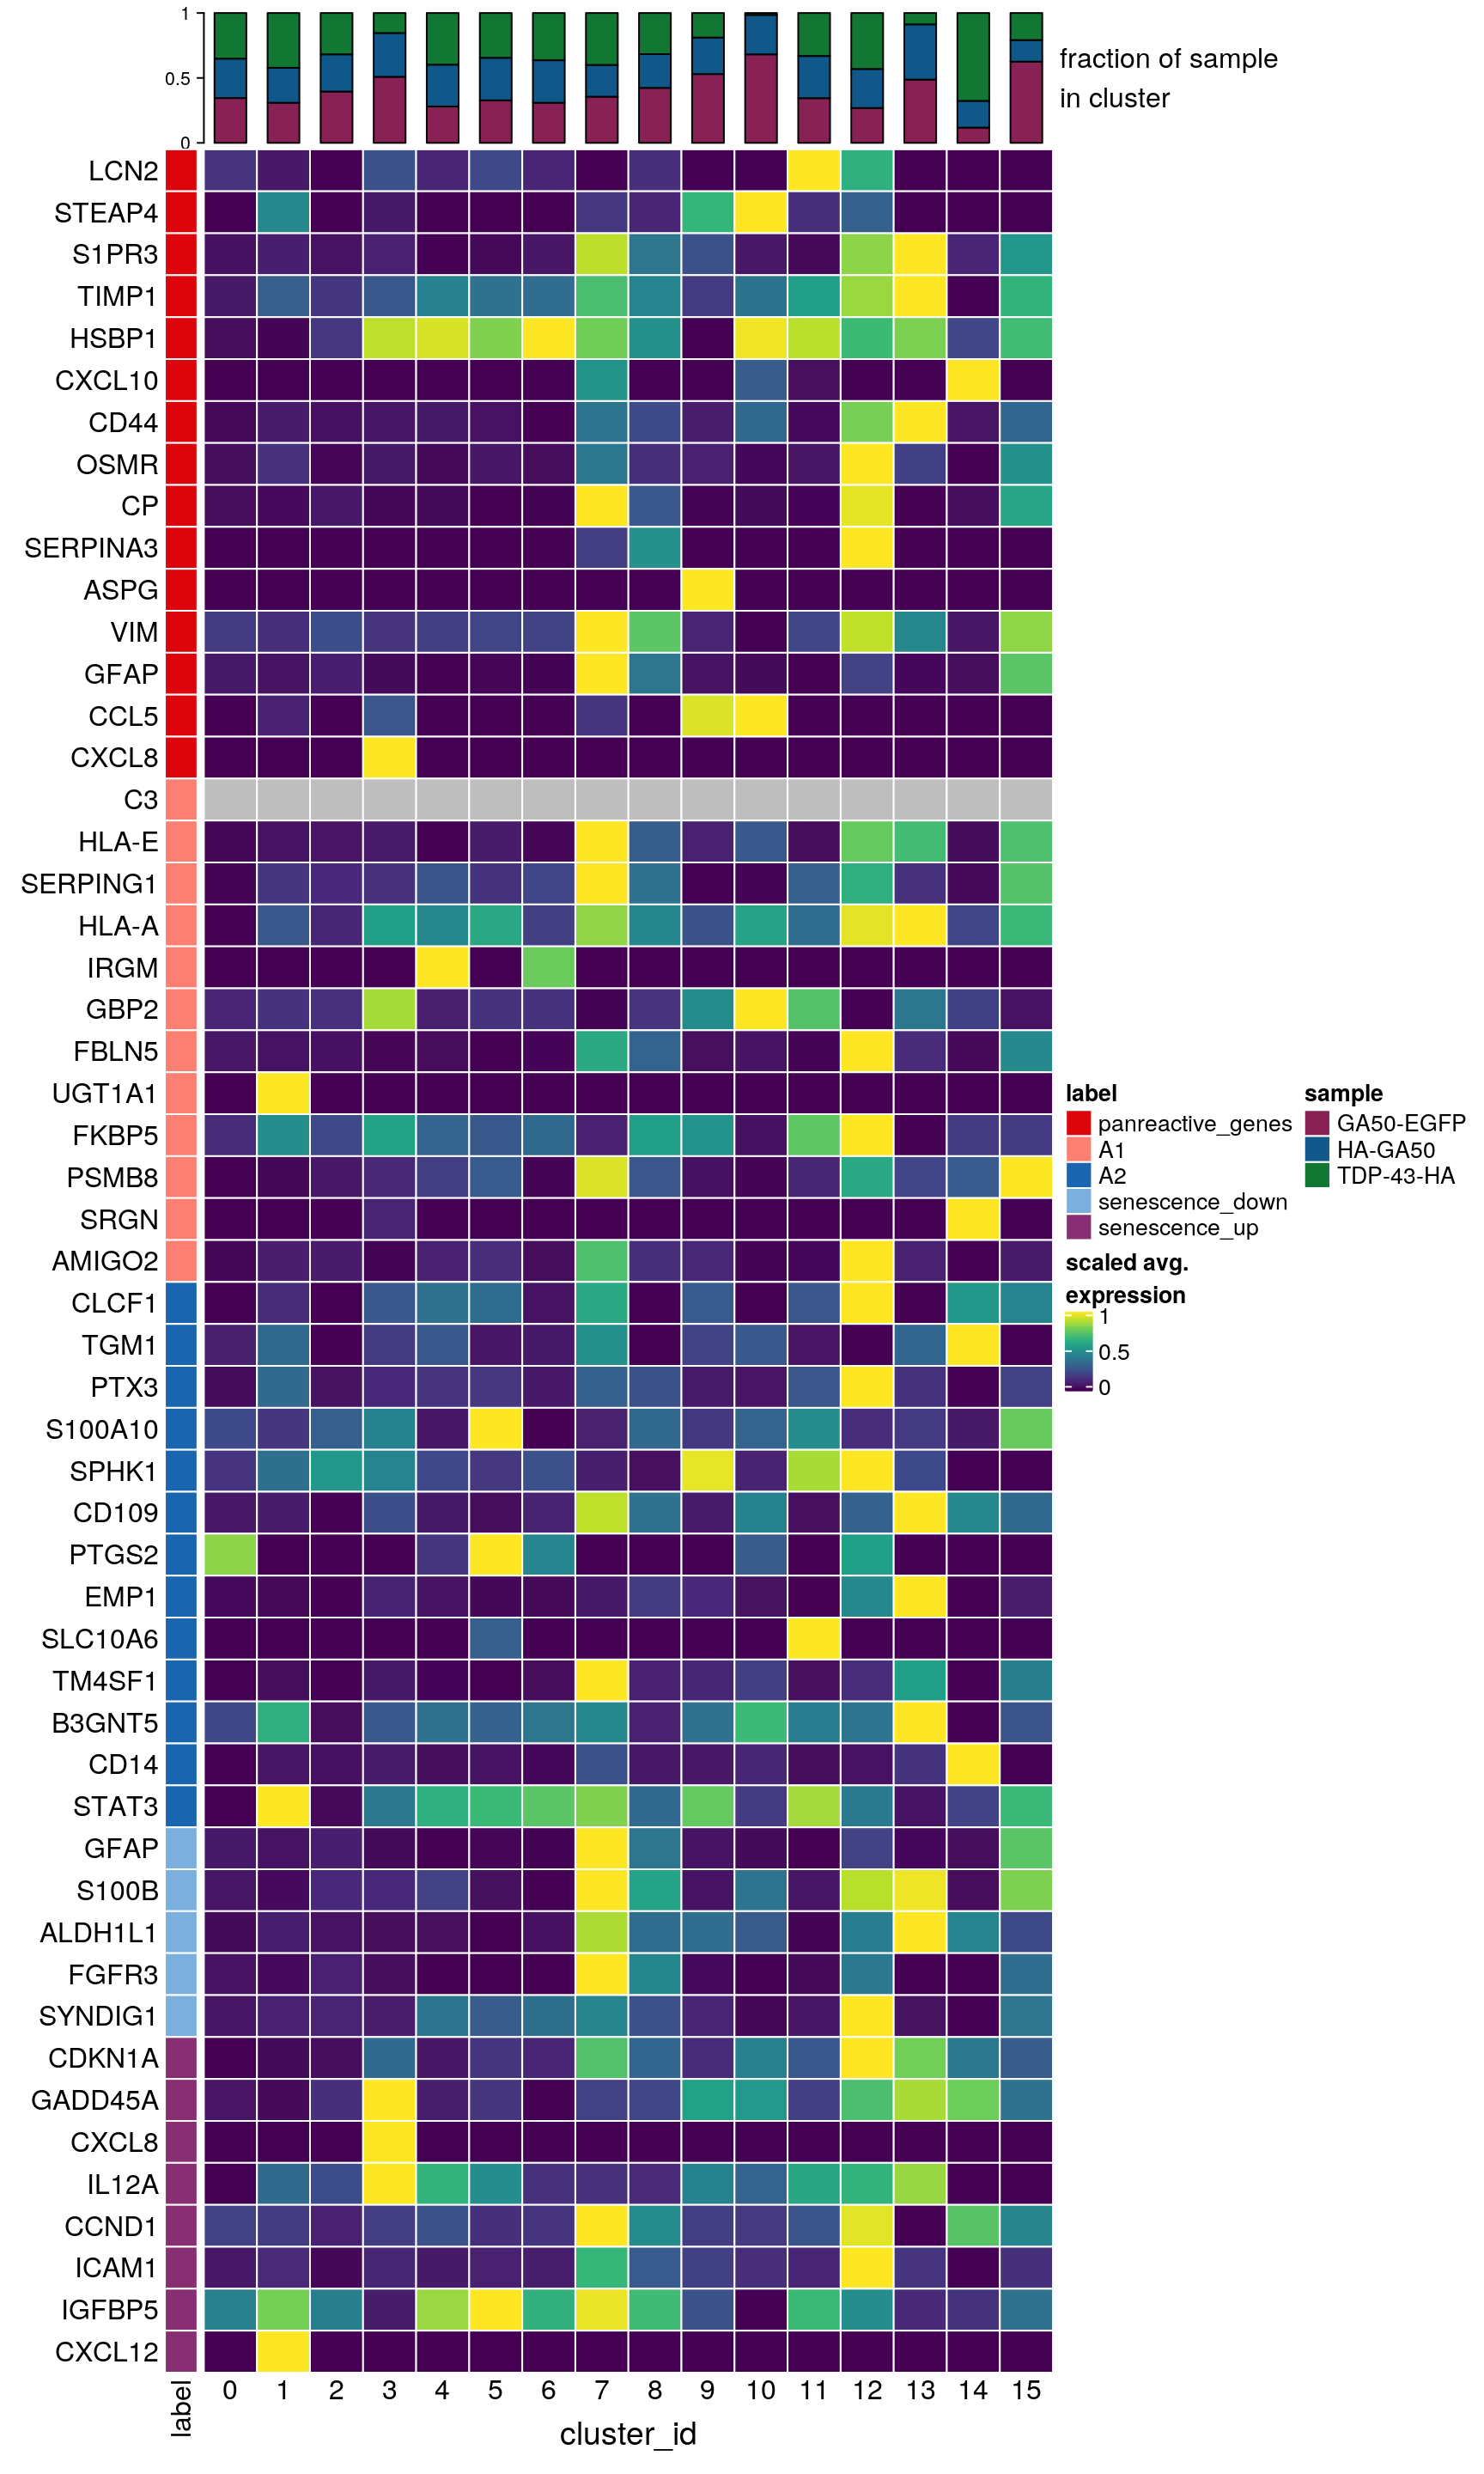
| Version | Author | Date |
|---|---|---|
| d55a2c2 | khembach | 2021-05-19 |
Marker genes for virus cell tropism
## source file with list of known marker genes
source(file.path("data", "virus_cell_tropism_markers.R"))
fs <- lapply(fs, sapply, function(g)
    grep(pattern = paste0("\\.", g, "$"), rownames(sce), value = TRUE)
  )
fs <- lapply(fs, function(x) unlist(x[lengths(x) !=0]) )

gs <- gsub(".*\\.", "", unlist(fs))
ns <- vapply(fs, length, numeric(1))
ks <- rep.int(names(fs), ns)
labs <- lapply(fs, function(x) gsub(".*\\.", "",x))
Heatmap of virus cell tropism markers
# compute cluster-marker means
ms_by_cluster <- lapply(fs, function(gs) vapply(cs_by_k, function(i)
        Matrix::rowMeans(logcounts(sce)[gs, i, drop = FALSE]),
        numeric(length(gs))))
# prep. for plotting & scale b/w 0 and 1
mat <- do.call("rbind", ms_by_cluster)
mat <- muscat:::.scale(mat)
rownames(mat) <- gs
cols <- muscat:::.cluster_colors[seq_along(fs)]
cols <- setNames(cols, names(fs))
row_anno <- rowAnnotation(
    df = data.frame(label = factor(ks, levels = names(fs))),
    col = list(label = cols), gp = gpar(col = "white"))
# percentage of cells from each of the samples per cluster
sample_props <- prop.table(n_cells, margin = 1)
col_mat <- as.matrix(unclass(sample_props))
sample_cols <- c("#882255", "#11588A",  "#117733")
sample_cols <- setNames(sample_cols, colnames(col_mat))
col_anno <- HeatmapAnnotation(
    perc_sample = anno_barplot(col_mat, gp = gpar(fill = sample_cols),
                               height = unit(2, "cm"),
                               border = FALSE),
    annotation_label = "fraction of sample\nin cluster",
    gap = unit(10, "points"))
col_lgd <- Legend(labels = names(sample_cols),
       title = "sample",
       legend_gp = gpar(fill = sample_cols))

hm <- Heatmap(mat,
    name = "scaled avg.\nexpression",
    col = viridis(10),
    cluster_rows = FALSE,
    cluster_columns = FALSE,
    row_names_side = "left",
    column_title = "cluster_id",
    column_title_side = "bottom",
    column_names_side = "bottom",
    column_names_rot = 0,
    column_names_centered = TRUE,
    rect_gp = gpar(col = "white"),
    left_annotation = row_anno,
    top_annotation = col_anno)
draw(hm, annotation_legend_list = list(col_lgd))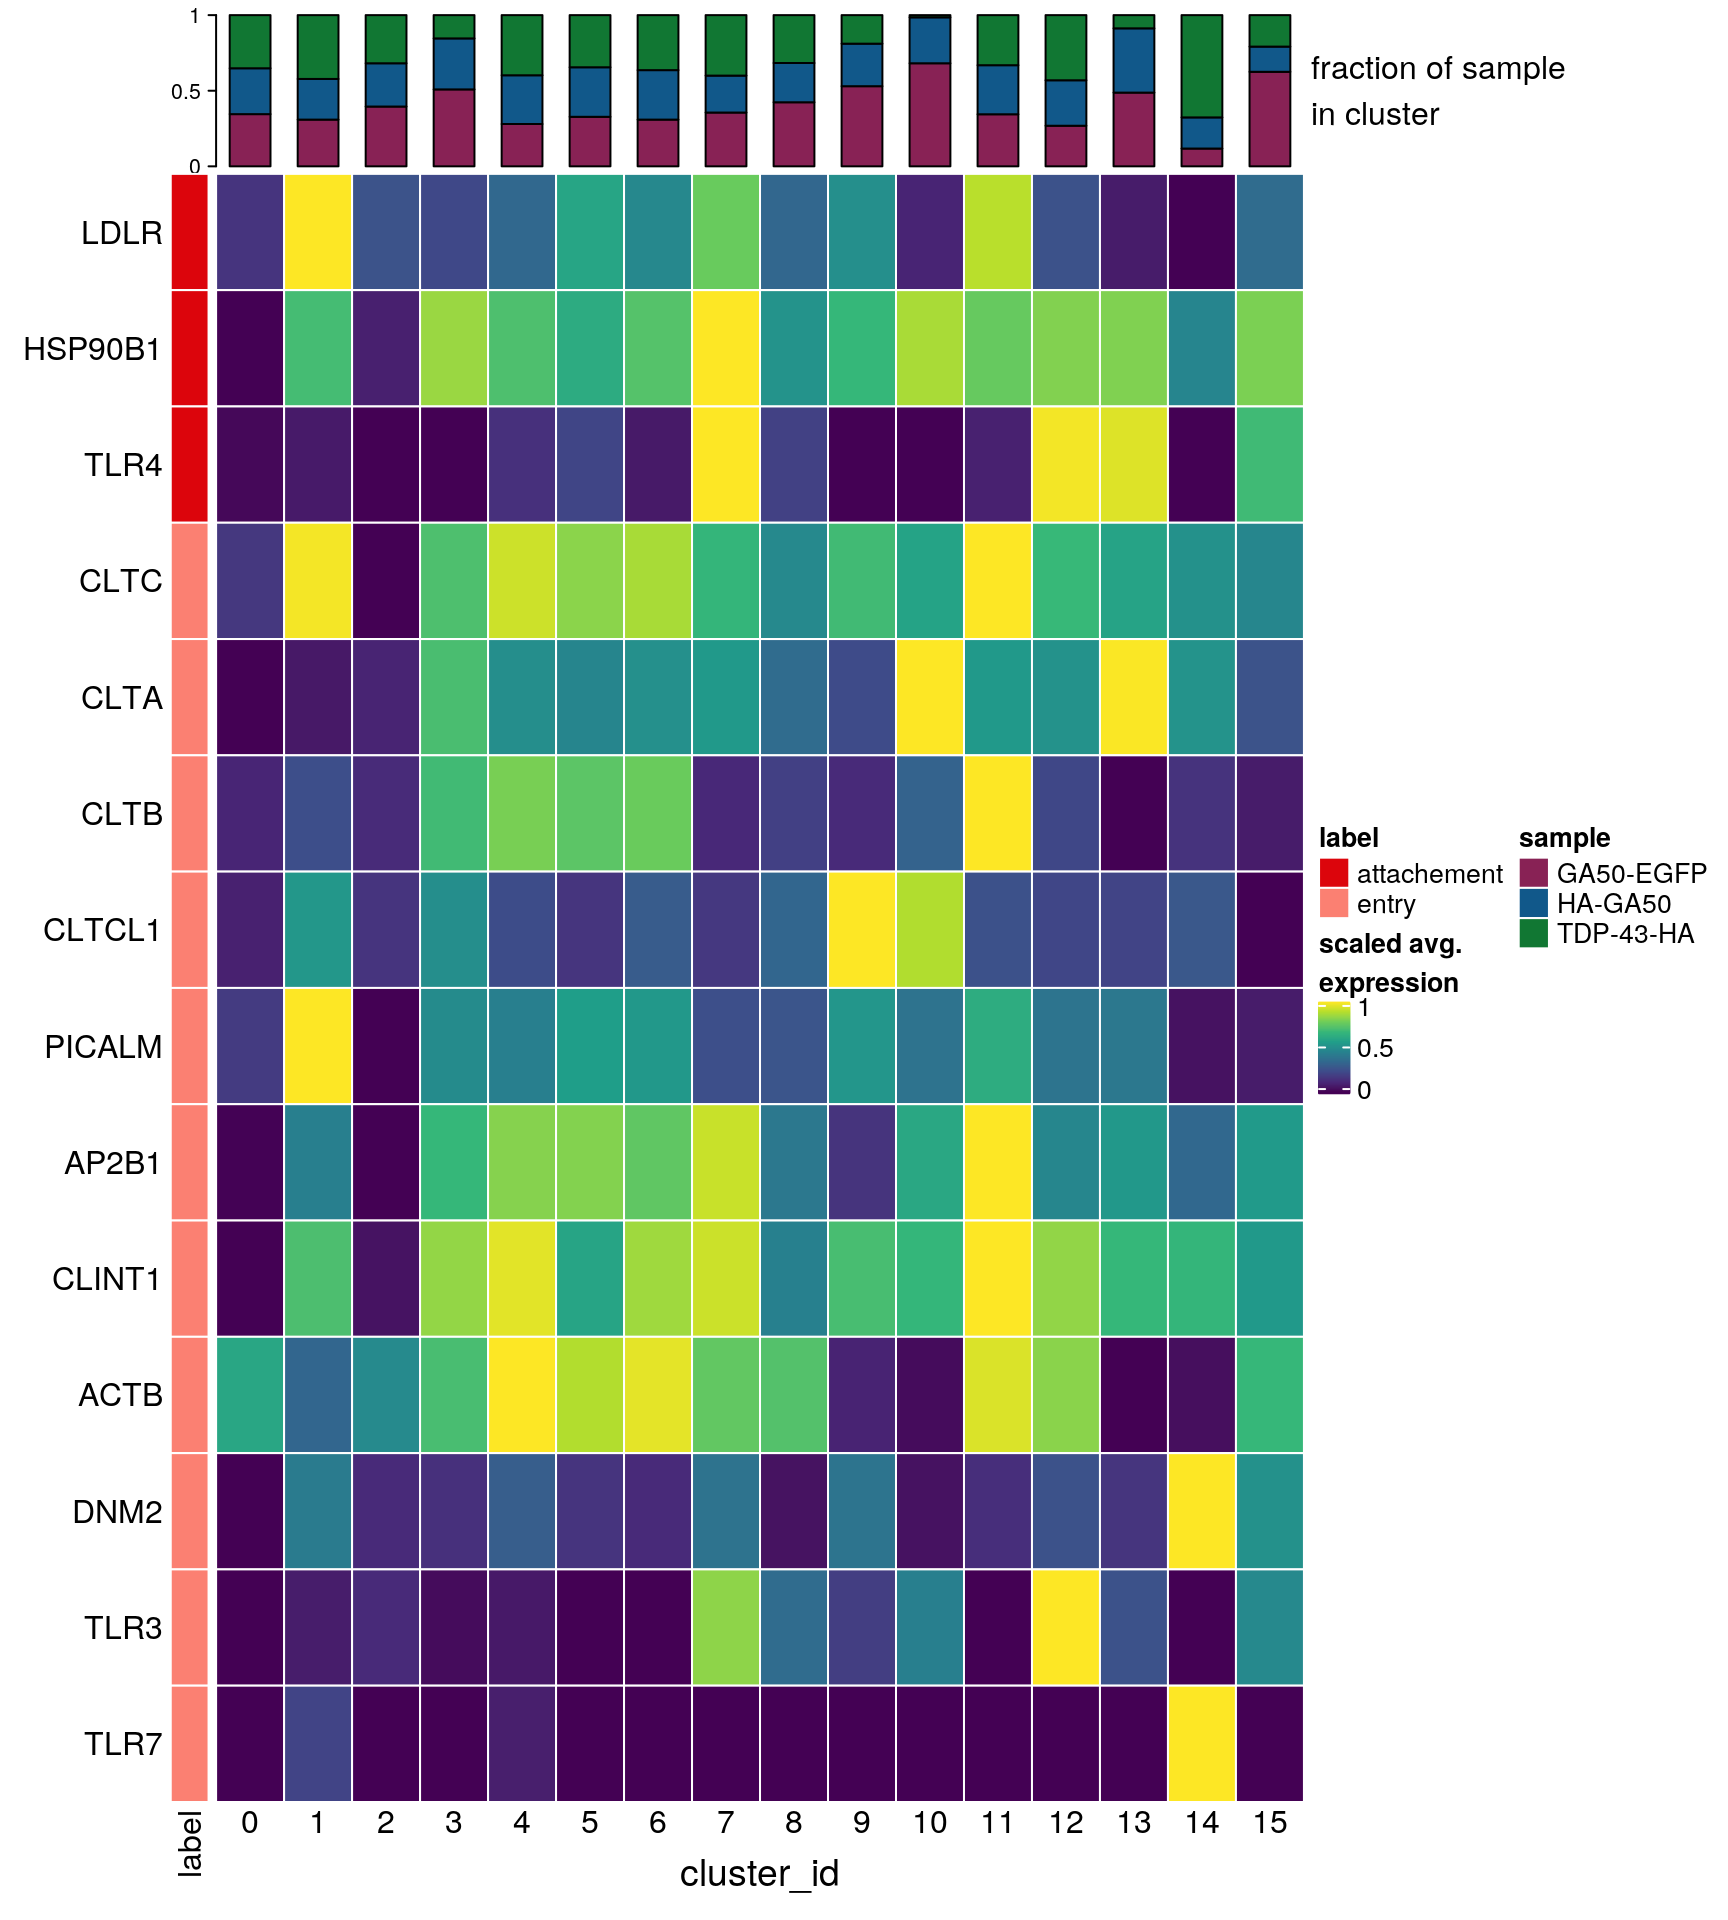
| Version | Author | Date |
|---|---|---|
| d55a2c2 | khembach | 2021-05-19 |
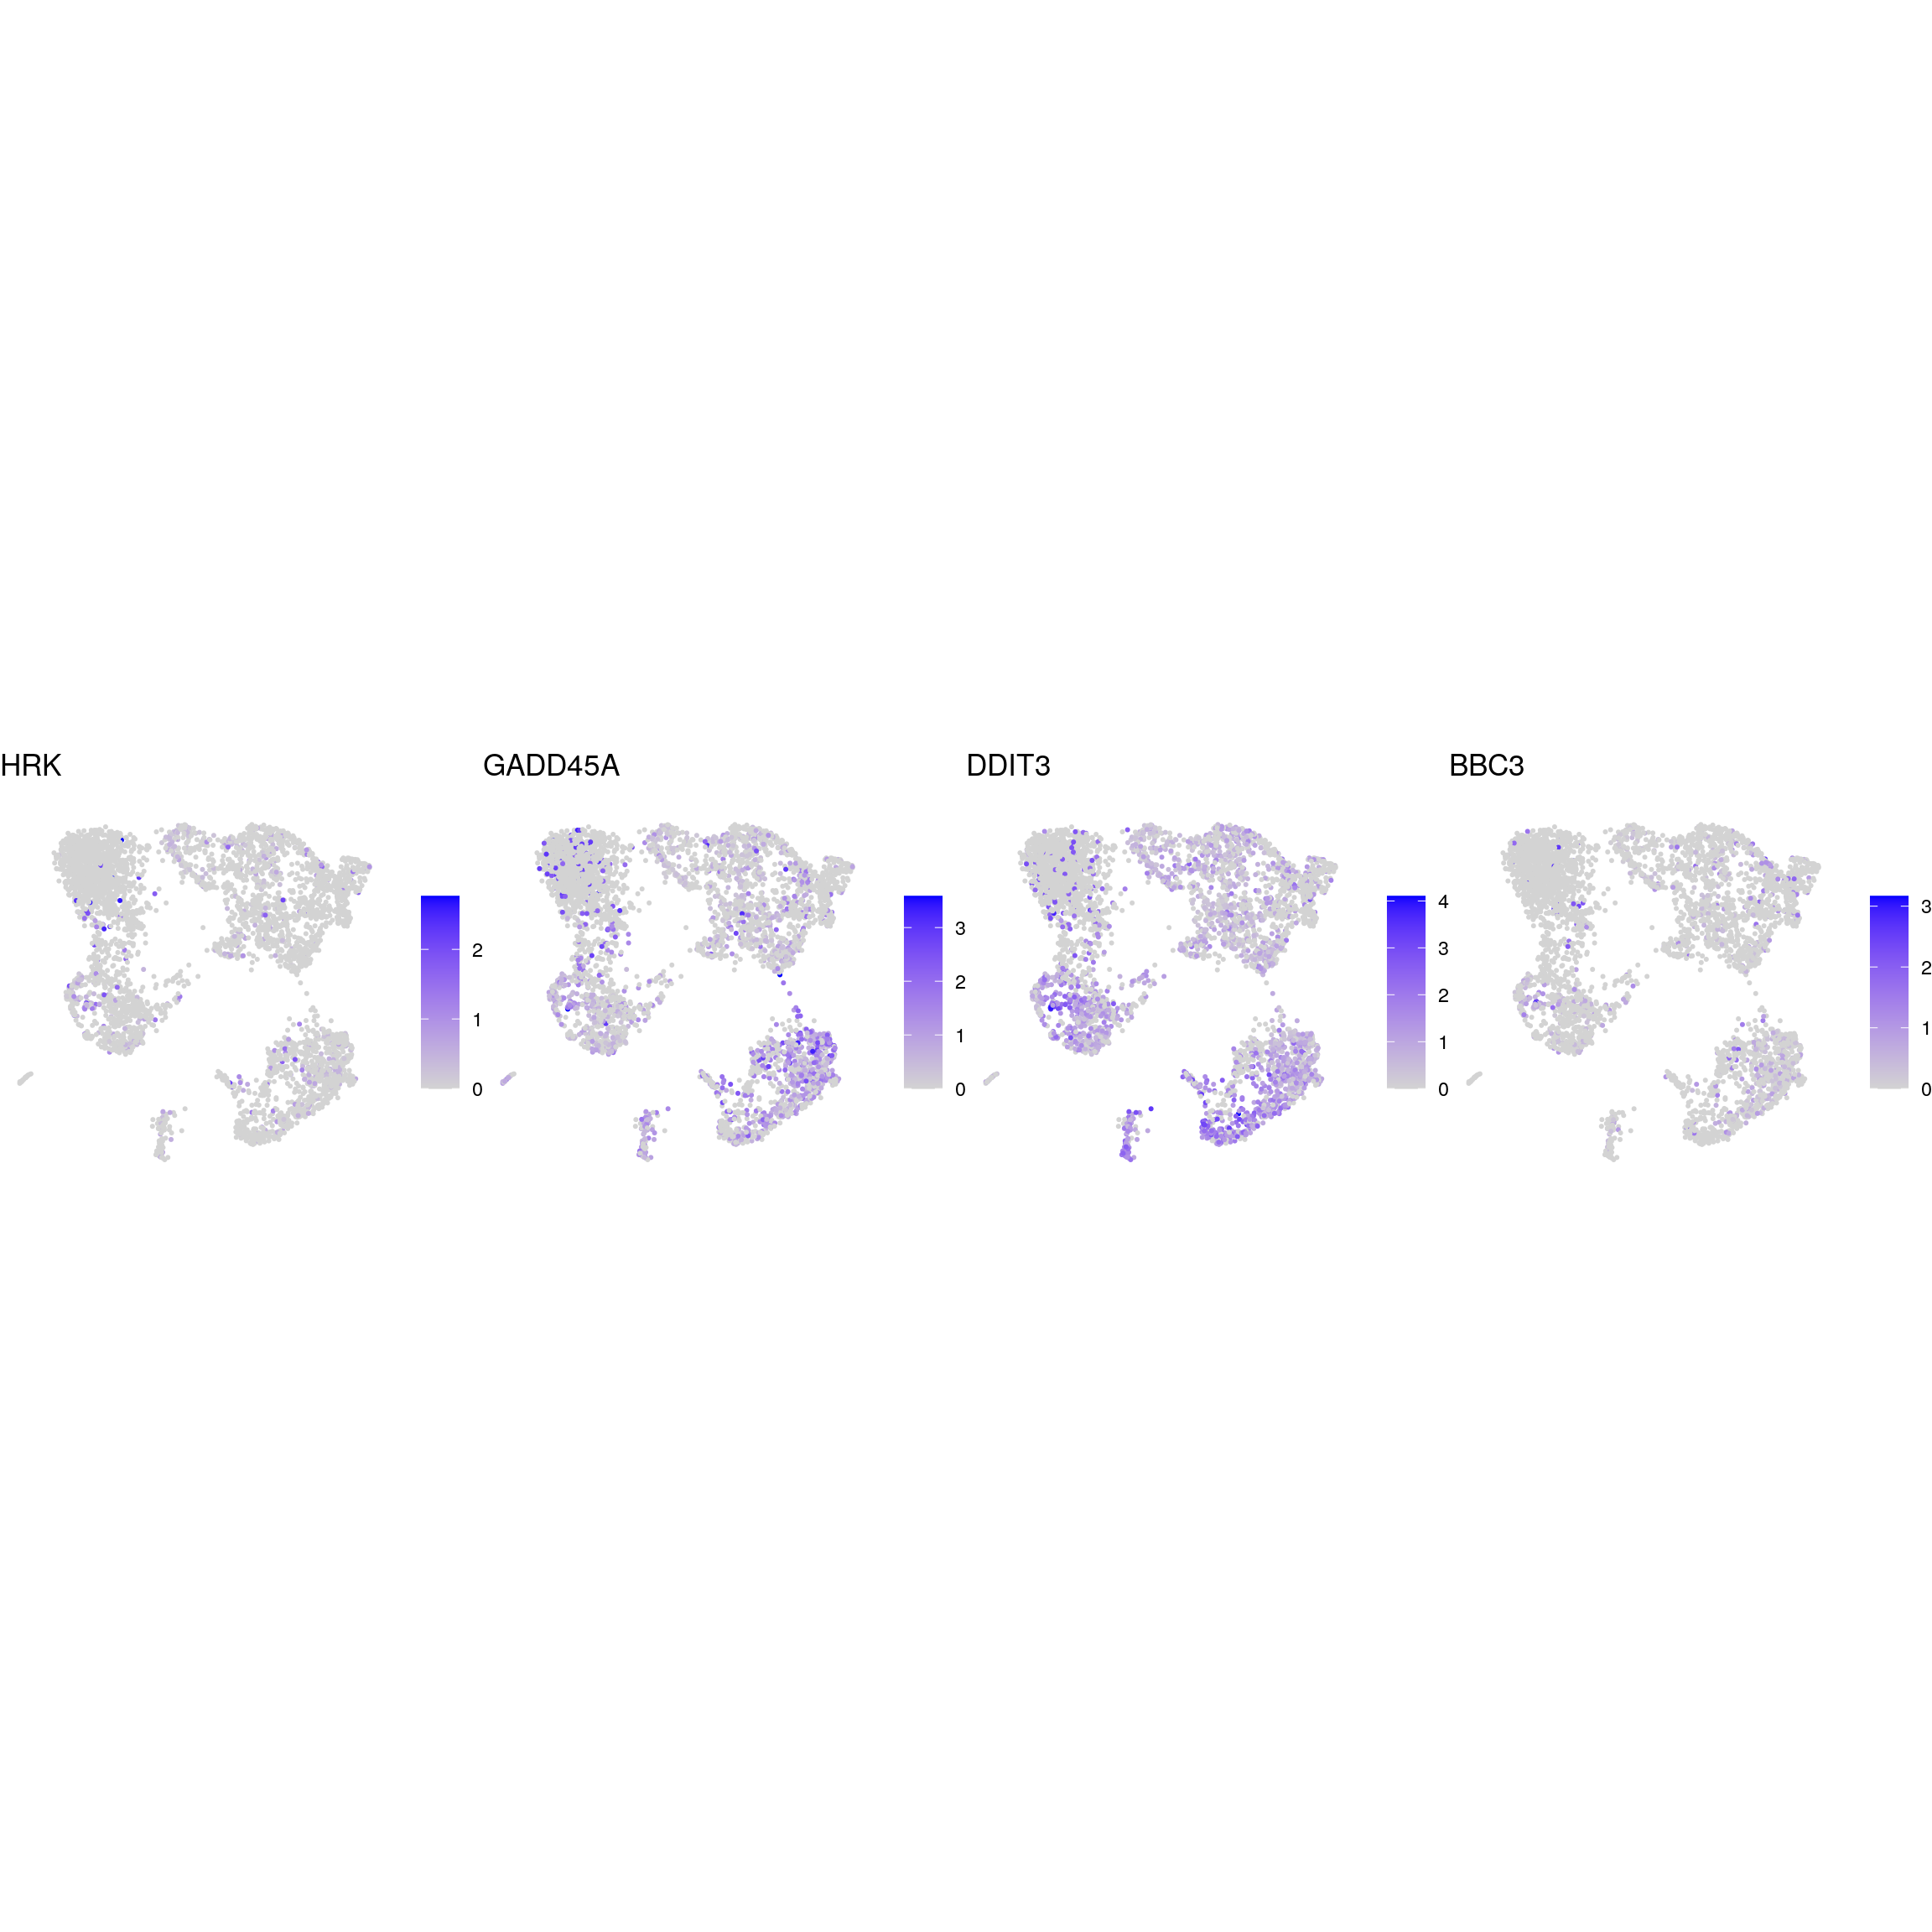
Expression of cluster 12 markers genes (changed in TDP-HA expressing cells)
fs <- list(up = c("NPTX2", "FGF18", "TDP43-HA", "PCED1A", "MEF2A", "DYNC2H1",
                   "APOE", "GADD45A", "BCAM", "DDIT3"),
           down = c("VGF", "SCG2", "GAP43", "C4orf48", "HINT1", "LY6H",
                     "TUBA1A", "TMSB4X", "TUBB2B", "STMN2"))
fs <- lapply(fs, sapply, function(g)
    grep(pattern = paste0("\\.", g, "$"), rownames(sce), value = TRUE)
  )
fs[["up"]]["TDP43-HA"] <- "TDP43-HA"
fs <- lapply(fs, function(x) unlist(x[lengths(x) !=0]) )

gs <- gsub(".*\\.", "", unlist(fs))
ns <- vapply(fs, length, numeric(1))
ks <- rep.int(names(fs), ns)
labs <- lapply(fs, function(x) gsub(".*\\.", "",x))
Heatmap of cluster 12 markers
# compute cluster-marker means
ms_by_cluster <- lapply(fs, function(gs) vapply(cs_by_k, function(i)
        Matrix::rowMeans(logcounts(sce)[gs, i, drop = FALSE]),
        numeric(length(gs))))
# prep. for plotting & scale b/w 0 and 1
mat <- do.call("rbind", ms_by_cluster)
mat <- muscat:::.scale(mat)
rownames(mat) <- gs
cols <- muscat:::.cluster_colors[seq_along(fs)]
cols <- setNames(cols, names(fs))
row_anno <- rowAnnotation(
    df = data.frame(label = factor(ks, levels = names(fs))),
    col = list(label = cols), gp = gpar(col = "white"))
# percentage of cells from each of the samples per cluster
sample_props <- prop.table(n_cells, margin = 1)
col_mat <- as.matrix(unclass(sample_props))
sample_cols <- c("#882255", "#11588A",  "#117733")
sample_cols <- setNames(sample_cols, colnames(col_mat))
col_anno <- HeatmapAnnotation(
    perc_sample = anno_barplot(col_mat, gp = gpar(fill = sample_cols),
                               height = unit(2, "cm"),
                               border = FALSE),
    annotation_label = "fraction of sample\nin cluster",
    gap = unit(10, "points"))
col_lgd <- Legend(labels = names(sample_cols),
       title = "sample",
       legend_gp = gpar(fill = sample_cols))

hm <- Heatmap(mat,
    name = "scaled avg.\nexpression",
    col = viridis(10),
    cluster_rows = FALSE,
    cluster_columns = FALSE,
    row_names_side = "left",
    column_title = "cluster_id",
    column_title_side = "bottom",
    column_names_side = "bottom",
    column_names_rot = 0,
    column_names_centered = TRUE,
    rect_gp = gpar(col = "white"),
    left_annotation = row_anno,
    top_annotation = col_anno)
draw(hm, annotation_legend_list = list(col_lgd))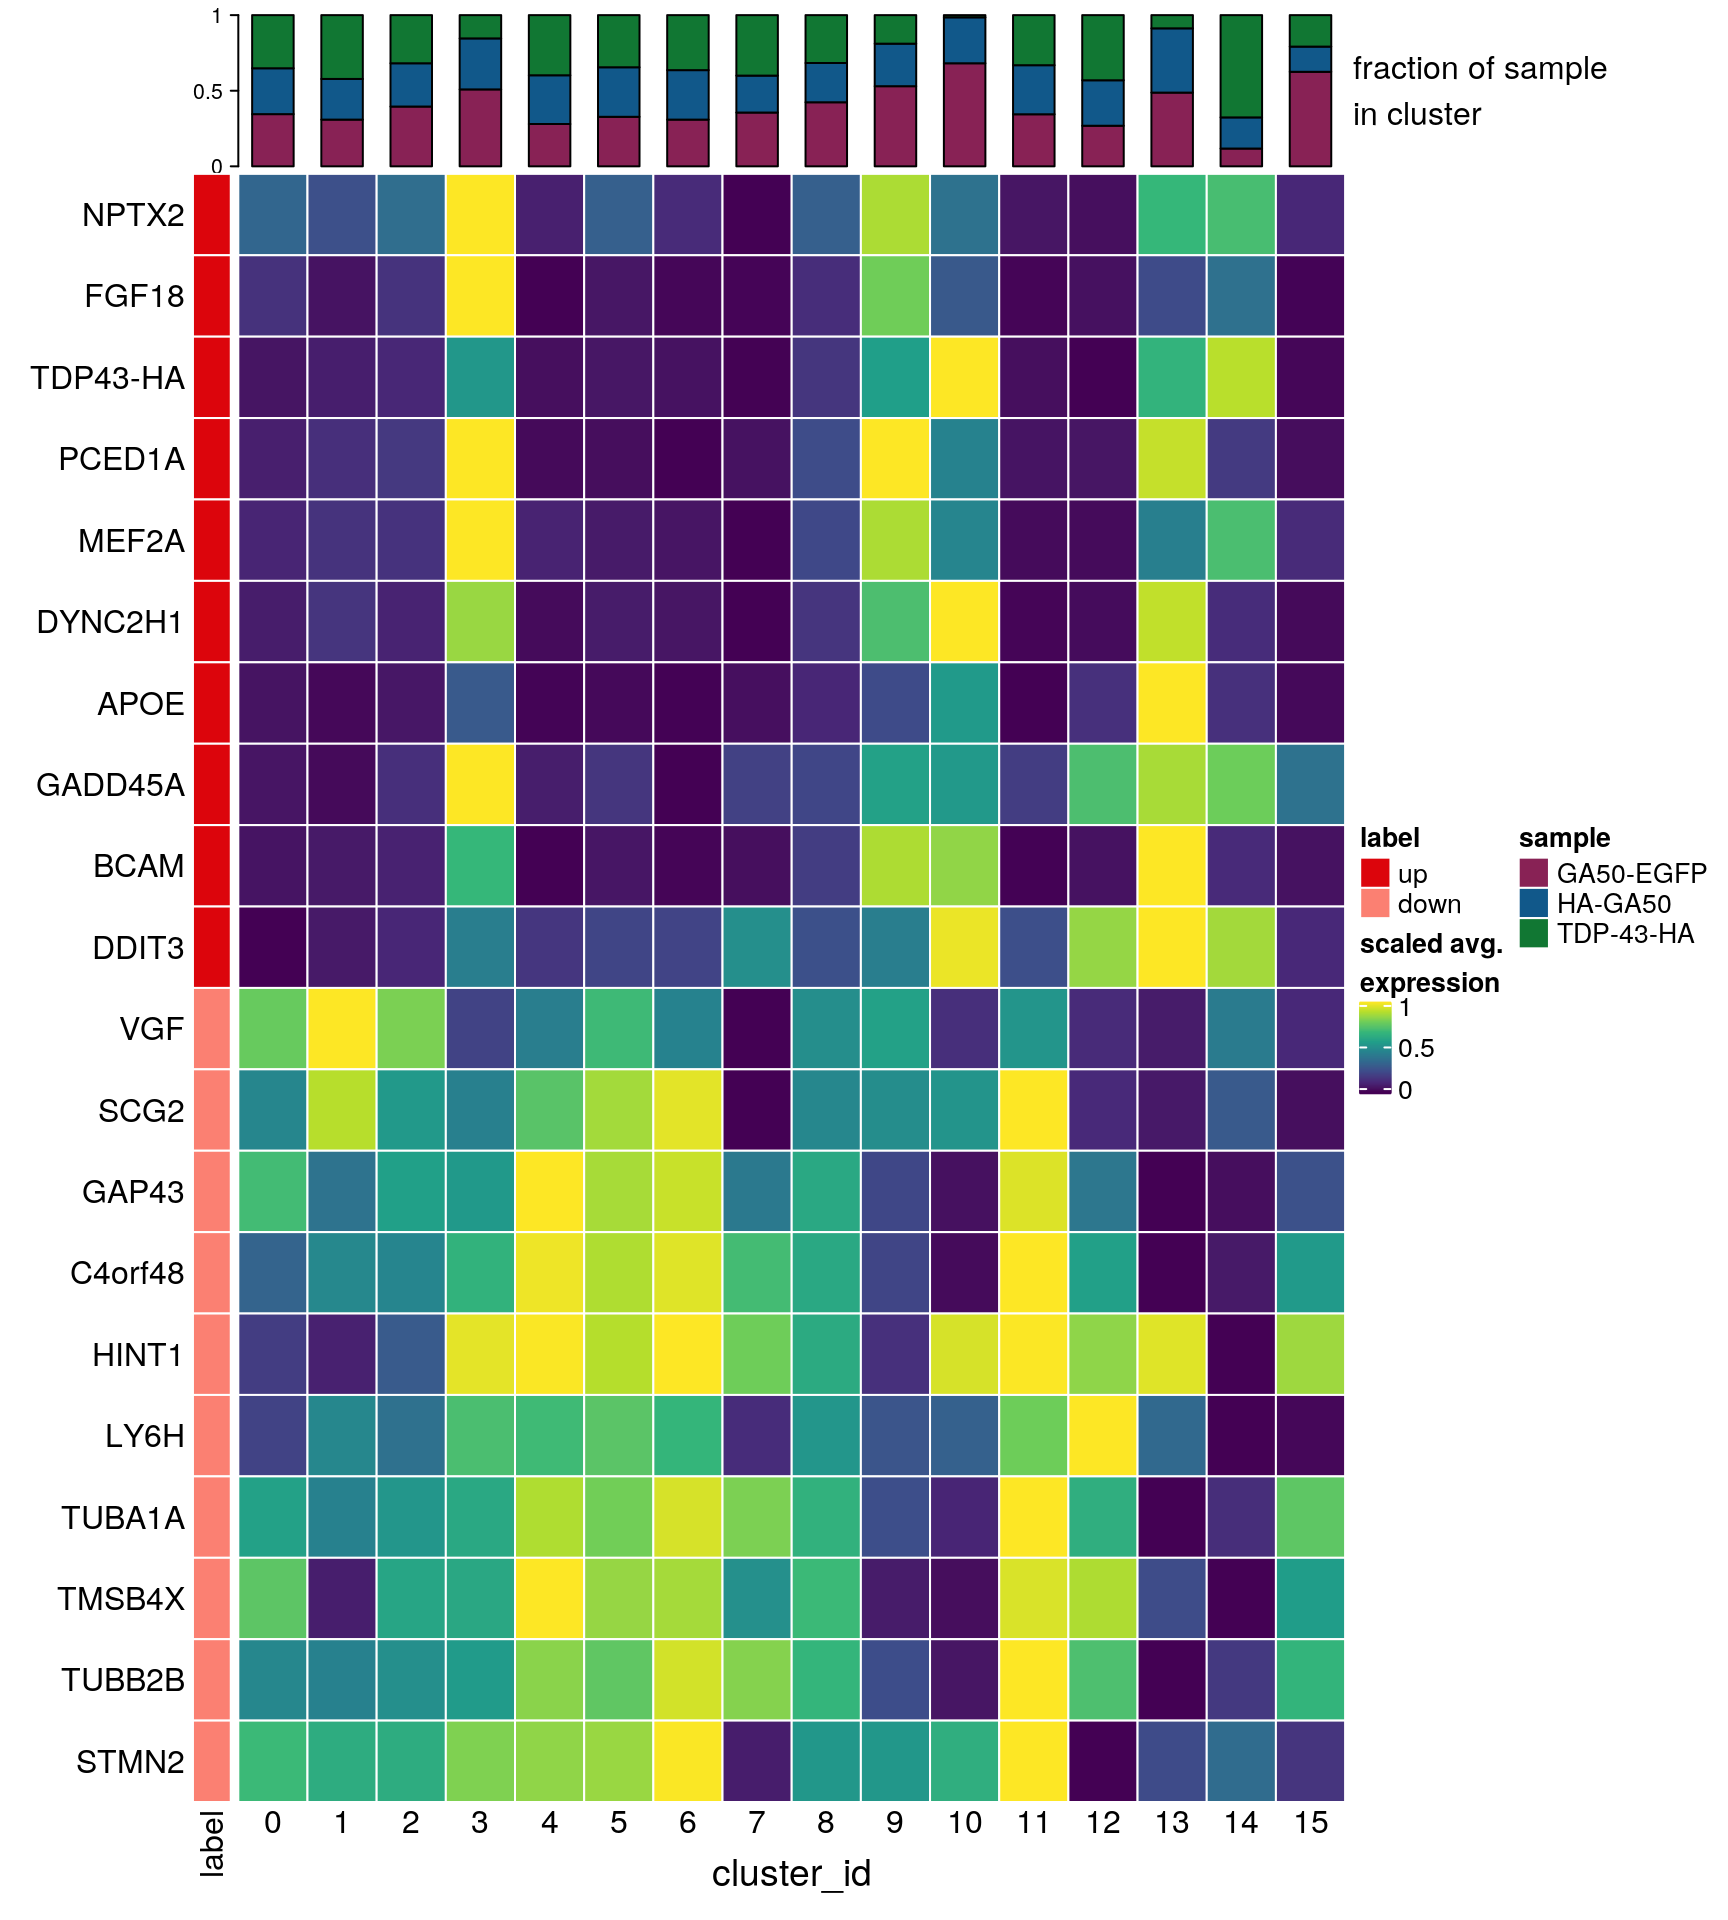
| Version | Author | Date |
|---|---|---|
| d55a2c2 | khembach | 2021-05-19 |
In neuronal clusters:
## subset to neuronal clusters
## astrocytes: 7-8, 12
## small cluster with weird cells: 15
## low quality cells: 0-1
subs <- as.character(c(2:6, 9:11, 13:14))
cs_by_k_sub <- cs_by_k[subs]
# compute cluster-marker means
ms_by_cluster <- lapply(fs, function(gs) vapply(cs_by_k_sub, function(i)
Matrix::rowMeans(logcounts(sce)[gs, i, drop = FALSE]),
numeric(length(gs))))
# prep. for plotting & scale b/w 0 and 1
mat <- do.call("rbind", ms_by_cluster)
mat <- muscat:::.scale(mat)
rownames(mat) <- gs
cols <- muscat:::.cluster_colors[seq_along(fs)]
cols <- setNames(cols, names(fs))
row_anno <- rowAnnotation(
df = data.frame(label = factor(ks, levels = names(fs))),
col = list(label = cols), gp = gpar(col = "white"))
# percentage of cells from each of the samples per cluster
sample_props <- prop.table(n_cells, margin = 1)
col_mat <- as.matrix(unclass(sample_props[subs,]))
sample_cols <- c("#882255", "#11588A", "#117733")
sample_cols <- setNames(sample_cols, colnames(col_mat))
col_anno <- HeatmapAnnotation(
perc_sample = anno_barplot(col_mat, gp = gpar(fill = sample_cols),
height = unit(2, "cm"),
border = FALSE),
annotation_label = "fraction of sample\nin cluster",
gap = unit(10, "points"))
col_lgd <- Legend(labels = names(sample_cols),
title = "sample",
legend_gp = gpar(fill = sample_cols))
hm <- Heatmap(mat,
name = "scaled avg.\nexpression",
col = viridis(10),
cluster_rows = FALSE,
cluster_columns = FALSE,
row_names_side = "left",
column_title = "cluster_id",
column_title_side = "bottom",
column_names_side = "bottom",
column_names_rot = 0,
column_names_centered = TRUE,
rect_gp = gpar(col = "white"),
left_annotation = row_anno,
top_annotation = col_anno)
draw(hm, annotation_legend_list = list(col_lgd))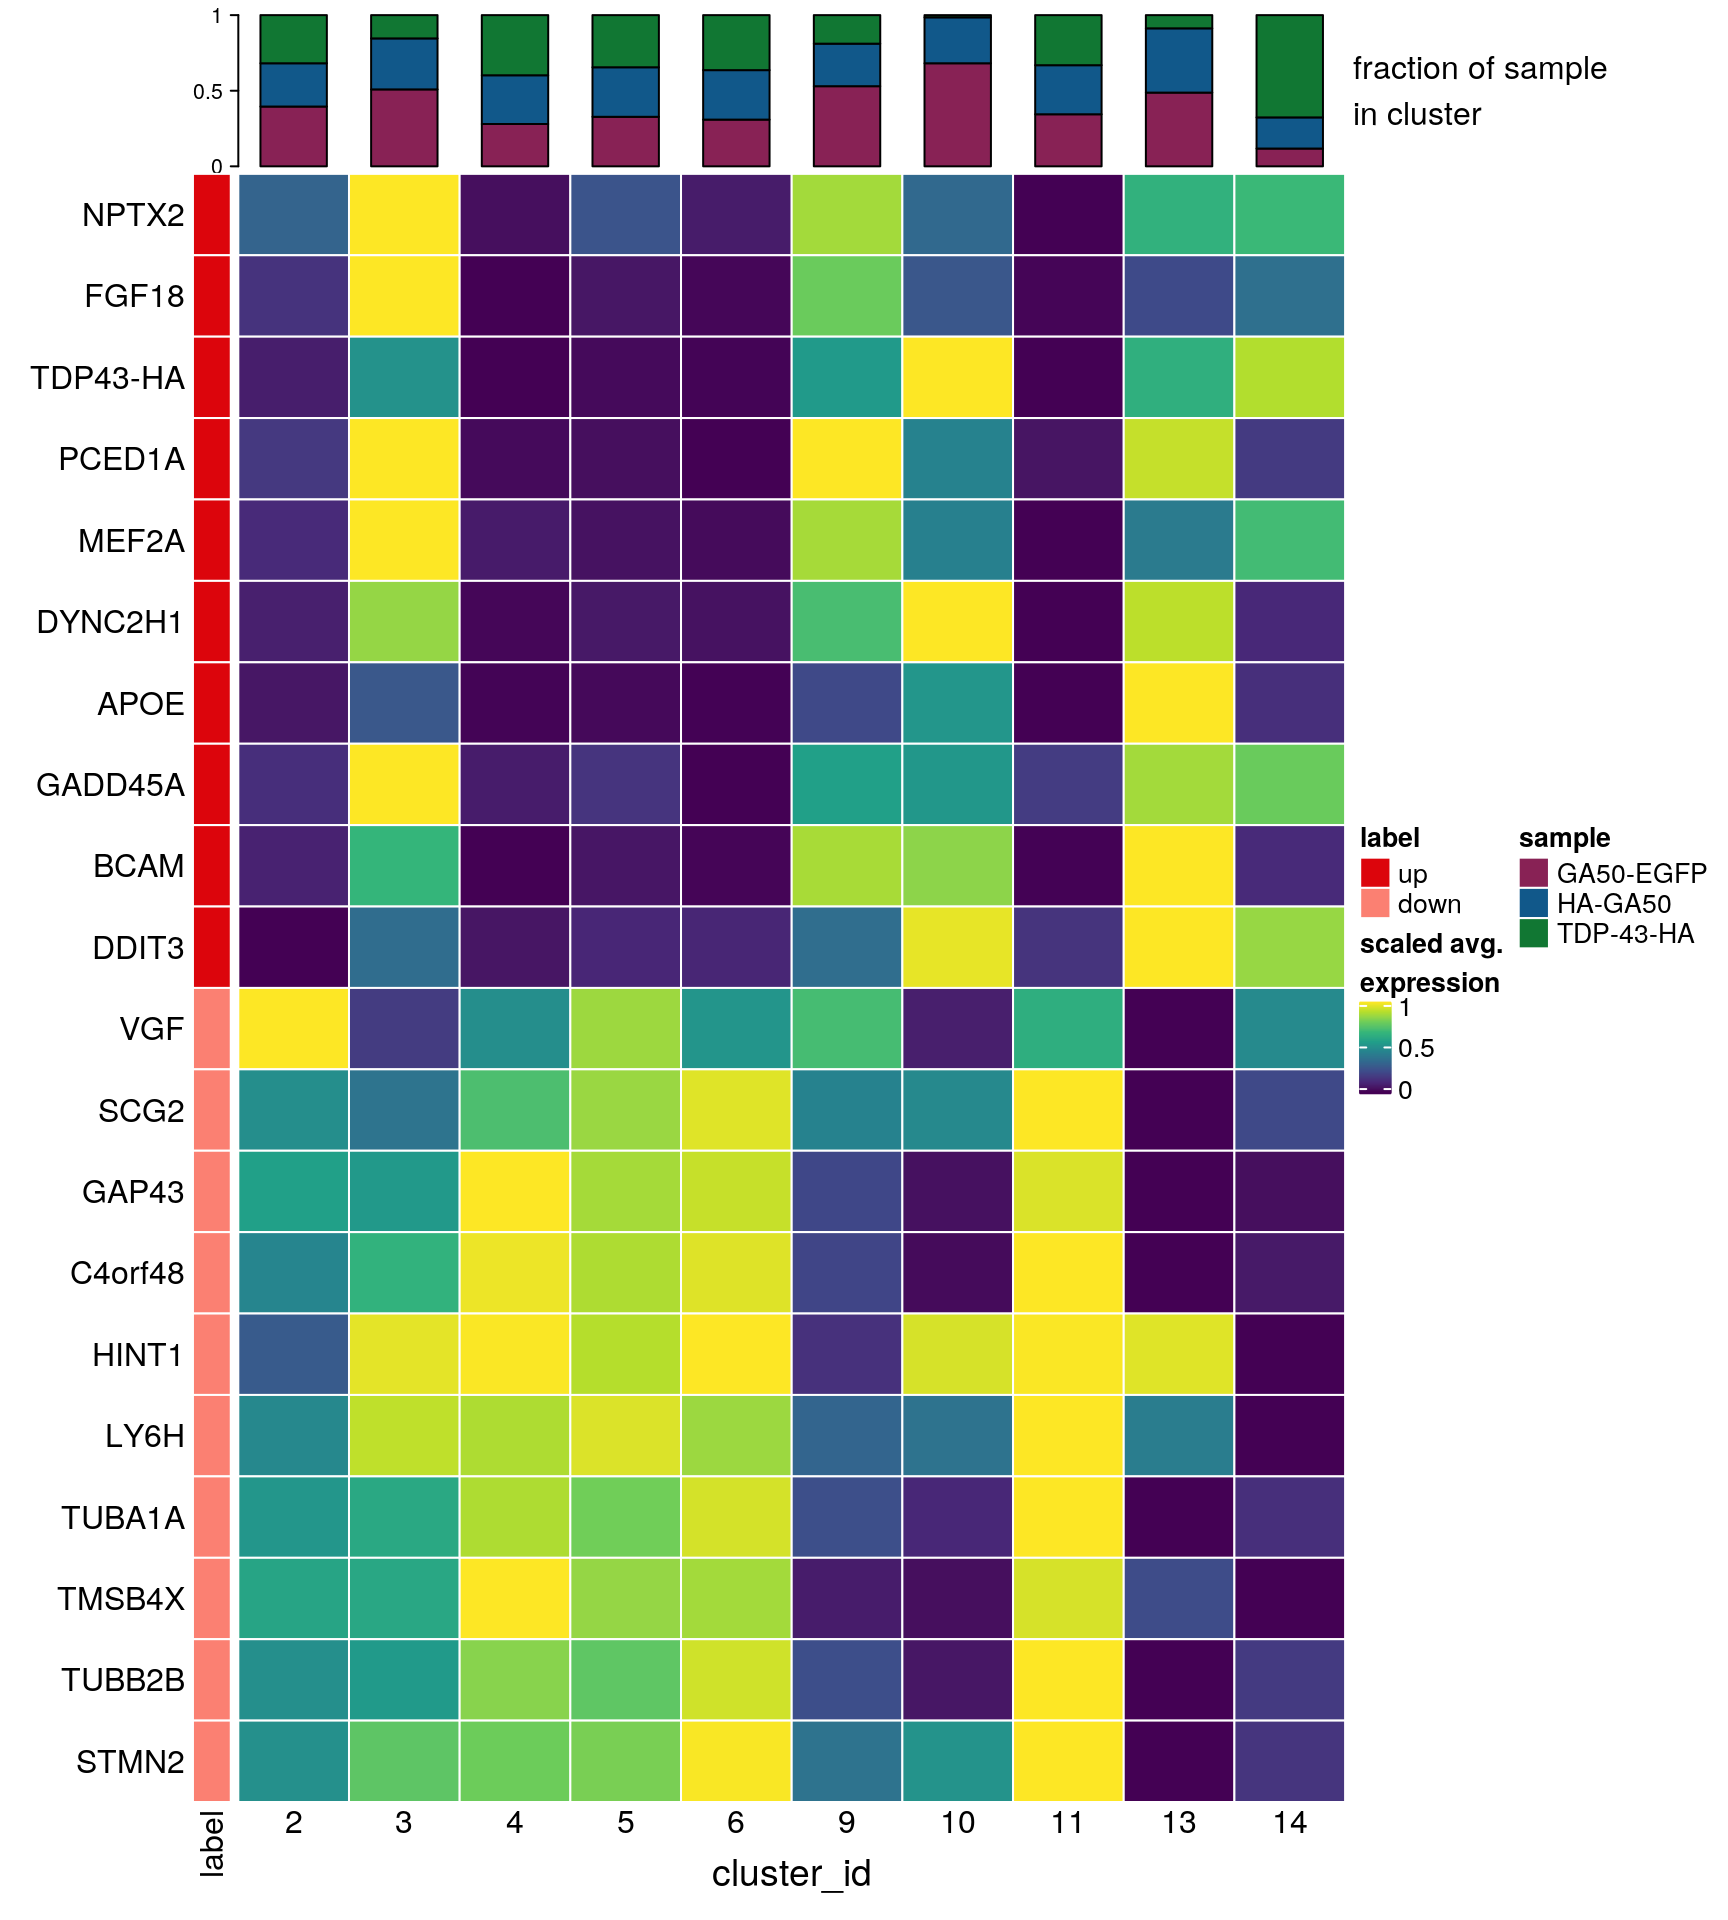
Save cluster markers to RDS
saveRDS(scran_markers, file.path("output", "CH-test-03_scran_markers.rds"))
saveRDS(so, file.path("output", "CH-test-03-cluster-analysis_so.rds"))
sessionInfo()R version 4.0.5 (2021-03-31)
Platform: x86_64-pc-linux-gnu (64-bit)
Running under: Ubuntu 18.04.5 LTS
Matrix products: default
BLAS: /usr/local/R/R-4.0.5/lib/libRblas.so
LAPACK: /usr/local/R/R-4.0.5/lib/libRlapack.so
locale:
[1] LC_CTYPE=en_US.UTF-8 LC_NUMERIC=C
[3] LC_TIME=en_US.UTF-8 LC_COLLATE=en_US.UTF-8
[5] LC_MONETARY=en_US.UTF-8 LC_MESSAGES=en_US.UTF-8
[7] LC_PAPER=en_US.UTF-8 LC_NAME=C
[9] LC_ADDRESS=C LC_TELEPHONE=C
[11] LC_MEASUREMENT=en_US.UTF-8 LC_IDENTIFICATION=C
attached base packages:
[1] parallel stats4 grid stats graphics grDevices utils
[8] datasets methods base
other attached packages:
[1] stringr_1.4.0 SeuratObject_4.0.1
[3] Seurat_4.0.1 scran_1.16.0
[5] SingleCellExperiment_1.10.1 SummarizedExperiment_1.18.1
[7] DelayedArray_0.14.0 matrixStats_0.56.0
[9] Biobase_2.48.0 GenomicRanges_1.40.0
[11] GenomeInfoDb_1.24.2 IRanges_2.22.2
[13] S4Vectors_0.26.1 BiocGenerics_0.34.0
[15] viridis_0.5.1 viridisLite_0.3.0
[17] RColorBrewer_1.1-2 purrr_0.3.4
[19] muscat_1.2.1 dplyr_1.0.2
[21] ggplot2_3.3.2 cowplot_1.0.0
[23] ComplexHeatmap_2.4.2 workflowr_1.6.2
loaded via a namespace (and not attached):
[1] reticulate_1.16 tidyselect_1.1.0
[3] lme4_1.1-23 RSQLite_2.2.0
[5] AnnotationDbi_1.50.1 htmlwidgets_1.5.1
[7] BiocParallel_1.22.0 Rtsne_0.15
[9] munsell_0.5.0 codetools_0.2-16
[11] ica_1.0-2 statmod_1.4.34
[13] future_1.17.0 miniUI_0.1.1.1
[15] withr_2.4.1 colorspace_1.4-1
[17] knitr_1.29 ROCR_1.0-11
[19] tensor_1.5 listenv_0.8.0
[21] labeling_0.3 git2r_0.27.1
[23] GenomeInfoDbData_1.2.3 polyclip_1.10-0
[25] farver_2.0.3 bit64_0.9-7
[27] glmmTMB_1.0.2.1 rprojroot_1.3-2
[29] vctrs_0.3.4 generics_0.0.2
[31] xfun_0.15 R6_2.4.1
[33] doParallel_1.0.15 ggbeeswarm_0.6.0
[35] clue_0.3-57 rsvd_1.0.3
[37] locfit_1.5-9.4 spatstat.utils_2.1-0
[39] bitops_1.0-6 cachem_1.0.4
[41] promises_1.1.1 scales_1.1.1
[43] beeswarm_0.2.3 gtable_0.3.0
[45] globals_0.12.5 goftest_1.2-2
[47] rlang_0.4.10 genefilter_1.70.0
[49] GlobalOptions_0.1.2 splines_4.0.5
[51] TMB_1.7.16 lazyeval_0.2.2
[53] spatstat.geom_2.1-0 abind_1.4-5
[55] yaml_2.2.1 reshape2_1.4.4
[57] backports_1.1.9 httpuv_1.5.4
[59] tools_4.0.5 spatstat.core_2.1-2
[61] ellipsis_0.3.1 gplots_3.0.4
[63] ggridges_0.5.2 Rcpp_1.0.5
[65] plyr_1.8.6 progress_1.2.2
[67] zlibbioc_1.34.0 RCurl_1.98-1.3
[69] prettyunits_1.1.1 rpart_4.1-15
[71] deldir_0.2-10 pbapply_1.4-2
[73] GetoptLong_1.0.1 zoo_1.8-8
[75] ggrepel_0.8.2 cluster_2.1.0
[77] colorRamps_2.3 fs_1.5.0
[79] variancePartition_1.18.2 magrittr_1.5
[81] data.table_1.12.8 scattermore_0.7
[83] lmerTest_3.1-2 circlize_0.4.10
[85] lmtest_0.9-37 RANN_2.6.1
[87] whisker_0.4 fitdistrplus_1.1-1
[89] hms_0.5.3 patchwork_1.0.1
[91] mime_0.9 evaluate_0.14
[93] xtable_1.8-4 pbkrtest_0.4-8.6
[95] XML_3.99-0.4 gridExtra_2.3
[97] shape_1.4.4 compiler_4.0.5
[99] scater_1.16.2 tibble_3.0.3
[101] KernSmooth_2.23-17 crayon_1.3.4
[103] minqa_1.2.4 htmltools_0.5.0
[105] mgcv_1.8-31 later_1.1.0.1
[107] tidyr_1.1.0 geneplotter_1.66.0
[109] DBI_1.1.0 MASS_7.3-51.6
[111] rappdirs_0.3.1 boot_1.3-25
[113] Matrix_1.3-3 gdata_2.18.0
[115] igraph_1.2.5 pkgconfig_2.0.3
[117] numDeriv_2016.8-1.1 spatstat.sparse_2.0-0
[119] plotly_4.9.2.1 foreach_1.5.0
[121] annotate_1.66.0 vipor_0.4.5
[123] dqrng_0.2.1 blme_1.0-4
[125] XVector_0.28.0 digest_0.6.25
[127] sctransform_0.3.2 RcppAnnoy_0.0.18
[129] spatstat.data_2.1-0 rmarkdown_2.3
[131] leiden_0.3.3 uwot_0.1.10
[133] edgeR_3.30.3 DelayedMatrixStats_1.10.1
[135] shiny_1.5.0 gtools_3.8.2
[137] rjson_0.2.20 nloptr_1.2.2.2
[139] lifecycle_1.0.0 nlme_3.1-148
[141] jsonlite_1.7.2 BiocNeighbors_1.6.0
[143] limma_3.44.3 pillar_1.4.6
[145] lattice_0.20-41 fastmap_1.0.1
[147] httr_1.4.2 survival_3.2-3
[149] glue_1.4.2 png_0.1-7
[151] iterators_1.0.12 bit_1.1-15.2
[153] stringi_1.4.6 blob_1.2.1
[155] DESeq2_1.28.1 BiocSingular_1.4.0
[157] caTools_1.18.0 memoise_2.0.0
[159] irlba_2.3.3 future.apply_1.6.0