Filtering
Katharina Hembach
April 06, 2021
Last updated: 2021-04-06
Checks: 7 0
Knit directory: neural_scRNAseq/
This reproducible R Markdown analysis was created with workflowr (version 1.6.2). The Checks tab describes the reproducibility checks that were applied when the results were created. The Past versions tab lists the development history.
Great! Since the R Markdown file has been committed to the Git repository, you know the exact version of the code that produced these results.
Great job! The global environment was empty. Objects defined in the global environment can affect the analysis in your R Markdown file in unknown ways. For reproduciblity it's best to always run the code in an empty environment.
The command set.seed(20200522) was run prior to running the code in the R Markdown file. Setting a seed ensures that any results that rely on randomness, e.g. subsampling or permutations, are reproducible.
Great job! Recording the operating system, R version, and package versions is critical for reproducibility.
Nice! There were no cached chunks for this analysis, so you can be confident that you successfully produced the results during this run.
Great job! Using relative paths to the files within your workflowr project makes it easier to run your code on other machines.
Great! You are using Git for version control. Tracking code development and connecting the code version to the results is critical for reproducibility.
The results in this page were generated with repository version 1d0e2aa. See the Past versions tab to see a history of the changes made to the R Markdown and HTML files.
Note that you need to be careful to ensure that all relevant files for the analysis have been committed to Git prior to generating the results (you can use wflow_publish or wflow_git_commit). workflowr only checks the R Markdown file, but you know if there are other scripts or data files that it depends on. Below is the status of the Git repository when the results were generated:
Ignored files:
    Ignored:    .DS_Store
    Ignored:    .Rhistory
    Ignored:    .Rproj.user/
    Ignored:    ._.DS_Store
    Ignored:    ._Filtered.pdf
    Ignored:    ._Rplots.pdf
    Ignored:    ._Unfiltered.pdf
    Ignored:    .__workflowr.yml
    Ignored:    ._coverage.pdf
    Ignored:    ._coverage_sashimi.pdf
    Ignored:    ._coverage_sashimi.png
    Ignored:    ._neural_scRNAseq.Rproj
    Ignored:    ._pbDS_cell_level.pdf
    Ignored:    ._pbDS_top_expr_umap.pdf
    Ignored:    ._pbDS_upset.pdf
    Ignored:    ._sashimi.pdf
    Ignored:    ._stmn2.pdf
    Ignored:    ._tdp.pdf
    Ignored:    analysis/.DS_Store
    Ignored:    analysis/.Rhistory
    Ignored:    analysis/._.DS_Store
    Ignored:    analysis/._01-preprocessing.Rmd
    Ignored:    analysis/._01-preprocessing.html
    Ignored:    analysis/._02.1-SampleQC.Rmd
    Ignored:    analysis/._03-filtering.Rmd
    Ignored:    analysis/._04-clustering.Rmd
    Ignored:    analysis/._04-clustering.knit.md
    Ignored:    analysis/._04.1-cell_cycle.Rmd
    Ignored:    analysis/._05-annotation.Rmd
    Ignored:    analysis/._Lam-0-NSC_no_integration.Rmd
    Ignored:    analysis/._Lam-01-NSC_integration.Rmd
    Ignored:    analysis/._Lam-02-NSC_annotation.Rmd
    Ignored:    analysis/._NSC-1-clustering.Rmd
    Ignored:    analysis/._NSC-2-annotation.Rmd
    Ignored:    analysis/.__site.yml
    Ignored:    analysis/._additional_filtering.Rmd
    Ignored:    analysis/._additional_filtering_clustering.Rmd
    Ignored:    analysis/._index.Rmd
    Ignored:    analysis/._organoid-01-1-qualtiy-control.Rmd
    Ignored:    analysis/._organoid-01-clustering.Rmd
    Ignored:    analysis/._organoid-02-integration.Rmd
    Ignored:    analysis/._organoid-03-cluster_analysis.Rmd
    Ignored:    analysis/._organoid-04-group_integration.Rmd
    Ignored:    analysis/._organoid-04-stage_integration.Rmd
    Ignored:    analysis/._organoid-05-group_integration_cluster_analysis.Rmd
    Ignored:    analysis/._organoid-05-stage_integration_cluster_analysis.Rmd
    Ignored:    analysis/._organoid-06-1-prepare-sce.Rmd
    Ignored:    analysis/._organoid-06-conos-analysis-Seurat.Rmd
    Ignored:    analysis/._organoid-06-conos-analysis-function.Rmd
    Ignored:    analysis/._organoid-06-conos-analysis.Rmd
    Ignored:    analysis/._organoid-06-group-integration-conos-analysis.Rmd
    Ignored:    analysis/._organoid-07-conos-visualization.Rmd
    Ignored:    analysis/._organoid-07-group-integration-conos-visualization.Rmd
    Ignored:    analysis/._organoid-08-conos-comparison.Rmd
    Ignored:    analysis/._organoid-0x-sample_integration.Rmd
    Ignored:    analysis/01-preprocessing_cache/
    Ignored:    analysis/02-1-SampleQC_cache/
    Ignored:    analysis/02-quality_control_cache/
    Ignored:    analysis/02.1-SampleQC_cache/
    Ignored:    analysis/04-clustering_cache/
    Ignored:    analysis/04.1-cell_cycle_cache/
    Ignored:    analysis/05-annotation_cache/
    Ignored:    analysis/06-clustering-all-timepoints_cache/
    Ignored:    analysis/07-cluster-analysis-all-timepoints_cache/
    Ignored:    analysis/Lam-01-NSC_integration_cache/
    Ignored:    analysis/Lam-02-NSC_annotation_cache/
    Ignored:    analysis/NSC-1-clustering_cache/
    Ignored:    analysis/NSC-2-annotation_cache/
    Ignored:    analysis/TDP-01-preprocessing_cache/
    Ignored:    analysis/TDP-02-quality_control_cache/
    Ignored:    analysis/TDP-03-filtering_cache/
    Ignored:    analysis/TDP-04-clustering_cache/
    Ignored:    analysis/TDP-05-00-filtering-plasmid-QC_cache/
    Ignored:    analysis/TDP-05-plasmid_expression_cache/
    Ignored:    analysis/TDP-06-cluster_analysis_cache/
    Ignored:    analysis/TDP-07-01-STMN2_expression_cache/
    Ignored:    analysis/TDP-07-cluster_12_cache/
    Ignored:    analysis/TDP-08-00-clustering-HA-D96_cache/
    Ignored:    analysis/TDP-08-01-HA-D96-expression-changes_cache/
    Ignored:    analysis/TDP-08-02-TDP_target_genes_cache/
    Ignored:    analysis/TDP-08-clustering-timeline-HA_cache/
    Ignored:    analysis/additional_filtering_cache/
    Ignored:    analysis/additional_filtering_clustering_cache/
    Ignored:    analysis/organoid-01-1-qualtiy-control_cache/
    Ignored:    analysis/organoid-01-clustering_cache/
    Ignored:    analysis/organoid-02-integration_cache/
    Ignored:    analysis/organoid-03-cluster_analysis_cache/
    Ignored:    analysis/organoid-04-group_integration_cache/
    Ignored:    analysis/organoid-04-stage_integration_cache/
    Ignored:    analysis/organoid-05-group_integration_cluster_analysis_cache/
    Ignored:    analysis/organoid-05-stage_integration_cluster_analysis_cache/
    Ignored:    analysis/organoid-06-conos-analysis_cache/
    Ignored:    analysis/organoid-06-conos-analysis_test_cache/
    Ignored:    analysis/organoid-06-group-integration-conos-analysis_cache/
    Ignored:    analysis/organoid-07-conos-visualization_cache/
    Ignored:    analysis/organoid-07-group-integration-conos-visualization_cache/
    Ignored:    analysis/organoid-08-conos-comparison_cache/
    Ignored:    analysis/organoid-0x-sample_integration_cache/
    Ignored:    analysis/sample5_QC_cache/
    Ignored:    analysis/timepoints-01-organoid-integration_cache/
    Ignored:    data/.DS_Store
    Ignored:    data/._.DS_Store
    Ignored:    data/._.smbdeleteAAA17ed8b4b
    Ignored:    data/._Lam_figure2_markers.R
    Ignored:    data/._Reactive_astrocytes_markers.xlsx
    Ignored:    data/._known_NSC_markers.R
    Ignored:    data/._known_cell_type_markers.R
    Ignored:    data/._metadata.csv
    Ignored:    data/._virus_cell_tropism_markers.R
    Ignored:    data/._~$Reactive_astrocytes_markers.xlsx
    Ignored:    data/data_sushi/
    Ignored:    data/filtered_feature_matrices/
    Ignored:    output/.DS_Store
    Ignored:    output/._.DS_Store
    Ignored:    output/._NSC_cluster2_marker_genes.txt
    Ignored:    output/._TDP-06-no_integration_cluster12_marker_genes.txt
    Ignored:    output/._TDP-06-no_integration_cluster13_marker_genes.txt
    Ignored:    output/._organoid_integration_cluster1_marker_genes.txt
    Ignored:    output/._tbl_TDP-08-01-muscat_cluster_0.txt
    Ignored:    output/._tbl_TDP-08-01-muscat_cluster_1.txt
    Ignored:    output/._tbl_TDP-08-01-muscat_cluster_10.txt
    Ignored:    output/._tbl_TDP-08-01-muscat_cluster_11.txt
    Ignored:    output/._tbl_TDP-08-01-muscat_cluster_12.txt
    Ignored:    output/._tbl_TDP-08-01-muscat_cluster_13.txt
    Ignored:    output/._tbl_TDP-08-01-muscat_cluster_14.txt
    Ignored:    output/._tbl_TDP-08-01-muscat_cluster_5.txt
    Ignored:    output/._tbl_TDP-08-01-muscat_cluster_7.txt
    Ignored:    output/._tbl_TDP-08-01-muscat_cluster_8.txt
    Ignored:    output/._tbl_TDP-08-01-muscat_cluster_all.xlsx
    Ignored:    output/._tbl_TDP-08-02-targets_hek_cluster_0.txt
    Ignored:    output/._tbl_TDP-08-02-targets_hek_cluster_1.txt
    Ignored:    output/._tbl_TDP-08-02-targets_hek_cluster_10.txt
    Ignored:    output/._tbl_TDP-08-02-targets_hek_cluster_11.txt
    Ignored:    output/._tbl_TDP-08-02-targets_hek_cluster_12.txt
    Ignored:    output/._tbl_TDP-08-02-targets_hek_cluster_13.txt
    Ignored:    output/._tbl_TDP-08-02-targets_hek_cluster_14.txt
    Ignored:    output/._tbl_TDP-08-02-targets_hek_cluster_5.txt
    Ignored:    output/._tbl_TDP-08-02-targets_hek_cluster_7.txt
    Ignored:    output/._tbl_TDP-08-02-targets_hek_cluster_8.txt
    Ignored:    output/._tbl_TDP-08-02-targets_hek_cluster_all.xlsx
    Ignored:    output/._~$tbl_TDP-08-02-targets_hek_cluster_all.xlsx
    Ignored:    output/Lam-01-clustering.rds
    Ignored:    output/NSC_1_clustering.rds
    Ignored:    output/NSC_cluster1_marker_genes.txt
    Ignored:    output/NSC_cluster2_marker_genes.txt
    Ignored:    output/NSC_cluster3_marker_genes.txt
    Ignored:    output/NSC_cluster4_marker_genes.txt
    Ignored:    output/NSC_cluster5_marker_genes.txt
    Ignored:    output/NSC_cluster6_marker_genes.txt
    Ignored:    output/NSC_cluster7_marker_genes.txt
    Ignored:    output/TDP-06-no_integration_cluster0_marker_genes.txt
    Ignored:    output/TDP-06-no_integration_cluster10_marker_genes.txt
    Ignored:    output/TDP-06-no_integration_cluster11_marker_genes.txt
    Ignored:    output/TDP-06-no_integration_cluster12_marker_genes.txt
    Ignored:    output/TDP-06-no_integration_cluster13_marker_genes.txt
    Ignored:    output/TDP-06-no_integration_cluster14_marker_genes.txt
    Ignored:    output/TDP-06-no_integration_cluster15_marker_genes.txt
    Ignored:    output/TDP-06-no_integration_cluster16_marker_genes.txt
    Ignored:    output/TDP-06-no_integration_cluster17_marker_genes.txt
    Ignored:    output/TDP-06-no_integration_cluster1_marker_genes.txt
    Ignored:    output/TDP-06-no_integration_cluster2_marker_genes.txt
    Ignored:    output/TDP-06-no_integration_cluster3_marker_genes.txt
    Ignored:    output/TDP-06-no_integration_cluster4_marker_genes.txt
    Ignored:    output/TDP-06-no_integration_cluster5_marker_genes.txt
    Ignored:    output/TDP-06-no_integration_cluster6_marker_genes.txt
    Ignored:    output/TDP-06-no_integration_cluster7_marker_genes.txt
    Ignored:    output/TDP-06-no_integration_cluster8_marker_genes.txt
    Ignored:    output/TDP-06-no_integration_cluster9_marker_genes.txt
    Ignored:    output/TDP-06_scran_markers.rds
    Ignored:    output/additional_filtering.rds
    Ignored:    output/conos/
    Ignored:    output/conos_organoid-06-conos-analysis.rds
    Ignored:    output/conos_organoid-06-group-integration-conos-analysis.rds
    Ignored:    output/figures/
    Ignored:    output/organoid_integration_cluster10_marker_genes.txt
    Ignored:    output/organoid_integration_cluster11_marker_genes.txt
    Ignored:    output/organoid_integration_cluster12_marker_genes.txt
    Ignored:    output/organoid_integration_cluster13_marker_genes.txt
    Ignored:    output/organoid_integration_cluster14_marker_genes.txt
    Ignored:    output/organoid_integration_cluster15_marker_genes.txt
    Ignored:    output/organoid_integration_cluster16_marker_genes.txt
    Ignored:    output/organoid_integration_cluster17_marker_genes.txt
    Ignored:    output/organoid_integration_cluster1_marker_genes.txt
    Ignored:    output/organoid_integration_cluster2_marker_genes.txt
    Ignored:    output/organoid_integration_cluster3_marker_genes.txt
    Ignored:    output/organoid_integration_cluster4_marker_genes.txt
    Ignored:    output/organoid_integration_cluster5_marker_genes.txt
    Ignored:    output/organoid_integration_cluster6_marker_genes.txt
    Ignored:    output/organoid_integration_cluster7_marker_genes.txt
    Ignored:    output/organoid_integration_cluster8_marker_genes.txt
    Ignored:    output/organoid_integration_cluster9_marker_genes.txt
    Ignored:    output/res_TDP-08-01-muscat.rds
    Ignored:    output/sce_01_preprocessing.rds
    Ignored:    output/sce_02_quality_control.rds
    Ignored:    output/sce_03_filtering.rds
    Ignored:    output/sce_03_filtering_all_genes.rds
    Ignored:    output/sce_06-1-prepare-sce.rds
    Ignored:    output/sce_TDP-08-01-muscat.rds
    Ignored:    output/sce_TDP_01_preprocessing.rds
    Ignored:    output/sce_TDP_02_quality_control.rds
    Ignored:    output/sce_TDP_03_filtering.rds
    Ignored:    output/sce_TDP_03_filtering_all_genes.rds
    Ignored:    output/sce_organoid-01-clustering.rds
    Ignored:    output/sce_preprocessing.rds
    Ignored:    output/so_04-group_integration.rds
    Ignored:    output/so_04-stage_integration.rds
    Ignored:    output/so_04_1_cell_cycle.rds
    Ignored:    output/so_04_clustering.rds
    Ignored:    output/so_06-clustering_all_timepoints.rds
    Ignored:    output/so_08-00_clustering_HA_D96.rds
    Ignored:    output/so_08-clustering_timeline_HA.rds
    Ignored:    output/so_0x-sample_integration.rds
    Ignored:    output/so_TDP-06-cluster-analysis.rds
    Ignored:    output/so_TDP_04_clustering.rds
    Ignored:    output/so_TDP_05_plasmid_expression.rds
    Ignored:    output/so_additional_filtering_clustering.rds
    Ignored:    output/so_integrated_organoid-02-integration.rds
    Ignored:    output/so_merged_organoid-02-integration.rds
    Ignored:    output/so_organoid-01-clustering.rds
    Ignored:    output/so_sample_organoid-01-clustering.rds
    Ignored:    output/tbl_TDP-08-01-muscat.rds
    Ignored:    output/tbl_TDP-08-01-muscat_cluster_0.txt
    Ignored:    output/tbl_TDP-08-01-muscat_cluster_1.txt
    Ignored:    output/tbl_TDP-08-01-muscat_cluster_10.txt
    Ignored:    output/tbl_TDP-08-01-muscat_cluster_11.txt
    Ignored:    output/tbl_TDP-08-01-muscat_cluster_12.txt
    Ignored:    output/tbl_TDP-08-01-muscat_cluster_13.txt
    Ignored:    output/tbl_TDP-08-01-muscat_cluster_14.txt
    Ignored:    output/tbl_TDP-08-01-muscat_cluster_5.txt
    Ignored:    output/tbl_TDP-08-01-muscat_cluster_7.txt
    Ignored:    output/tbl_TDP-08-01-muscat_cluster_8.txt
    Ignored:    output/tbl_TDP-08-01-muscat_cluster_all.xlsx
    Ignored:    output/tbl_TDP-08-02-targets_hek.rds
    Ignored:    output/tbl_TDP-08-02-targets_hek_cluster_0.txt
    Ignored:    output/tbl_TDP-08-02-targets_hek_cluster_1.txt
    Ignored:    output/tbl_TDP-08-02-targets_hek_cluster_10.txt
    Ignored:    output/tbl_TDP-08-02-targets_hek_cluster_11.txt
    Ignored:    output/tbl_TDP-08-02-targets_hek_cluster_12.txt
    Ignored:    output/tbl_TDP-08-02-targets_hek_cluster_13.txt
    Ignored:    output/tbl_TDP-08-02-targets_hek_cluster_14.txt
    Ignored:    output/tbl_TDP-08-02-targets_hek_cluster_5.txt
    Ignored:    output/tbl_TDP-08-02-targets_hek_cluster_7.txt
    Ignored:    output/tbl_TDP-08-02-targets_hek_cluster_8.txt
    Ignored:    output/tbl_TDP-08-02-targets_hek_cluster_all.xlsx
    Ignored:    output/~$tbl_TDP-08-02-targets_hek_cluster_all.xlsx
    Ignored:    scripts/.DS_Store
    Ignored:    scripts/._.DS_Store
    Ignored:    scripts/._bu_Rcode.R
    Ignored:    scripts/._plasmid_expression.sh

Untracked files:
    Untracked:  Filtered.pdf
    Untracked:  Rplots.pdf
    Untracked:  Unfiltered
    Untracked:  Unfiltered.pdf
    Untracked:  analysis/Lam-0-NSC_no_integration.Rmd
    Untracked:  analysis/TDP-07-01-STMN2_expression copy.Rmd
    Untracked:  analysis/additional_filtering.Rmd
    Untracked:  analysis/additional_filtering_clustering.Rmd
    Untracked:  analysis/organoid-01-1-qualtiy-control.Rmd
    Untracked:  analysis/organoid-06-conos-analysis-Seurat.Rmd
    Untracked:  analysis/organoid-06-conos-analysis-function.Rmd
    Untracked:  analysis/organoid-07-conos-visualization.Rmd
    Untracked:  analysis/organoid-07-group-integration-conos-visualization.Rmd
    Untracked:  analysis/organoid-08-conos-comparison.Rmd
    Untracked:  analysis/organoid-0x-sample_integration.Rmd
    Untracked:  analysis/sample5_QC.Rmd
    Untracked:  coverage.pdf
    Untracked:  coverage_sashimi.pdf
    Untracked:  coverage_sashimi.png
    Untracked:  data/Homo_sapiens.GRCh38.98.sorted.gtf
    Untracked:  data/Kanton_et_al/
    Untracked:  data/Lam_et_al/
    Untracked:  data/Sep2020/
    Untracked:  data/reference/
    Untracked:  data/virus_cell_tropism_markers.R
    Untracked:  data/~$Reactive_astrocytes_markers.xlsx
    Untracked:  pbDS_cell_level.pdf
    Untracked:  pbDS_heatmap.pdf
    Untracked:  pbDS_top_expr_umap.pdf
    Untracked:  pbDS_upset.pdf
    Untracked:  sashimi.pdf
    Untracked:  scripts/bu_Rcode.R
    Untracked:  scripts/bu_code.Rmd
    Untracked:  scripts/salmon-latest_linux_x86_64/
    Untracked:  stmn2.pdf
    Untracked:  tdp.pdf

Unstaged changes:
    Modified:   analysis/05-annotation.Rmd
    Modified:   analysis/Lam-02-NSC_annotation.Rmd
    Modified:   analysis/TDP-04-clustering.Rmd
    Modified:   analysis/TDP-06-cluster_analysis.Rmd
    Modified:   analysis/TDP-08-01-HA-D96-expression-changes.Rmd
    Modified:   analysis/_site.yml
    Modified:   analysis/organoid-02-integration.Rmd
    Modified:   analysis/organoid-04-group_integration.Rmd
    Modified:   analysis/organoid-06-conos-analysis.Rmd
    Modified:   analysis/timepoints-01-organoid-integration.Rmd
Note that any generated files, e.g. HTML, png, CSS, etc., are not included in this status report because it is ok for generated content to have uncommitted changes.
These are the previous versions of the repository in which changes were made to the R Markdown (analysis/03-filtering.Rmd) and HTML (docs/03-filtering.html) files. If you've configured a remote Git repository (see ?wflow_git_remote), click on the hyperlinks in the table below to view the files as they were in that past version.
| File | Version | Author | Date | Message |
|---|---|---|---|---|
| Rmd | 1d0e2aa | khembach | 2021-04-06 | add number of cells, UMIs and detected genes per cell and sample |
| html | 947869a | khembach | 2020-09-07 | Build site. |
| html | 4b87d30 | khembach | 2020-09-07 | Build site. |
| Rmd | 81eda23 | khembach | 2020-09-07 | write unfiltered count matrix |
| html | 5567602 | khembach | 2020-06-26 | Build site. |
| Rmd | afe57cc | khembach | 2020-06-26 | additional filtering of sample 5 and 6 |
| html | 1f41de5 | khembach | 2020-06-08 | Build site. |
| html | 6d822af | khembach | 2020-05-28 | Build site. |
| Rmd | a7ced59 | khembach | 2020-05-28 | cell and gene filtering |
Load packages
library(scater)
library(LSD)
library(dplyr)
library(edgeR)
library(ggrepel)
Load data
sce <- readRDS(file.path("output", "sce_02_quality_control.rds"))Identification of outlier cells
Based on the QC metrics, we now identify outlier cells:
cols <- c("sum", "detected", "subsets_Mt_percent")
log <- c(TRUE, TRUE, FALSE)
type <- c("both", "both", "higher")

drop_cols <- paste0(cols, "_drop")
for (i in seq_along(cols))
    colData(sce)[[drop_cols[i]]] <- isOutlier(sce[[cols[i]]],
        nmads = 3, type = type[i], log = log[i], batch = sce$sample_id)

# Overlap of outlier cells from two metrics
sapply(drop_cols, function(i)
    sapply(drop_cols, function(j)
        sum(sce[[i]] & sce[[j]])))
sum_drop detected_drop subsets_Mt_percent_drop
sum_drop 2499 2289 614
detected_drop 2289 2740 809
subsets_Mt_percent_drop 614 809 2611colData(sce)$discard <- rowSums(data.frame(colData(sce)[,drop_cols])) > 0
table(colData(sce)$discard)
FALSE  TRUE
43846  4735
## Plot the metrics and highlight the discarded cells
plotColData(sce, x = "sample_id", y = "sum", colour_by = "discard") +
scale_y_log10()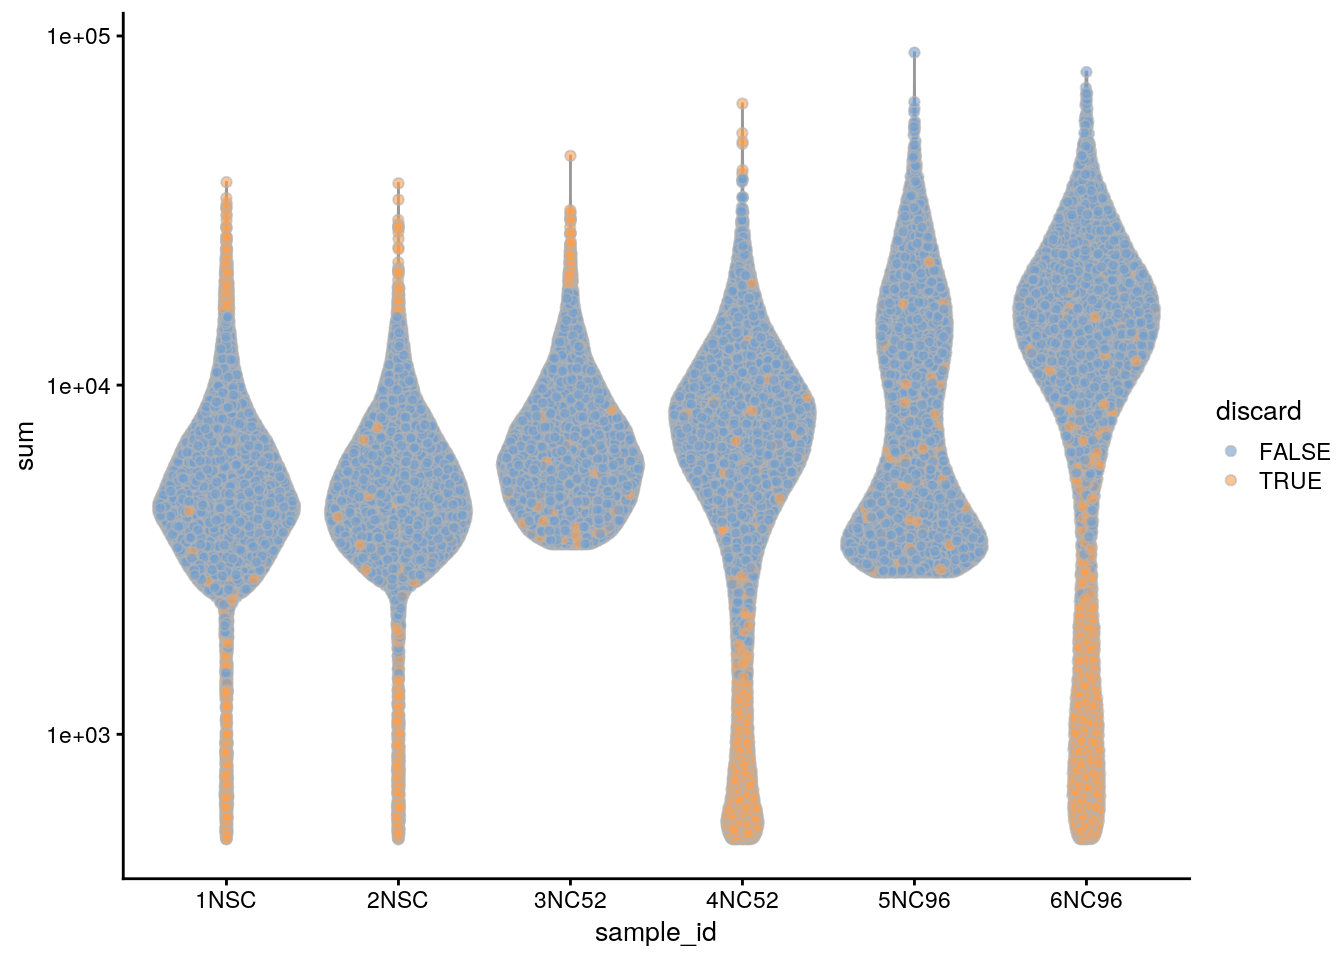
plotColData(sce, x = "sample_id", y = "detected", colour_by = "discard") +
  scale_y_log10()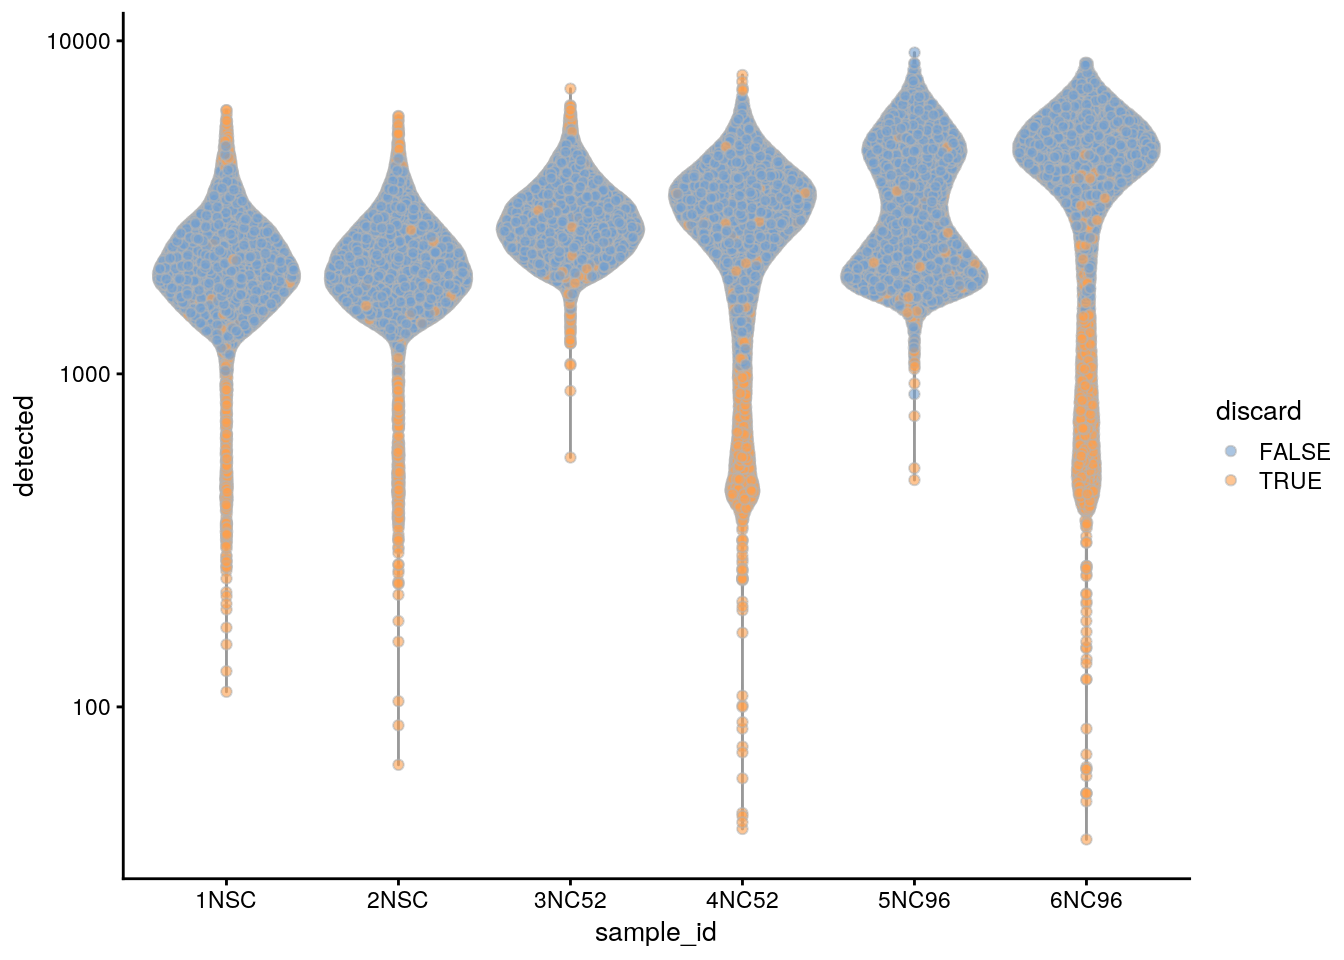
plotColData(sce, x = "sample_id", y = "subsets_Mt_percent",
            colour_by = "discard")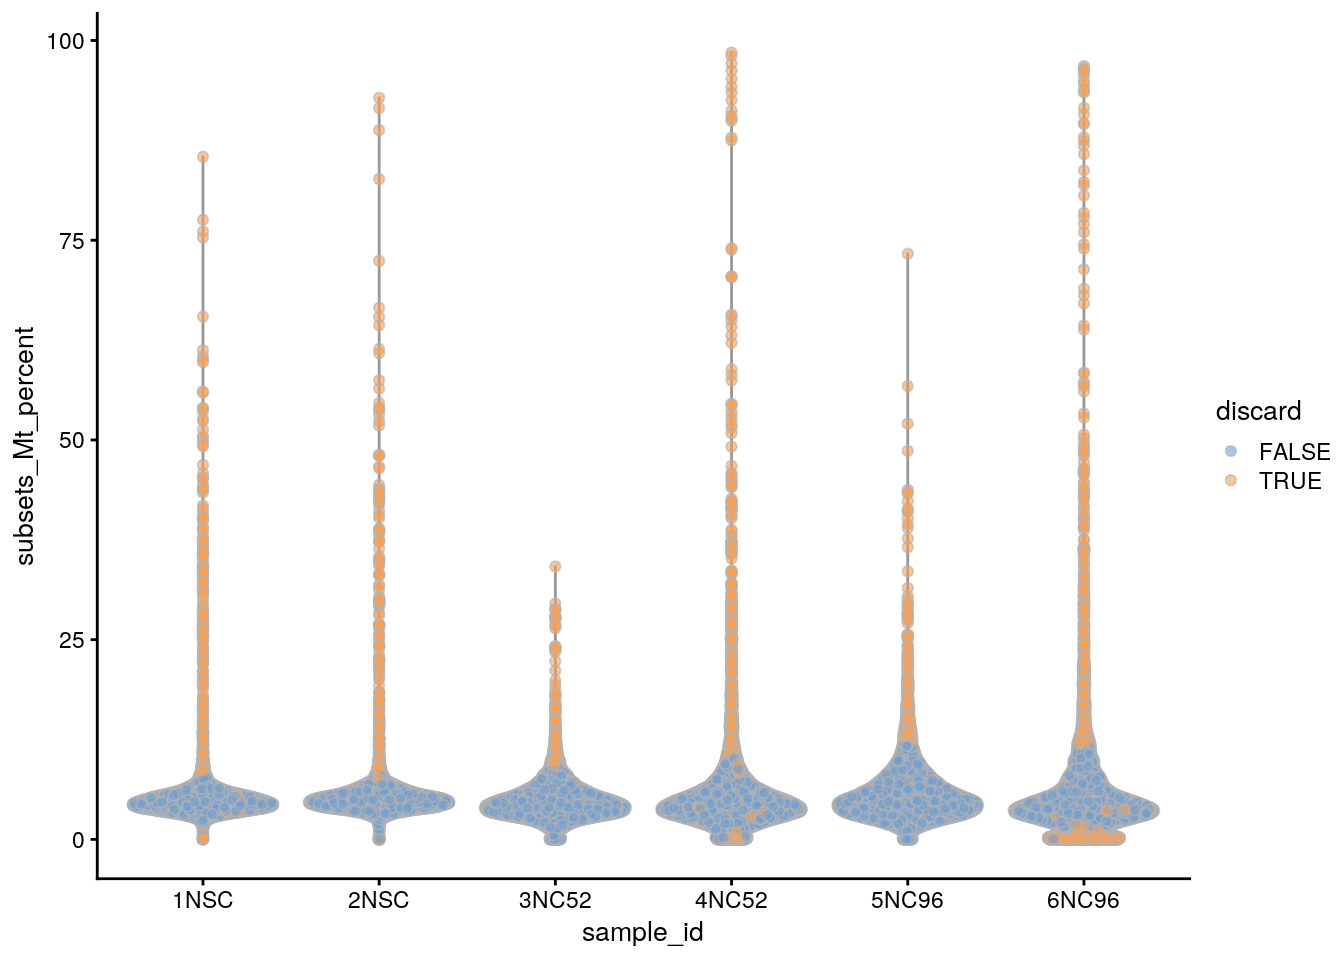
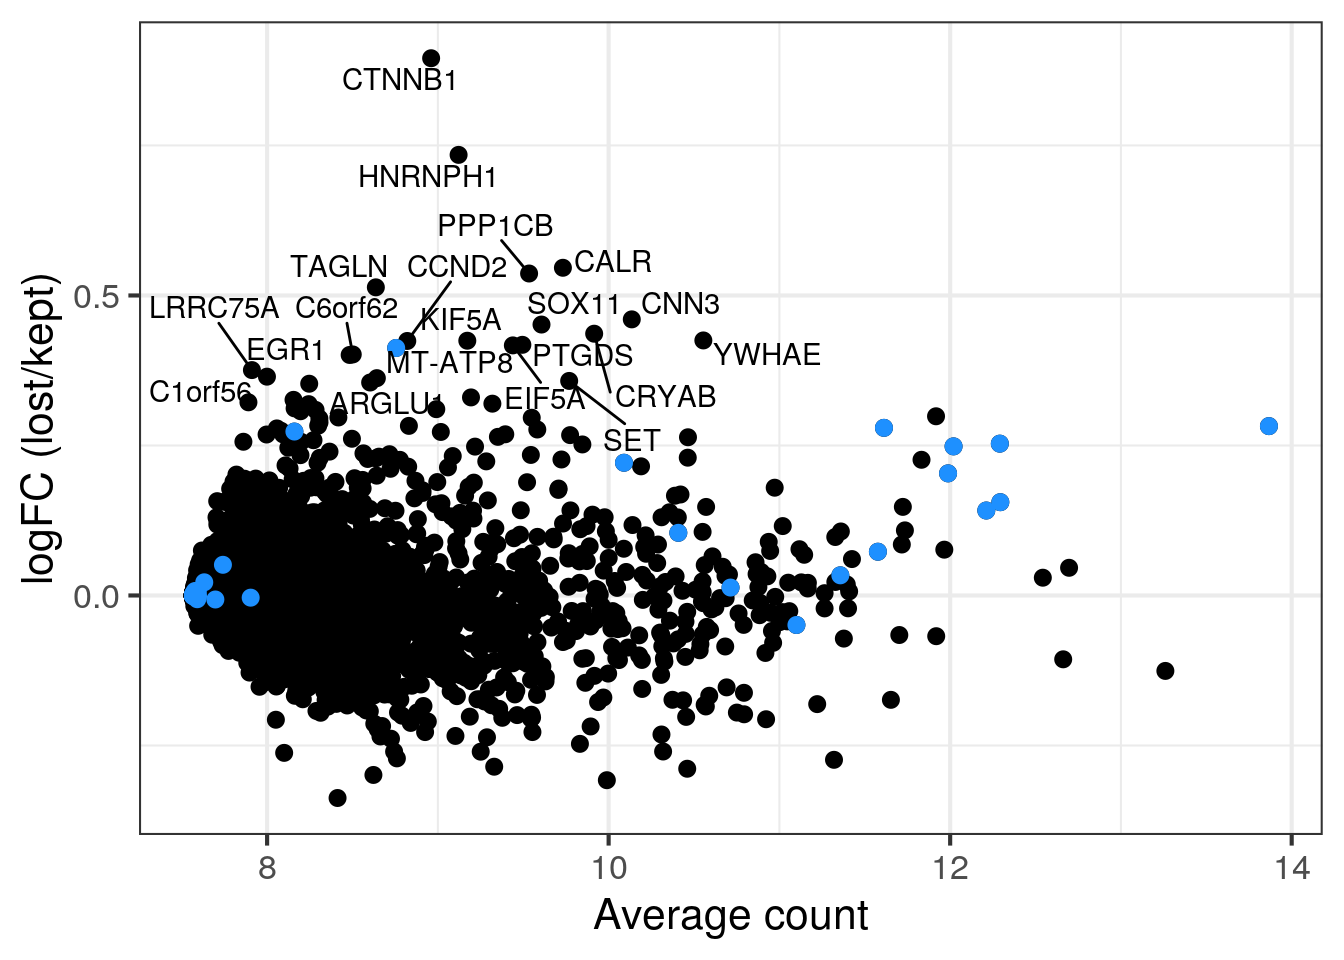
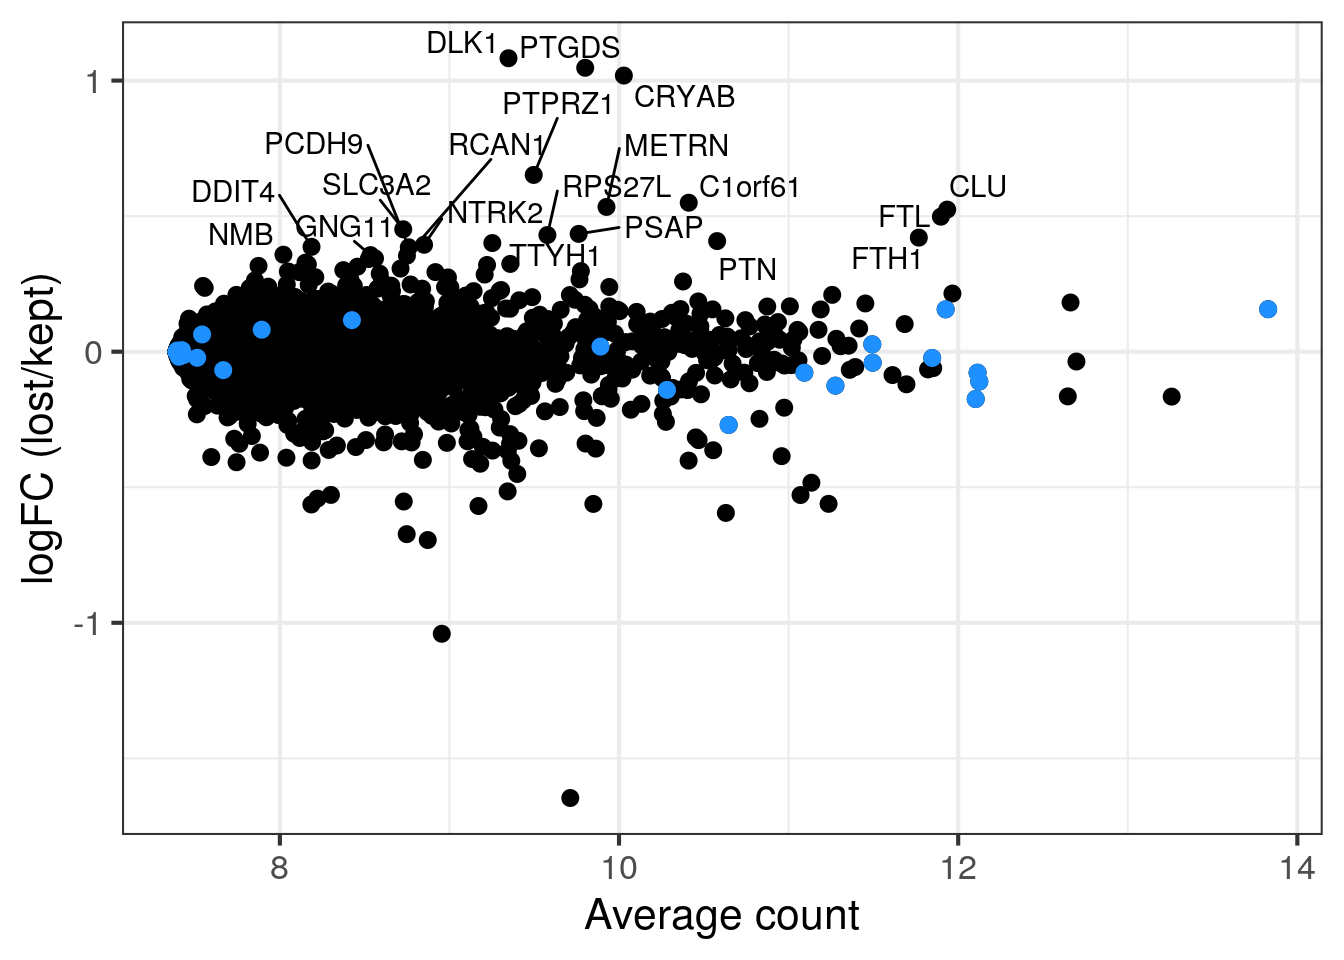
MA plot of the two populations
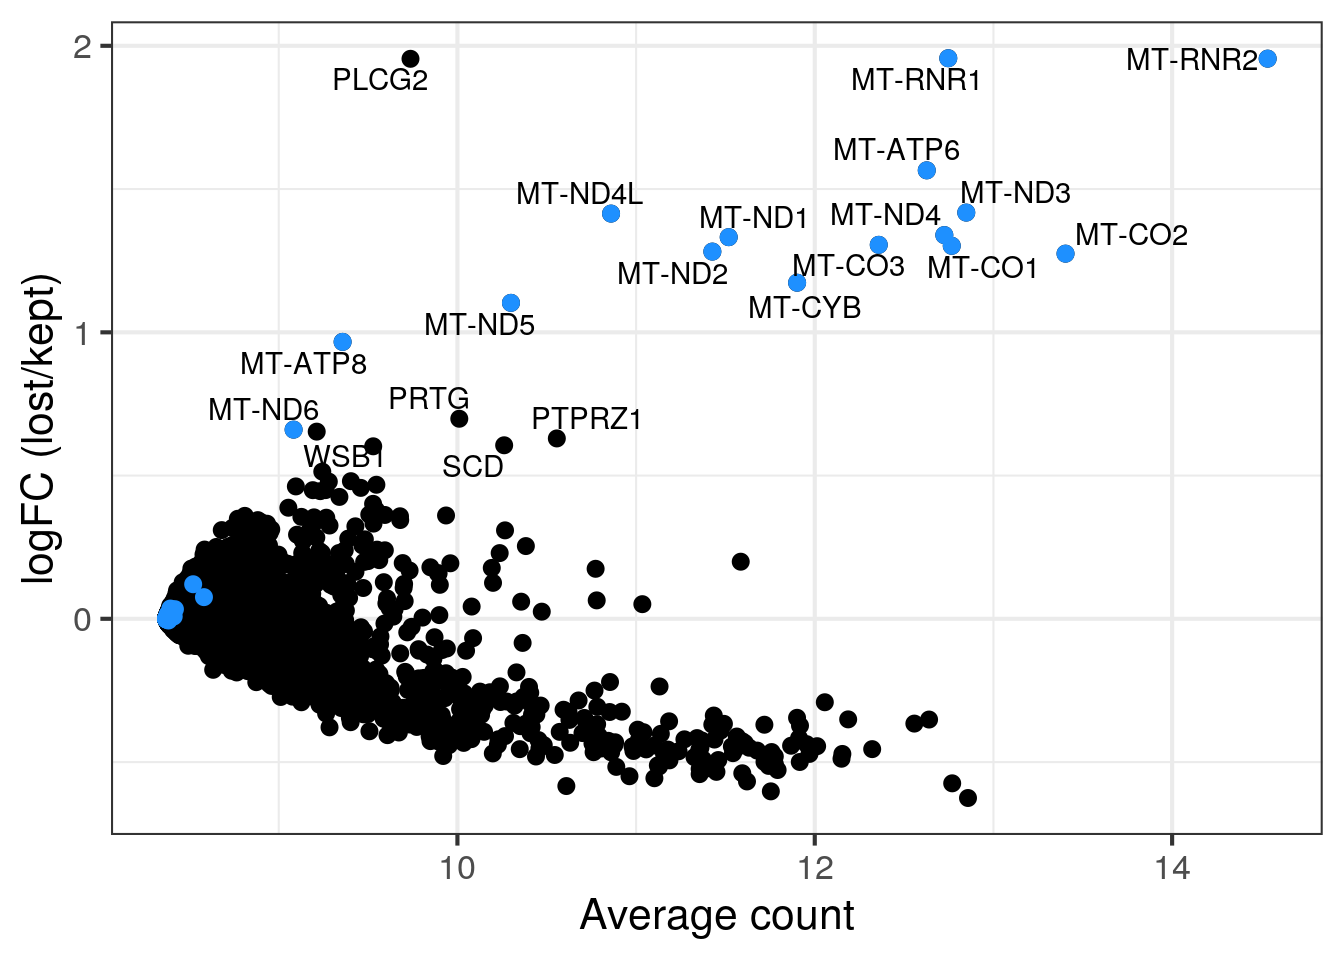
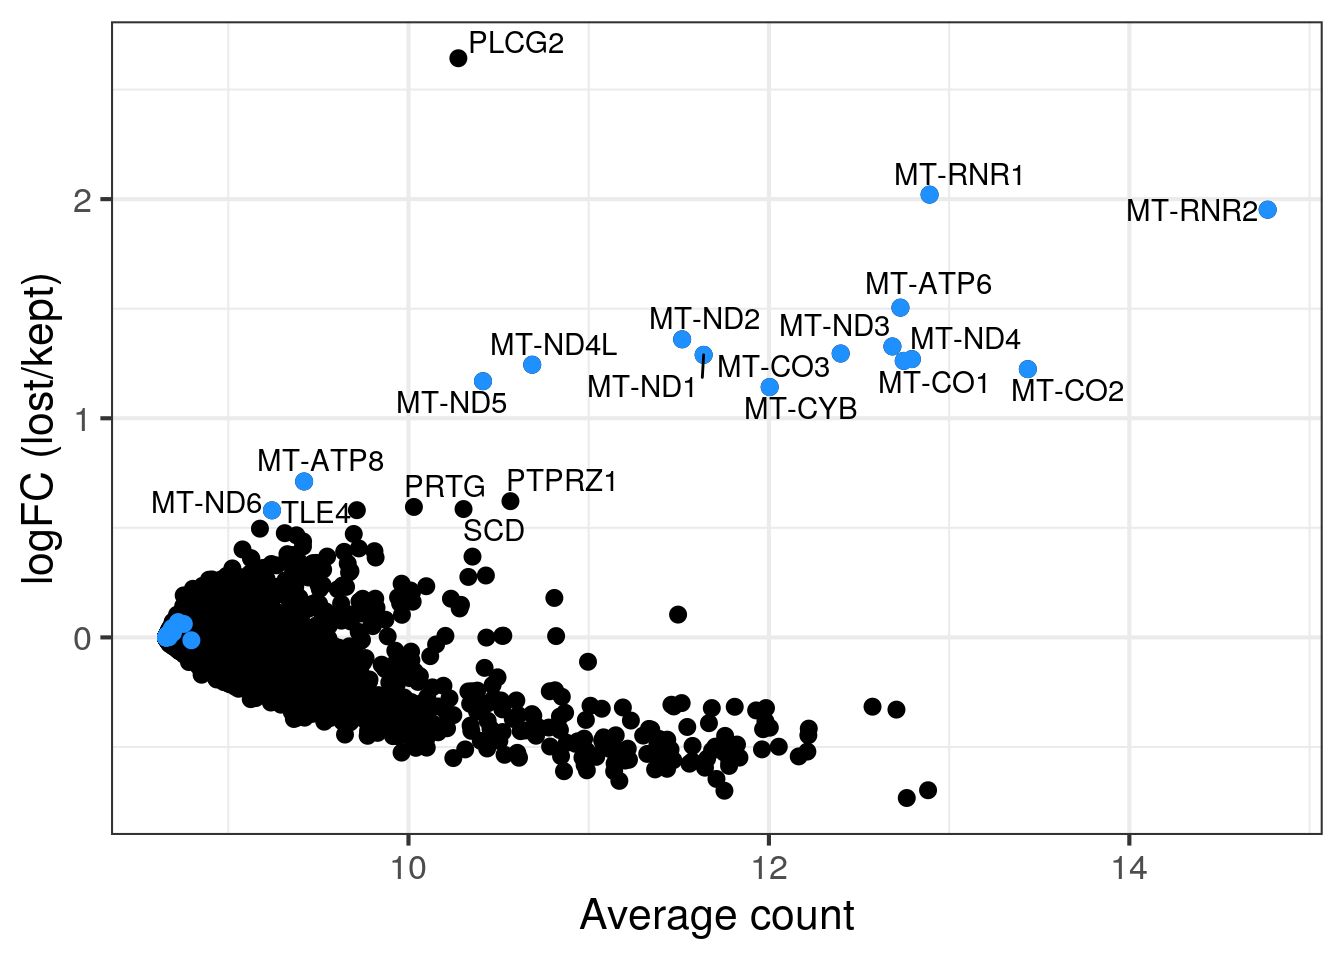
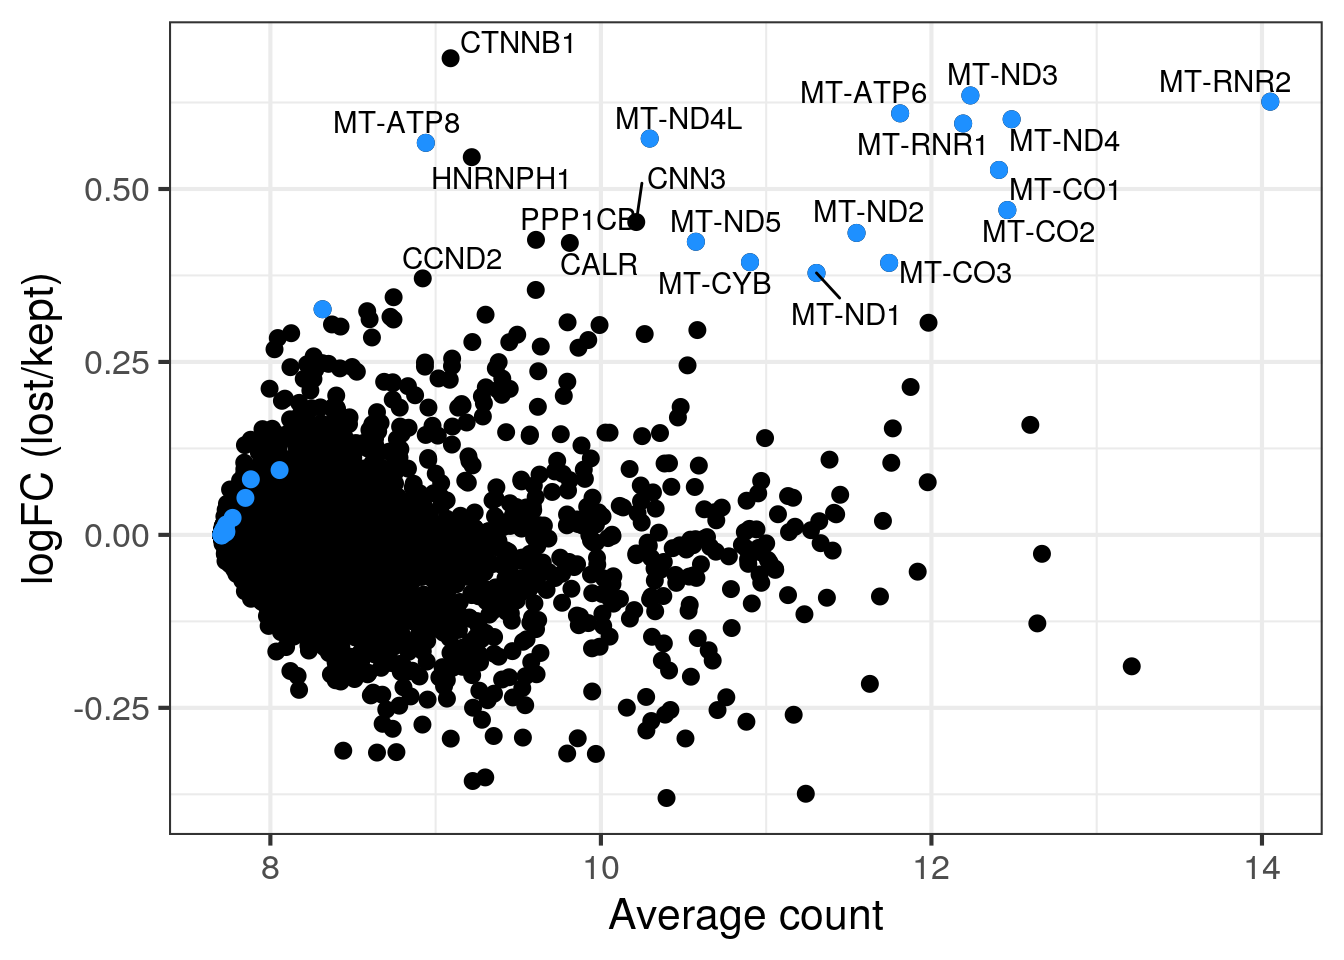
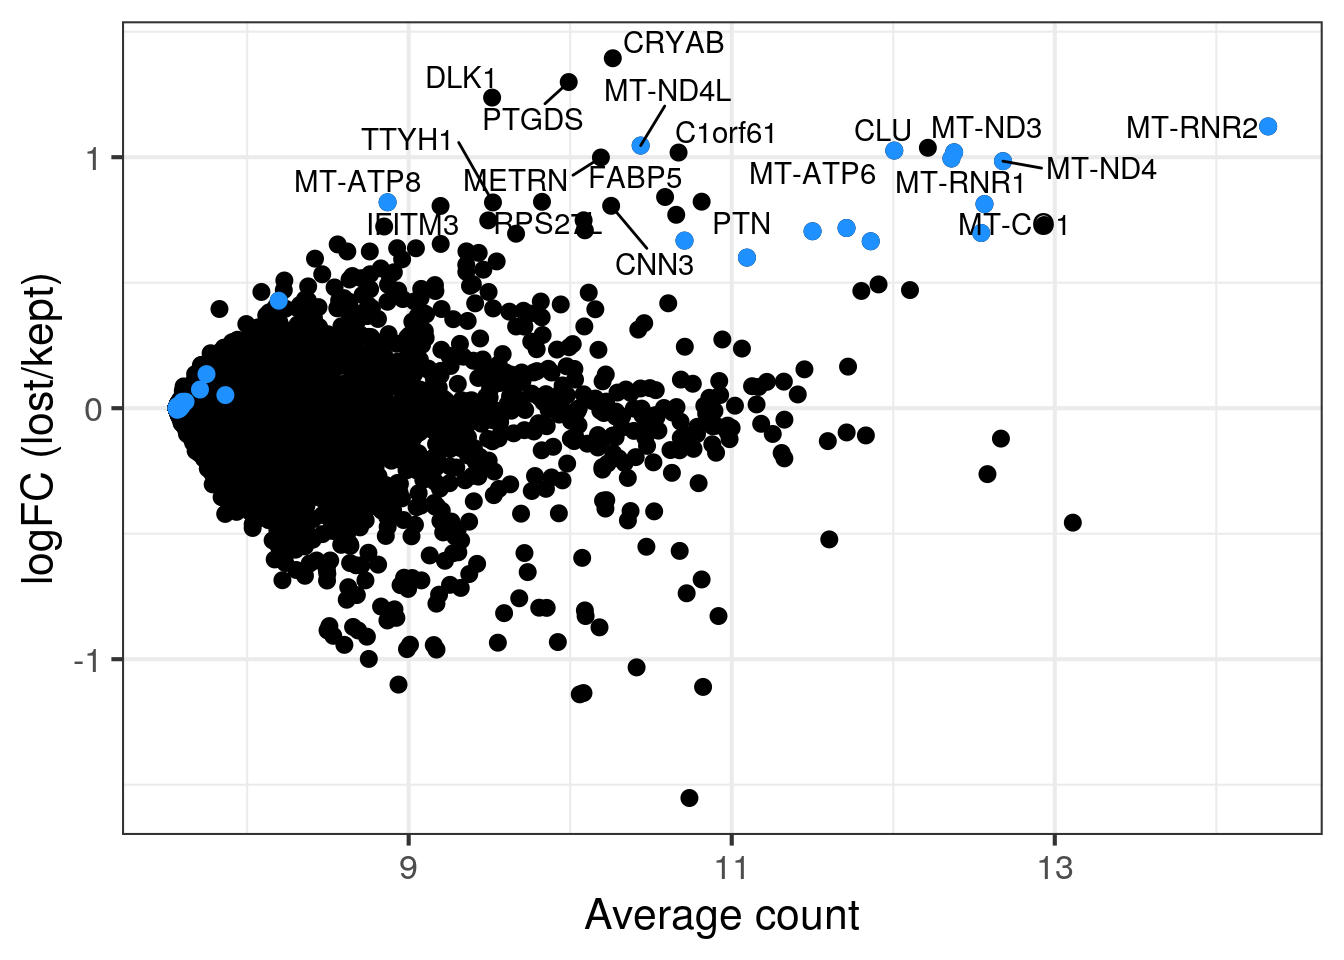
We think that the second cell population in sample 5 with the lower number of UMIs and detected genes consists of damaged cells caused by the dissociation. Sample 5 and 6 are technical replicates and we thus expect similar distributions of the QC metrics. We want to know if there are any genes enriched in the second cell population or if we can safely remove the cells?
To check if we would discarded an specific cell identity with out stringent filtering, we compare the gene expression in the two cell populations (excluding the outlier cells as defined above). If the second cell population is enriched for a specific cell identity, the corresponding marker genes will have high log2FC in the MA plot. Mitochondrial genes are in blue.
for (i in c("5NC96", "6NC96")) {
cat("### ", i, "\n")
## all retained cells
part <- sce[,colData(sce)$sample_id == i & colData(sce)$discard == FALSE]
## second population: cells with less than 7000 detected genes in sample 5
colData(part)$second_pop <- (colData(part)$sum < 7000 |
  colData(part)$detected < 3000)
plotColData(part, x = "sample_id", y = "sum", colour_by = "second_pop") +
  scale_y_log10()
plotColData(part, x = "sample_id", y = "detected", colour_by = "second_pop") +
  scale_y_log10()

lost <- calculateAverage(counts(part)[,colData(part)$second_pop])
kept <- calculateAverage(counts(part)[,!colData(part)$second_pop])
logged <- cpm(cbind(lost, kept), log=TRUE, prior.count=2)
logFC <- logged[,1] - logged[,2]
abundance <- rowMeans(logged)

label <- rep("", length(logFC))
top <- order(logFC, decreasing = TRUE)[1:20]
label[top]  <- rowData(sce)$symbol[top]
df <- data.frame(abundance = abundance, logFC = logFC, label = label)
mito <- grep("MT-", rownames(sce), value = TRUE)
p <- ggplot(df, aes(x = abundance, y = logFC, label = label)) +
  geom_point(size = 2.5) +
  geom_point(data = df[mito,], color = "dodgerblue", size = 2.5) +
  xlab("Average count") + ylab("logFC (lost/kept)") +
  theme_bw(base_size = 16) +
  geom_text_repel()
print(p)
cat("\n\n")
}
5NC96
6NC96
We decided to additionally filter the cells in sample 5 and 6.
## filter the cells with less than 5000 UMIs in sample 5 and 6
colData(sce) %>% data.frame() %>%
  filter(sample_id %in% c("5NC96", "6NC96")) %>%
  group_by(sample_id, discard) %>%
  summarise(below_cutoff = sum(sum < 5000))
# A tibble: 4 x 3
# Groups: sample_id [2]
sample_id discard below_cutoff
<fct> <lgl> <int>
1 5NC96 FALSE 2526
2 5NC96 TRUE 160
3 6NC96 FALSE 134
4 6NC96 TRUE 1221colData(sce)$manual_discard_sum <- colData(sce)$sum < 5000 &
colData(sce)$sample_id %in% c("5NC96", "6NC96")
## filter the cells with less than 3000 detected genes in sample 5 and 6
colData(sce) %>% data.frame() %>%
filter(sample_id %in% c("5NC96", "6NC96")) %>%
group_by(sample_id, discard) %>%
summarise(below_cutoff = sum(detected < 2500) )# A tibble: 4 x 3
# Groups: sample_id [2]
sample_id discard below_cutoff
<fct> <lgl> <int>
1 5NC96 FALSE 2561
2 5NC96 TRUE 202
3 6NC96 FALSE 183
4 6NC96 TRUE 1259colData(sce)$manual_discard_detected <- colData(sce)$detected < 2500 &
colData(sce)$sample_id %in% c("5NC96", "6NC96")
## highlight all manually discarded cells
colData(sce)$manual_discard <- colData(sce)$manual_discard_sum |
colData(sce)$manual_discard_detected
plotColData(sce, x = "sample_id", y = "sum", colour_by = "manual_discard") +
scale_y_log10()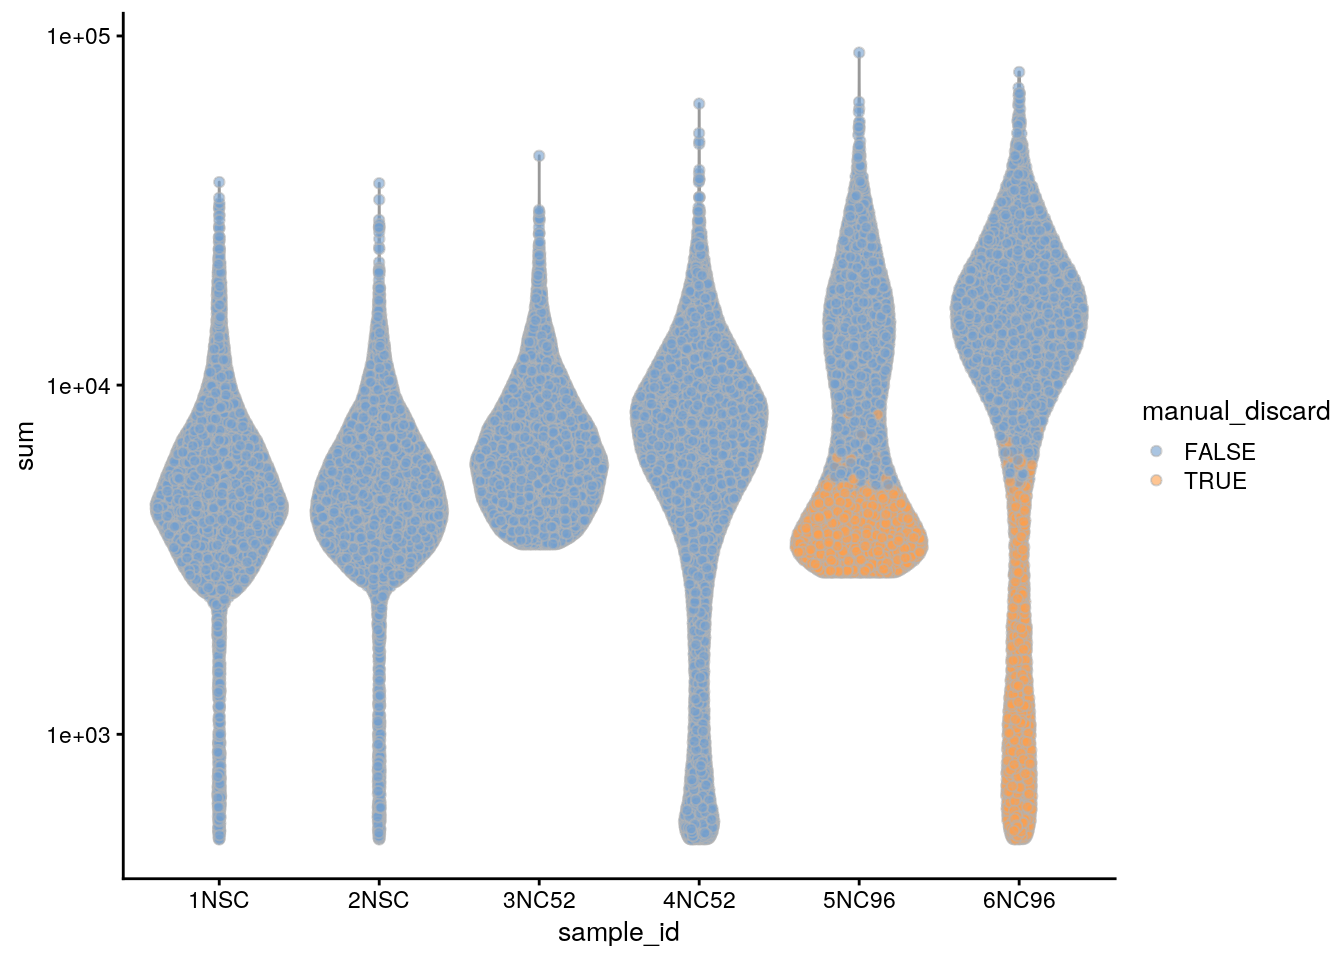
plotColData(sce, x = "sample_id", y = "detected", colour_by = "manual_discard") +
  scale_y_log10()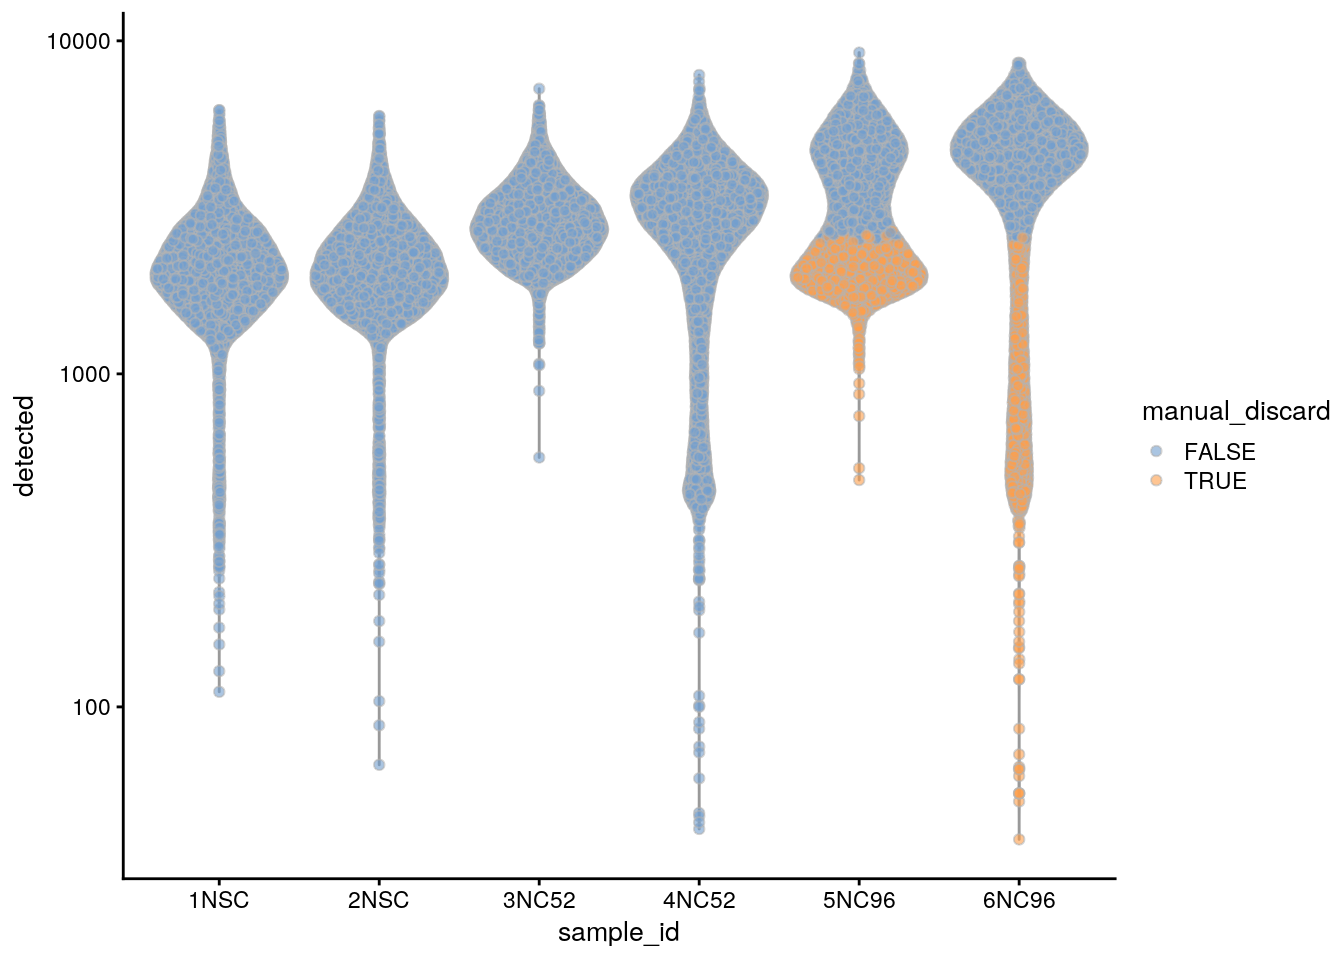
## highlight all discarded cells
colData(sce)$discard <- colData(sce)$manual_discard |
                                   colData(sce)$discard
plotColData(sce, x = "sample_id", y = "detected", colour_by = "discard") +
  scale_y_log10()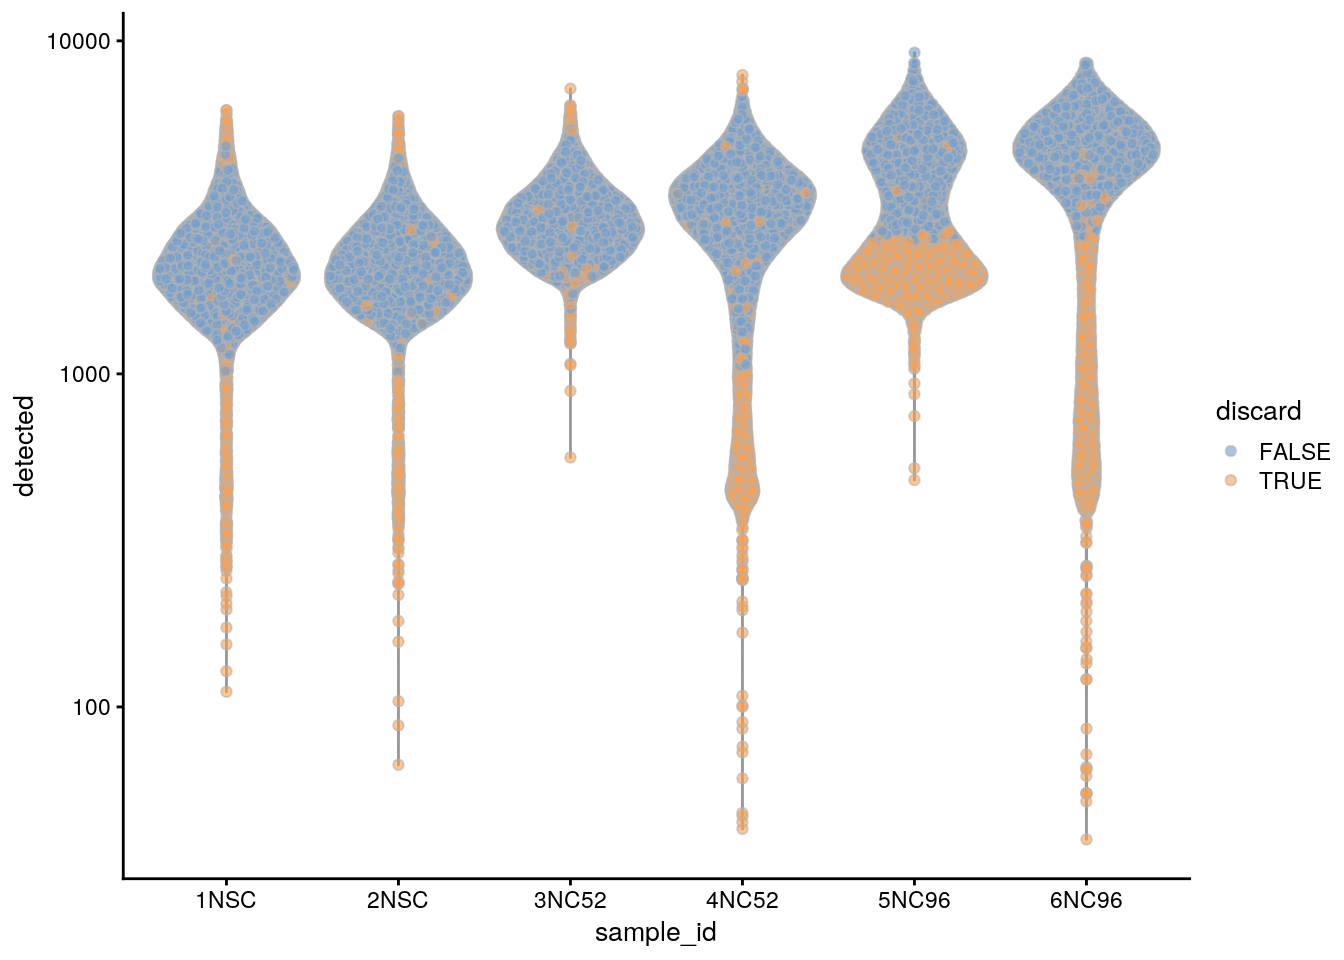
plotColData(sce, x = "sample_id", y = "sum", colour_by = "discard") +
  scale_y_log10()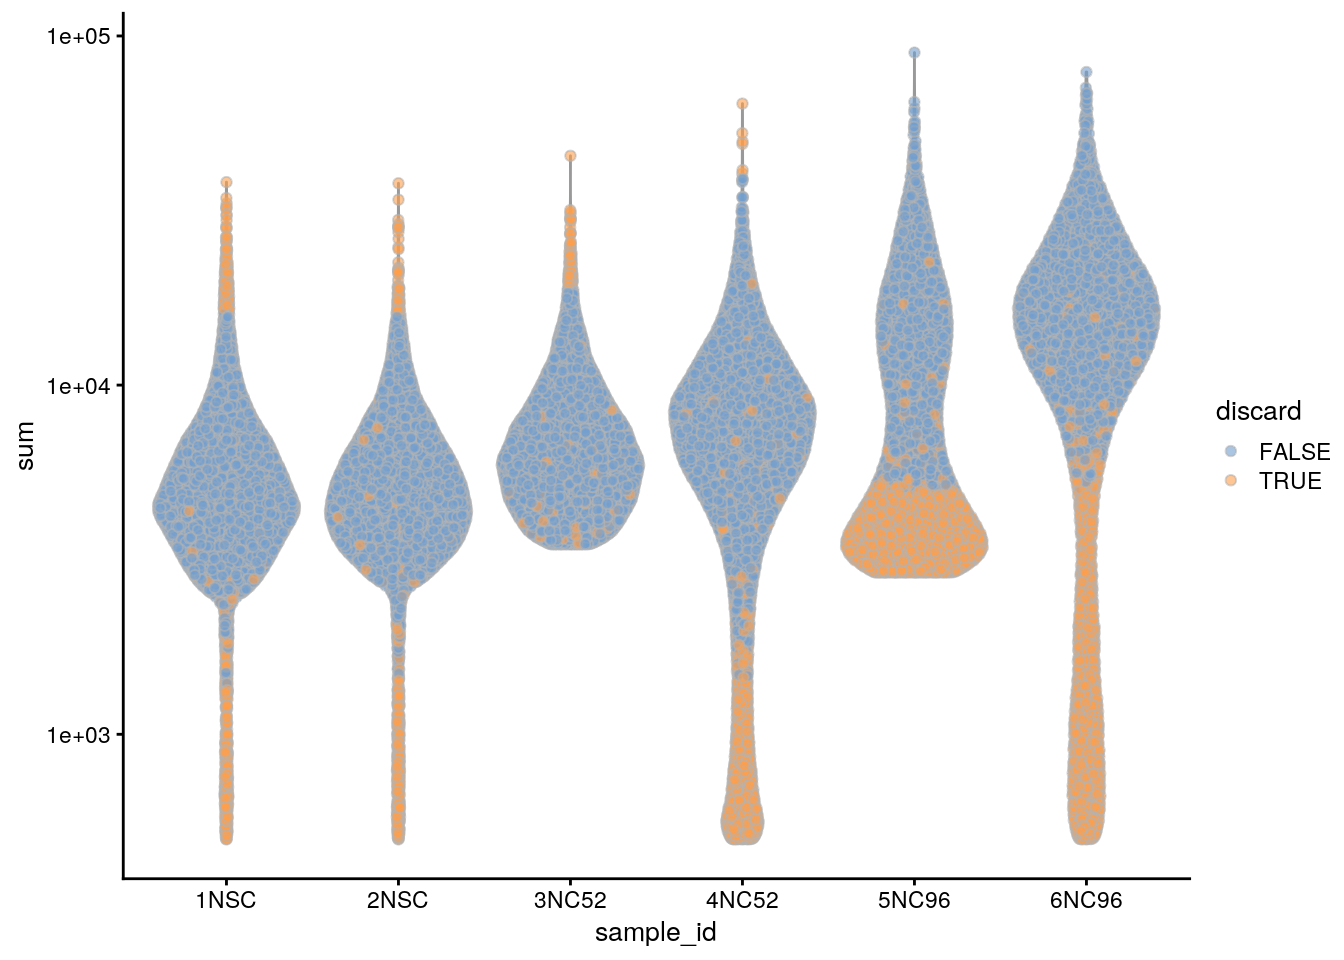
plotColData(sce, x = "sample_id", y = "subsets_Mt_percent",
            colour_by = "discard")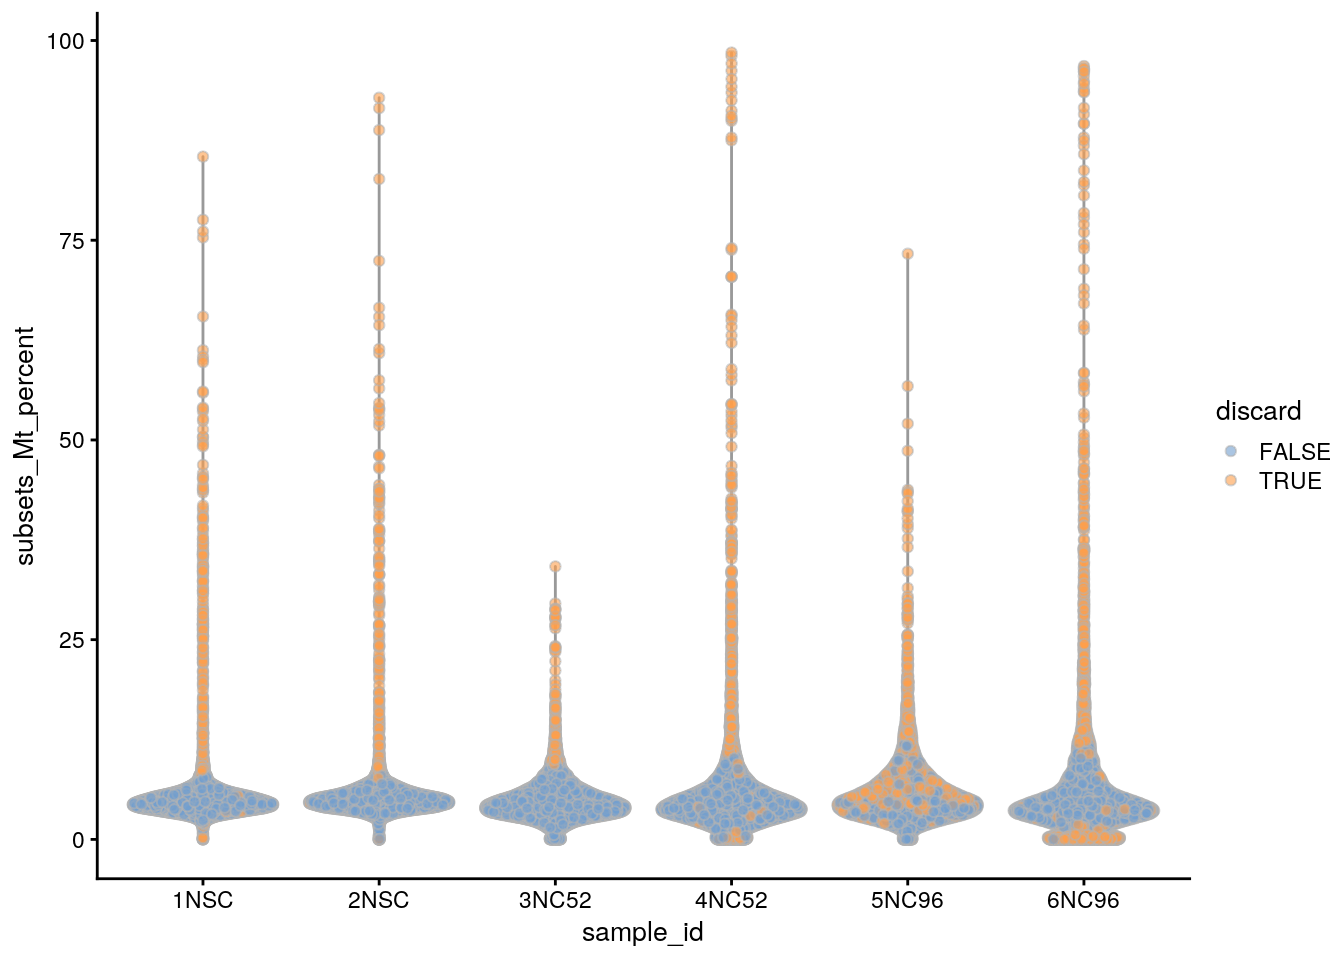
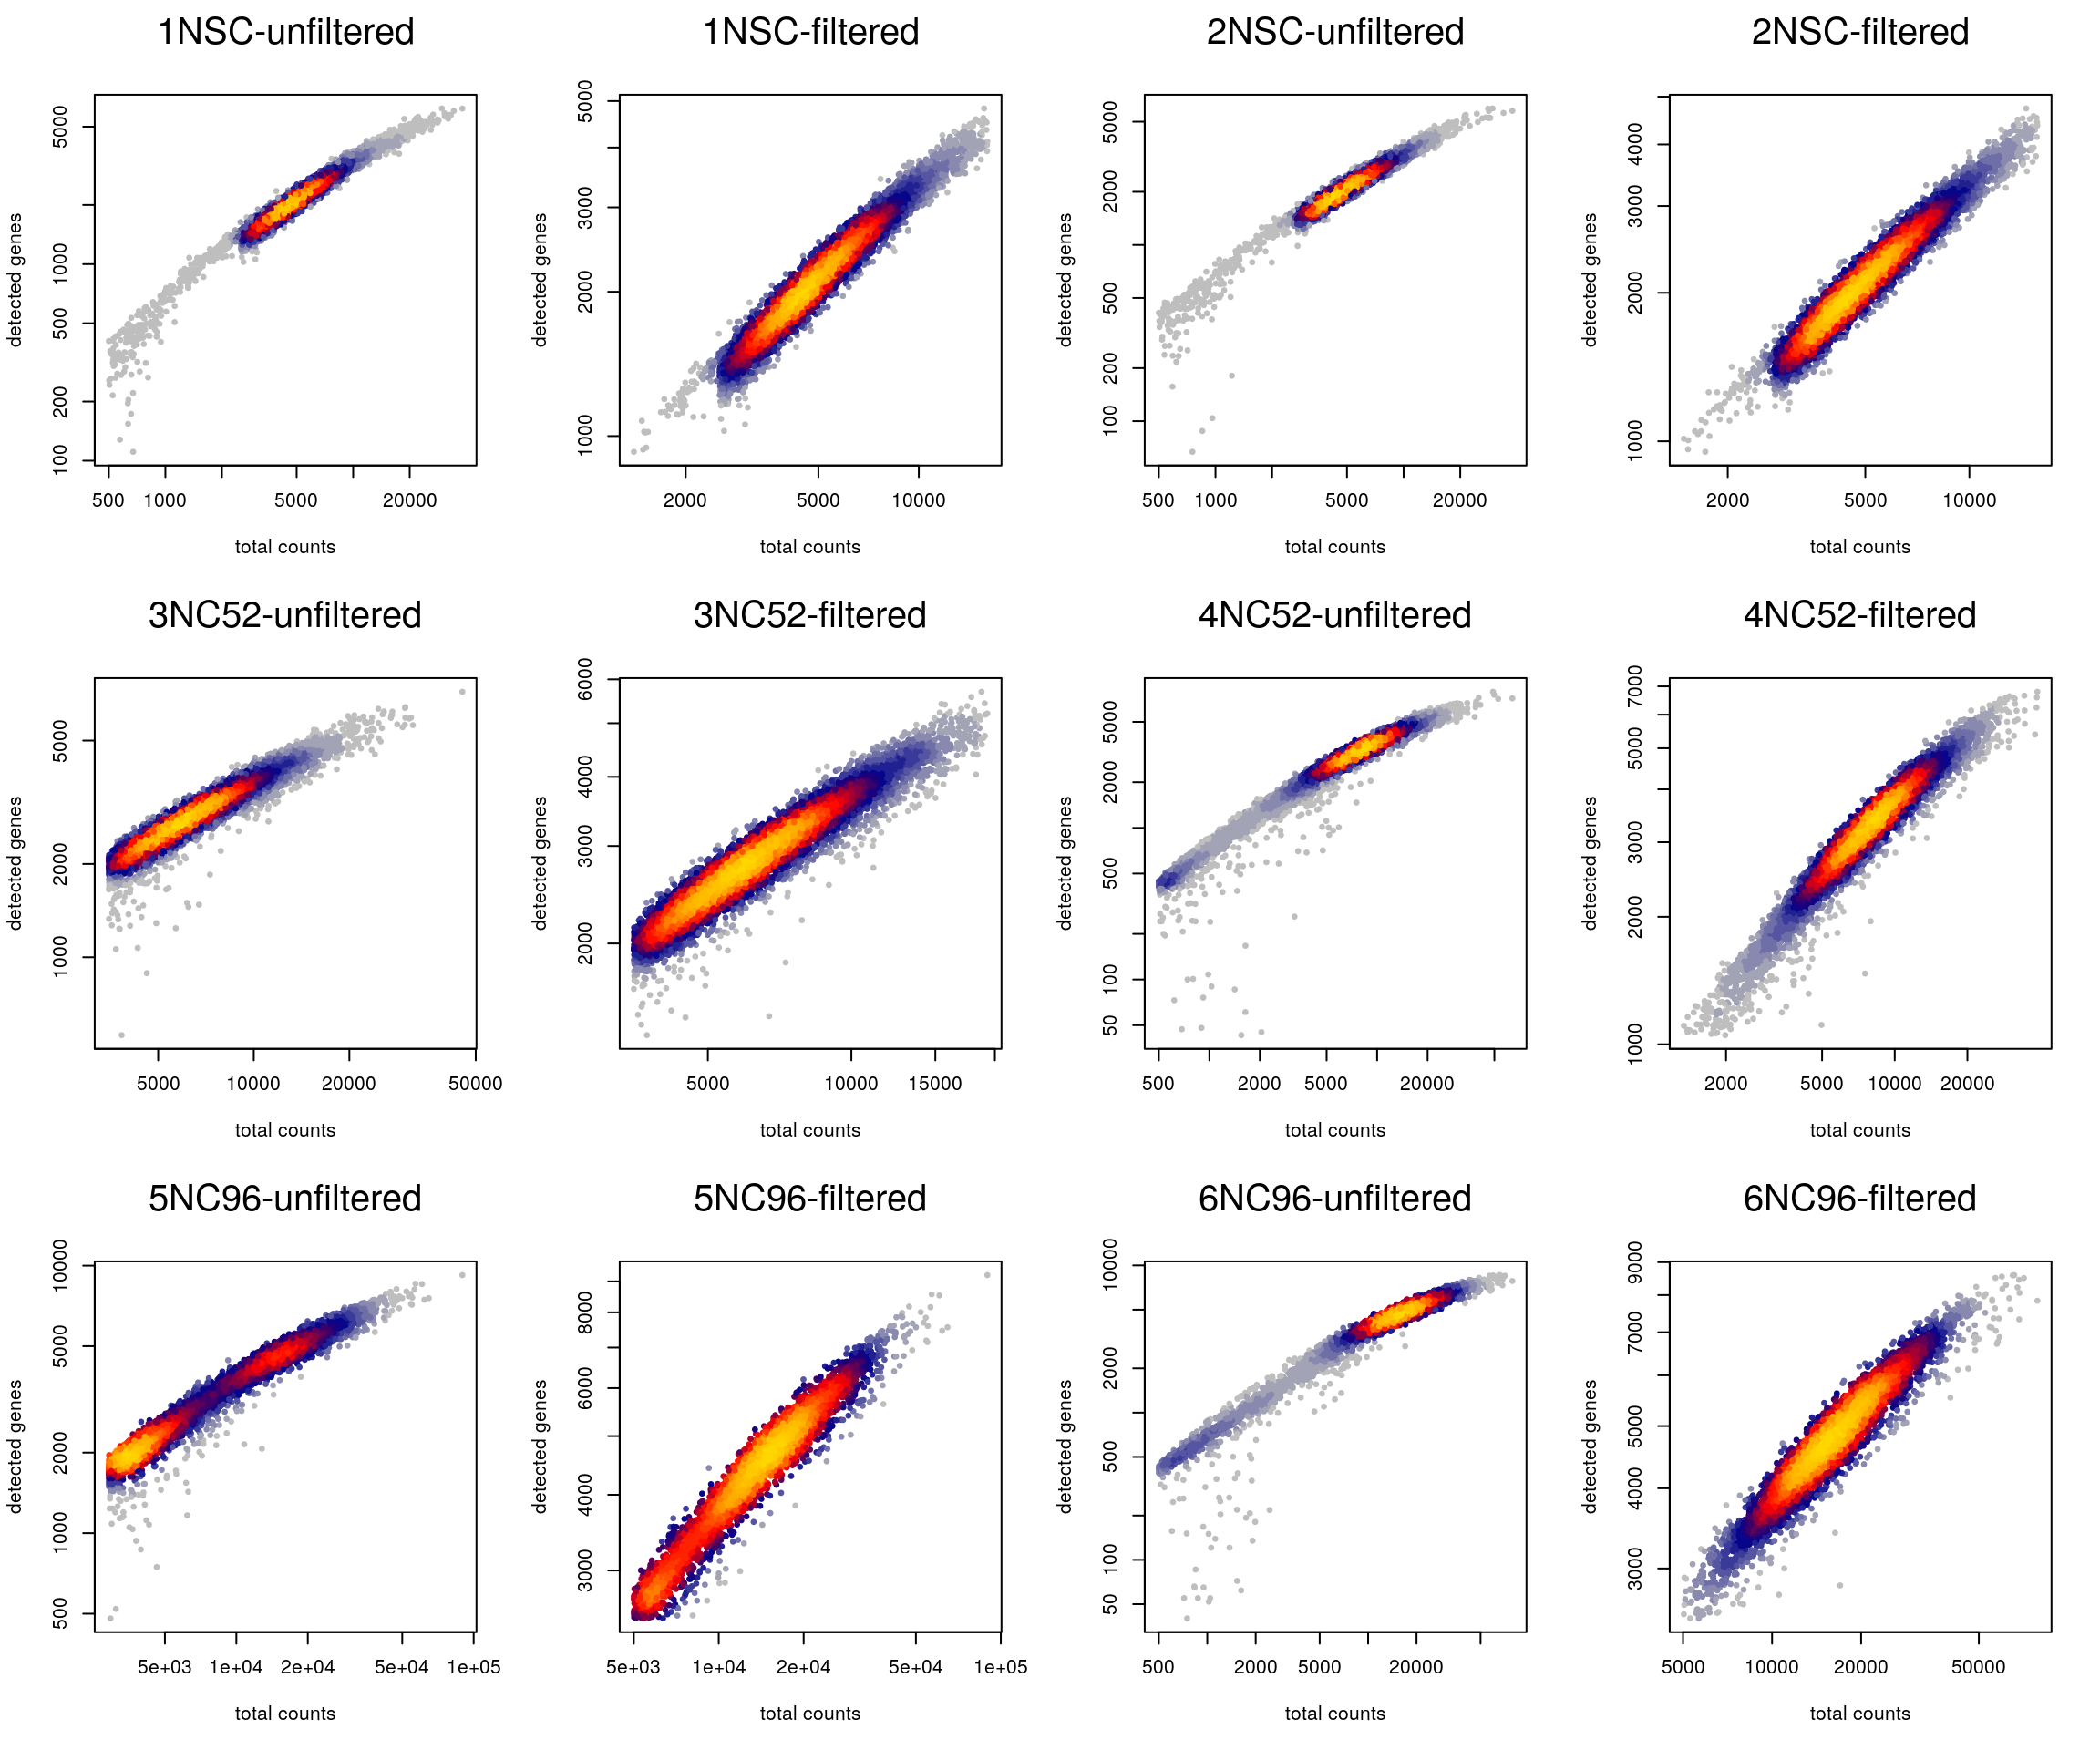
Plot the library size against the number of detected genes before and after filtering.
cd <- colData(sce)
layout(matrix(1:12, nrow = 3, byrow = TRUE))
for (i in levels(sce$sample_id)) {
  tmp <- cd[cd$sample_id == i,]
  heatscatter(tmp$sum, tmp$detected, log = "xy",
              main = paste0(i, "-unfiltered"), xlab = "total counts",
              ylab = "detected genes")
  heatscatter(tmp$sum[!tmp$discard], tmp$detected[!tmp$discard],
              log = "xy", main = paste0(i, "-filtered"), xlab = "total counts",
              ylab = "detected genes")
}
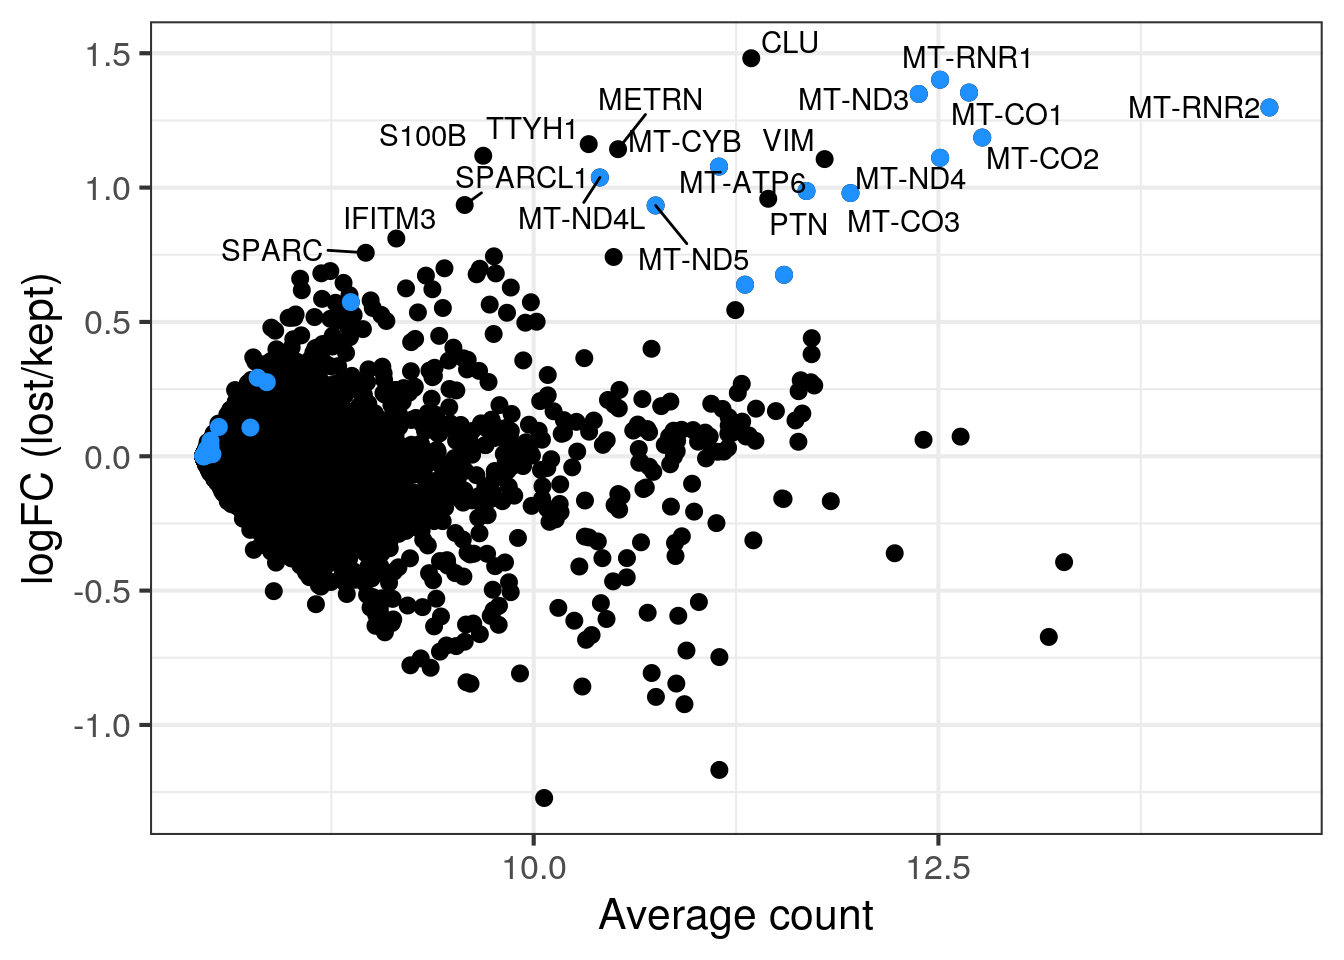
MA plot of all discarded over retained cells
MA plot of all discarded cells (outlier cells or cells in second population in sample 5) over the retained cells. Mitochondrial genes in blue.
lost <- calculateAverage(counts(sce)[,colData(sce)$discard])
kept <- calculateAverage(counts(sce)[,!colData(sce)$discard])

logged <- cpm(cbind(lost, kept), log=TRUE, prior.count=2)
logFC <- logged[,1] - logged[,2]
abundance <- rowMeans(logged)

## only label genes with high logFC
label <- rep("", length(logFC))
top <- order(logFC, decreasing = TRUE)[1:20]
label[top]  <- rowData(sce)$symbol[top]
df <- data.frame(abundance = abundance, logFC = logFC, label = label)
mito <- grep("MT-", rownames(sce), value = TRUE)
p <- ggplot(df, aes(x = abundance, y = logFC, label = label)) +
  geom_point(size = 2.5) +
  geom_point(data = df[mito,], color = "dodgerblue", size = 2.5) +
  xlab("Average count") + ylab("logFC (lost/kept)") +
  theme_bw(base_size = 16) +
  geom_text_repel()
print(p)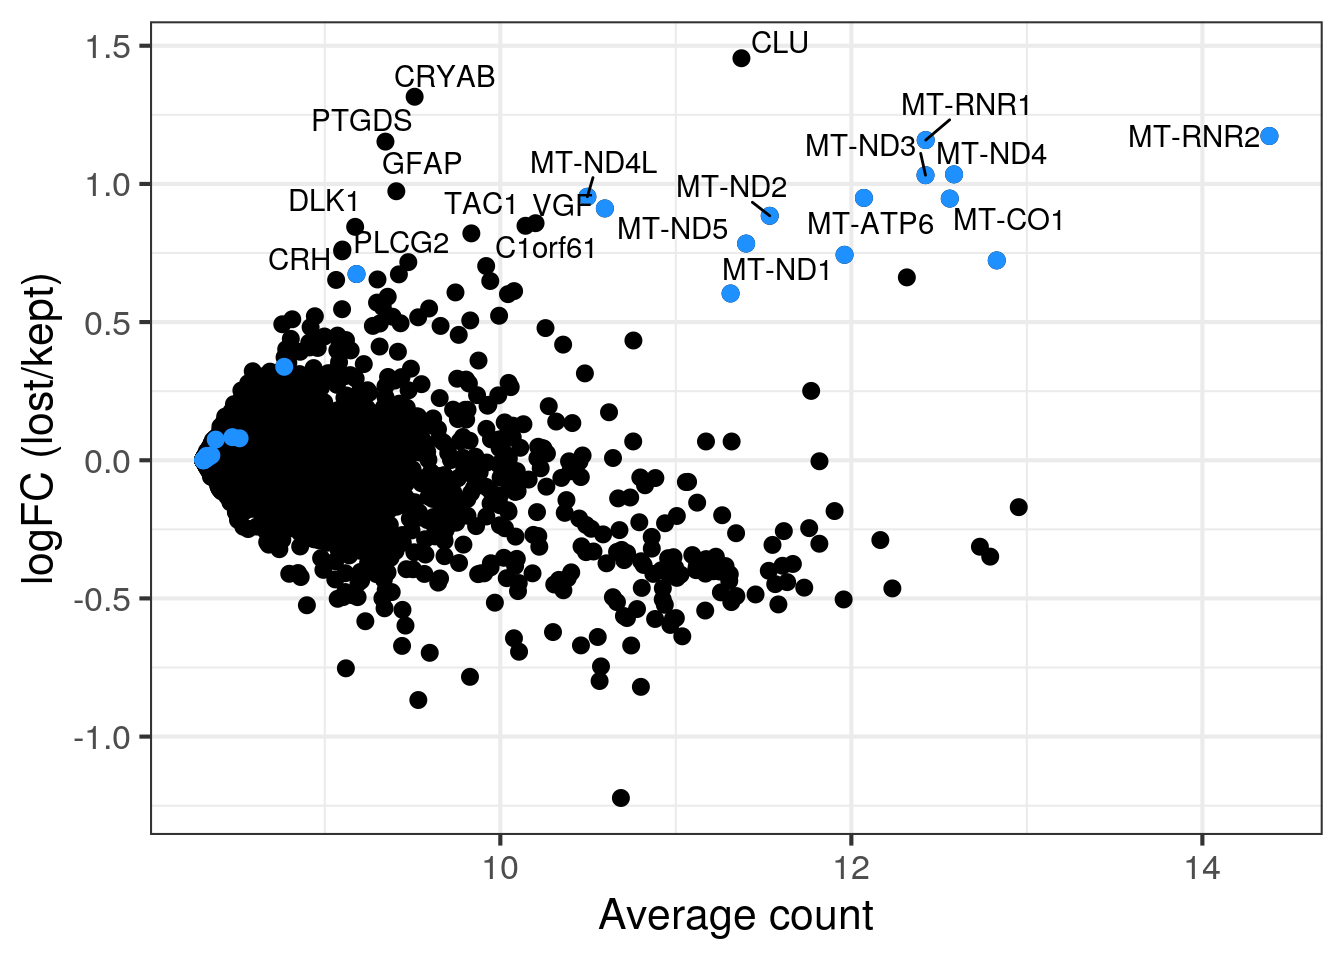
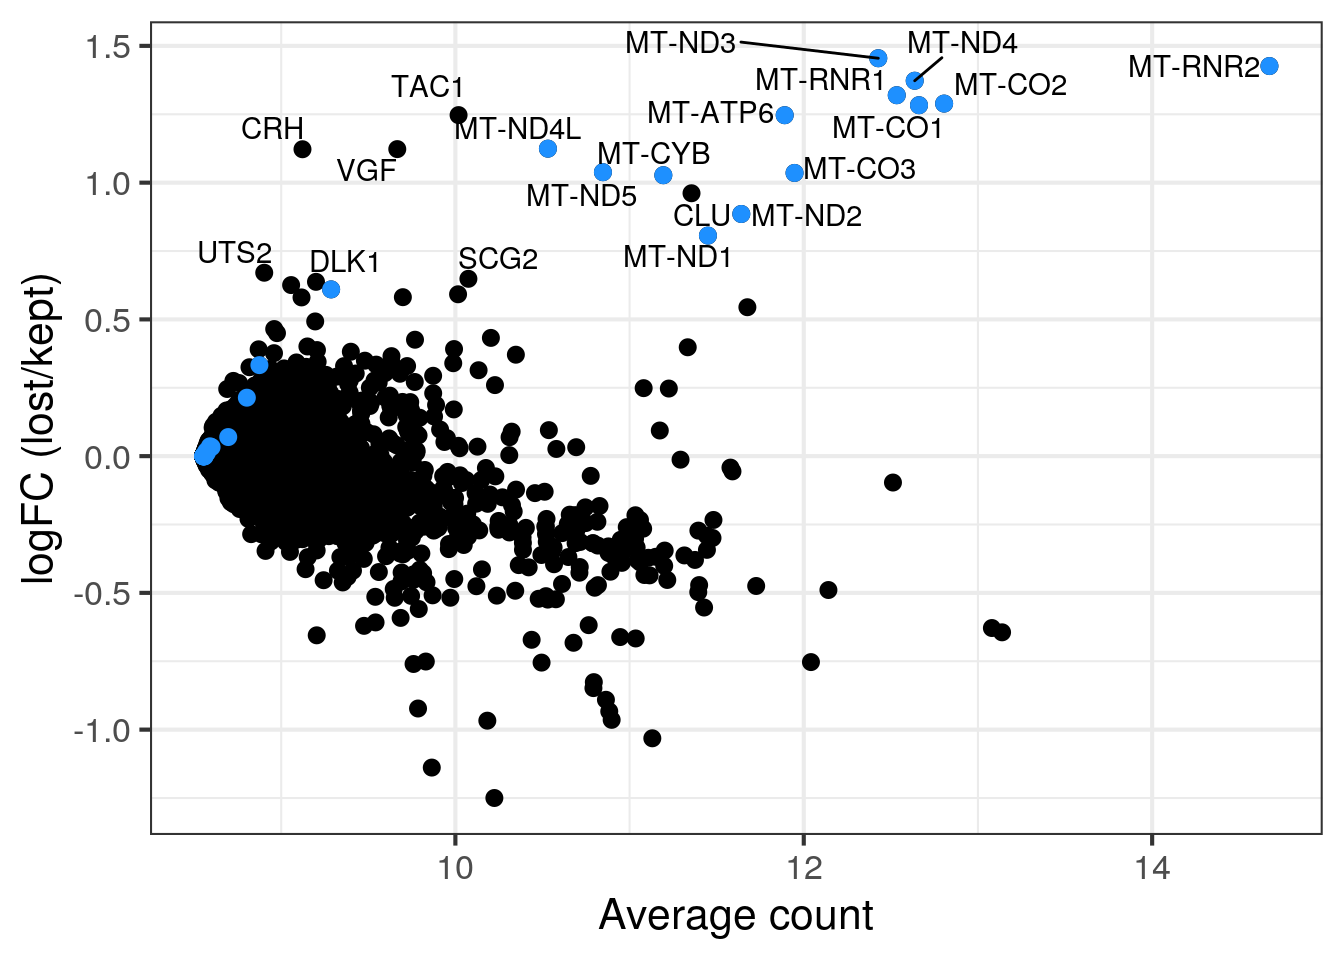
MA plot per sample
for (s in levels(colData(sce)$sample_id)) {
  cat("#### ", s, "\n")
  part <- sce[,colData(sce)$sample_id == s]
  lost <- calculateAverage(counts(part)[,colData(part)$discard])
  kept <- calculateAverage(counts(part)[,!colData(part)$discard])
  logged <- cpm(cbind(lost, kept), log=TRUE, prior.count=2)
  logFC <- logged[,1] - logged[,2]
  abundance <- rowMeans(logged)
  ## only label genes with high logFC
  label <- rep("", length(logFC))
  top <- order(logFC, decreasing = TRUE)[1:20]
  label[top]  <- rowData(part)$symbol[top]
  df <- data.frame(abundance = abundance, logFC = logFC, label = label)
  mito <- grep("MT-", rownames(part), value = TRUE)
  p <- ggplot(df, aes(x = abundance, y = logFC, label = label)) +
    geom_point(size = 2.5) +
    geom_point(data = df[mito,], color = "dodgerblue", size = 2.5) +
    xlab("Average count") + ylab("logFC (lost/kept)") +
    theme_bw(base_size = 16) +
    geom_text_repel()
  print(p)
  cat("\n\n")
}
1NSC
2NSC
3NC52
4NC52
5NC96
Removal of outlier cells
We remove the outlier cells and filter the genes:
## summary of the kept cells
nr <- table(cd$sample_id)
nr_fil <- table(cd$sample_id[!cd$discard])
print(rbind(
    unfiltered = nr, filtered = nr_fil,
    "%" = round(nr_fil / nr * 100, digits = 0)))
1NSC 2NSC 3NC52 4NC52 5NC96 6NC96
unfiltered 8893 8854 9109 8865 6571 6289
filtered 8331 8408 8687 7438 3538 4595
% 94 95 95 84 54 73## discard the outlier cells
dim(sce)[1] 19375 48581sce <- sce[,!cd$discard]
dim(sce)[1] 19375 40997## we filter genes and require > 1 count in at least 20 cells
sce_filtered <- sce[rowSums(counts(sce) > 1) >= 20, ]
dim(sce_filtered)[1] 13254 40997## number of cells per sample
sce_filtered$sample_id %>% table.
1NSC 2NSC 3NC52 4NC52 5NC96 6NC96
8331 8408 8687 7438 3538 4595 ## number of UMIs per cells and sample
colData(sce_filtered) %>% as.data.frame %>%
dplyr::group_by(sample_id) %>%
summarize(min = min(sum), median = median(sum),
mean = mean(sum), max = max(sum))# A tibble: 6 x 5
sample_id min median mean max
<fct> <int> <dbl> <dbl> <int>
1 1NSC 1398 4788 5362. 16052
2 2NSC 1493 4886. 5457. 15725
3 3NC52 3497 6185 6896. 19285
4 4NC52 1337 7667 8496. 38981
5 5NC96 5001 13224 14898. 89589
6 6NC96 5032 16052 17878. 78841# number of detected genes per cell and sample
colData(sce_filtered) %>% as.data.frame %>%
dplyr::group_by(sample_id) %>%
summarize(min = min(detected), median = median(detected),
mean = mean(detected), max = max(detected))# A tibble: 6 x 5
sample_id min median mean max
<fct> <int> <dbl> <dbl> <int>
1 1NSC 927 2081 2189. 4826
2 2NSC 952 2087 2199. 4732
3 3NC52 1366 2810 2919. 5698
4 4NC52 1051 3235 3269. 6797
5 5NC96 2500 4372 4391. 9218
6 6NC96 2508 4784 4876. 8593Save data to RDS
saveRDS(sce_filtered, file.path("output", "sce_03_filtering.rds"))
saveRDS(sce, file.path("output", "sce_03_filtering_all_genes.rds"))
sessionInfo()R version 4.0.0 (2020-04-24)
Platform: x86_64-pc-linux-gnu (64-bit)
Running under: Ubuntu 18.04.5 LTS
Matrix products: default
BLAS: /usr/local/R/R-4.0.0/lib/libRblas.so
LAPACK: /usr/local/R/R-4.0.0/lib/libRlapack.so
locale:
[1] LC_CTYPE=en_US.UTF-8 LC_NUMERIC=C
[3] LC_TIME=en_US.UTF-8 LC_COLLATE=en_US.UTF-8
[5] LC_MONETARY=en_US.UTF-8 LC_MESSAGES=en_US.UTF-8
[7] LC_PAPER=en_US.UTF-8 LC_NAME=C
[9] LC_ADDRESS=C LC_TELEPHONE=C
[11] LC_MEASUREMENT=en_US.UTF-8 LC_IDENTIFICATION=C
attached base packages:
[1] parallel stats4 stats graphics grDevices utils datasets
[8] methods base
other attached packages:
[1] HDF5Array_1.16.1 rhdf5_2.32.2
[3] ggrepel_0.8.2 edgeR_3.30.3
[5] limma_3.44.3 dplyr_1.0.2
[7] LSD_4.1-0 scater_1.16.2
[9] ggplot2_3.3.2 SingleCellExperiment_1.10.1
[11] SummarizedExperiment_1.18.1 DelayedArray_0.14.0
[13] matrixStats_0.56.0 Biobase_2.48.0
[15] GenomicRanges_1.40.0 GenomeInfoDb_1.24.2
[17] IRanges_2.22.2 S4Vectors_0.26.1
[19] BiocGenerics_0.34.0 workflowr_1.6.2
loaded via a namespace (and not attached):
[1] viridis_0.5.1 BiocSingular_1.4.0
[3] viridisLite_0.3.0 DelayedMatrixStats_1.10.1
[5] assertthat_0.2.1 GenomeInfoDbData_1.2.3
[7] vipor_0.4.5 yaml_2.2.1
[9] pillar_1.4.6 backports_1.1.9
[11] lattice_0.20-41 glue_1.4.2
[13] digest_0.6.25 promises_1.1.1
[15] XVector_0.28.0 colorspace_1.4-1
[17] cowplot_1.0.0 htmltools_0.5.0
[19] httpuv_1.5.4 Matrix_1.2-18
[21] pkgconfig_2.0.3 zlibbioc_1.34.0
[23] purrr_0.3.4 scales_1.1.1
[25] whisker_0.4 later_1.1.0.1
[27] BiocParallel_1.22.0 git2r_0.27.1
[29] tibble_3.0.3 generics_0.0.2
[31] farver_2.0.3 ellipsis_0.3.1
[33] withr_2.2.0 cli_2.0.2
[35] magrittr_1.5 crayon_1.3.4
[37] evaluate_0.14 fansi_0.4.1
[39] fs_1.4.2 beeswarm_0.2.3
[41] tools_4.0.0 lifecycle_0.2.0
[43] stringr_1.4.0 Rhdf5lib_1.10.0
[45] munsell_0.5.0 locfit_1.5-9.4
[47] irlba_2.3.3 compiler_4.0.0
[49] rsvd_1.0.3 rlang_0.4.7
[51] grid_4.0.0 RCurl_1.98-1.3
[53] BiocNeighbors_1.6.0 labeling_0.3
[55] bitops_1.0-6 rmarkdown_2.3
[57] gtable_0.3.0 codetools_0.2-16
[59] R6_2.4.1 gridExtra_2.3
[61] knitr_1.29 utf8_1.1.4
[63] rprojroot_1.3-2 stringi_1.4.6
[65] ggbeeswarm_0.6.0 Rcpp_1.0.5
[67] vctrs_0.3.4 tidyselect_1.1.0
[69] xfun_0.15